•The personal income per capita for the seven county region of Southeast Michigan has increased since 2009;
•The Purchasing Manager’s Index for Southeast Michigan increased from July 2013 to August 2013; (monthly)
•The Commodity Price Index experienced an increase from September 2013 to October 2013 for Southeast Michigan; (monthly)
•Standard and Poor’s Case-Shiller Index show that the prices of homes in the Detroit area experienced a small decrease; (monthly)
•The number of building permits obtained in Wayne and Oakland Counties increased from September 2013 to October 2013; (monthly).
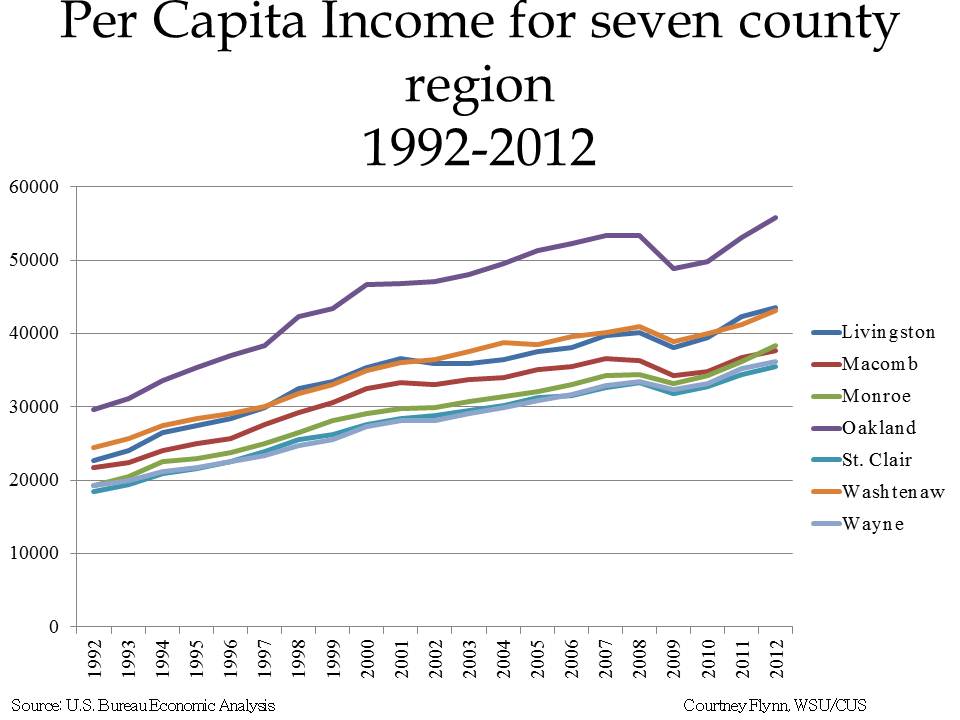
The typical trend for the per capita income for the seven county region has been an increase since 1992. Reflective of the recession, personal incomes in all seven counties decreased in 2009, but have been increasing since then.
The personal income per capita has always been the highest for Oakland County, which was recorded at $55,761 in 2012, and the lowest for Wayne and St. Clair counties, which were recorded at $35,458 and $34,548 respectively in 2012.
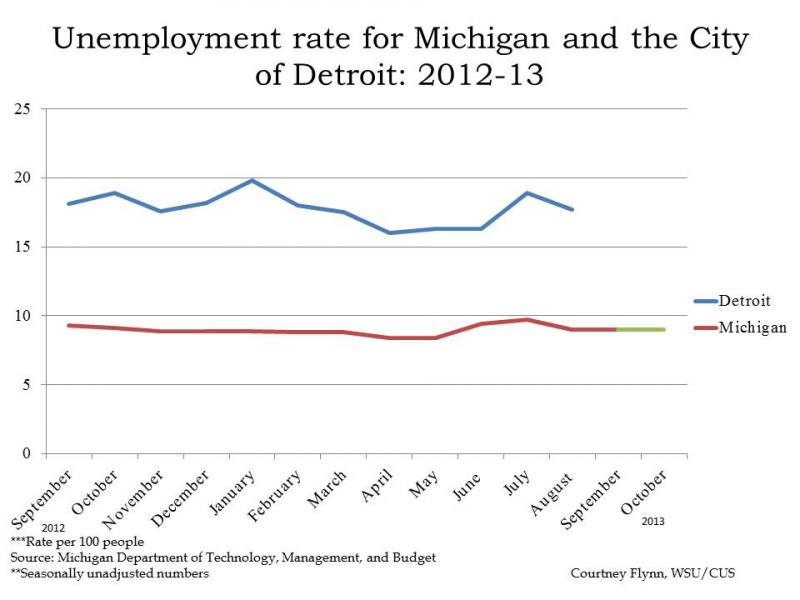
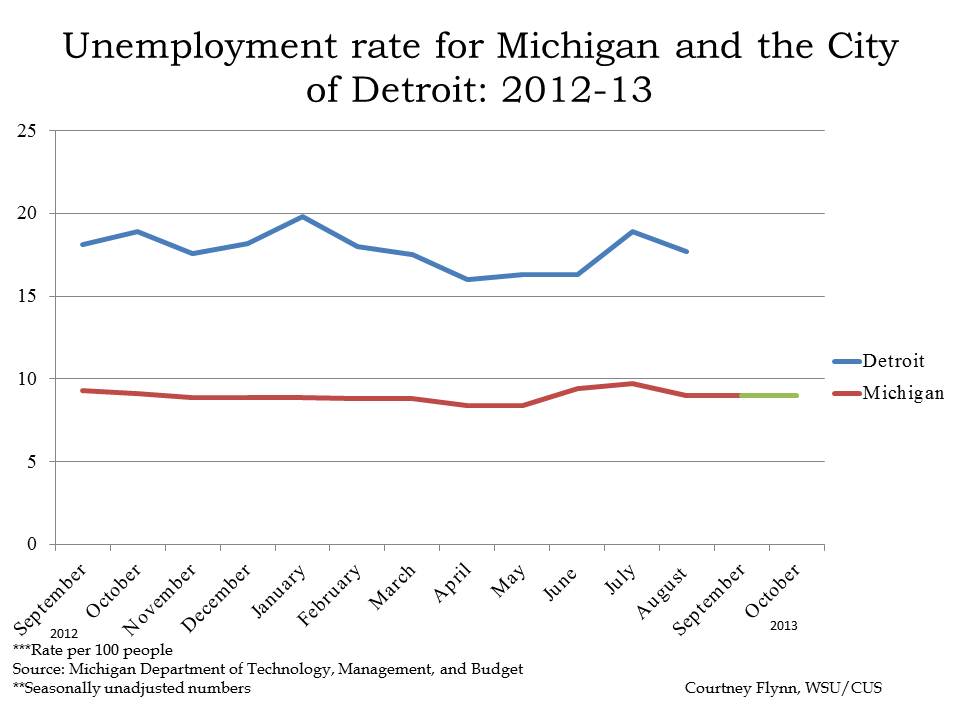
According to the most recent data provided by the Michigan Department of Technology, Management and Budget, from August to September of this year the unemployment rate for the State of Michigan has remained at 9 percent. The 9 percent unemployment rate for October 2013 was 0.1 percent higher of where it was at that time the previous year.
Employment numbers for Detroit, and other localities in the State of Michigan, were not available for September or October because of the government shutdown in October.
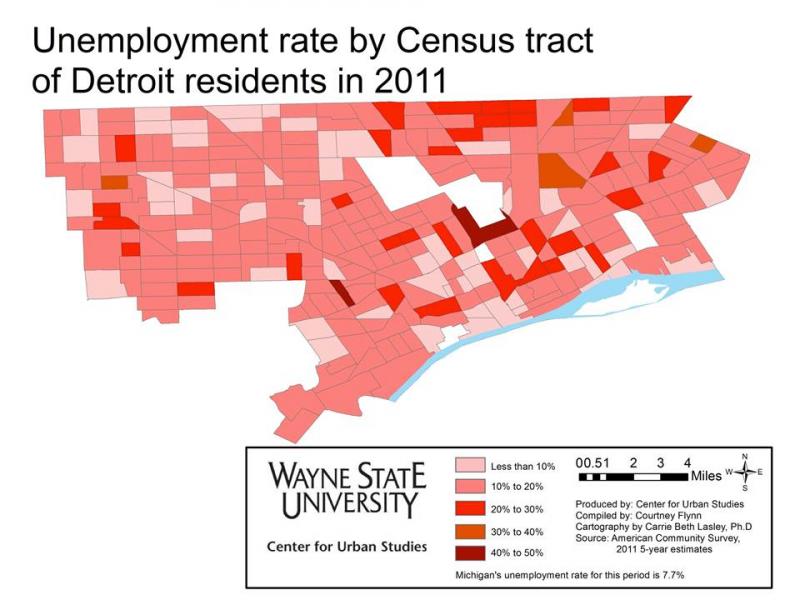
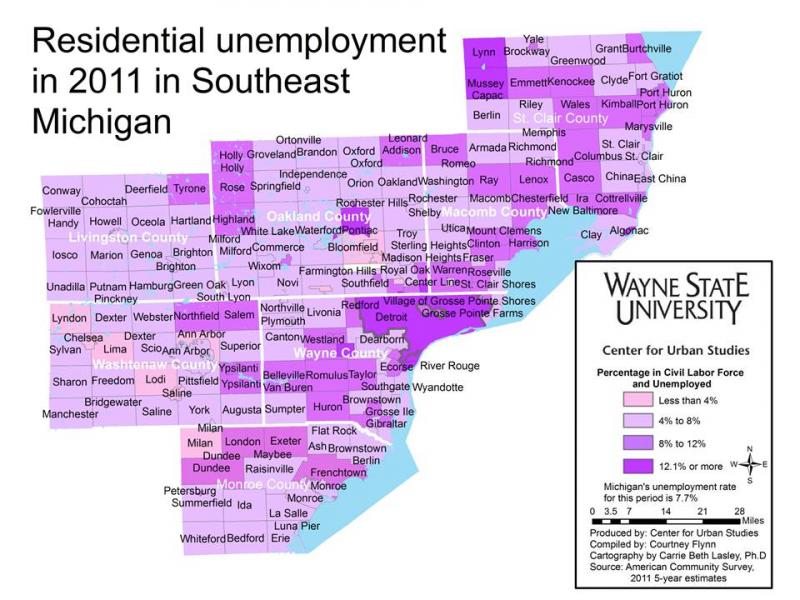
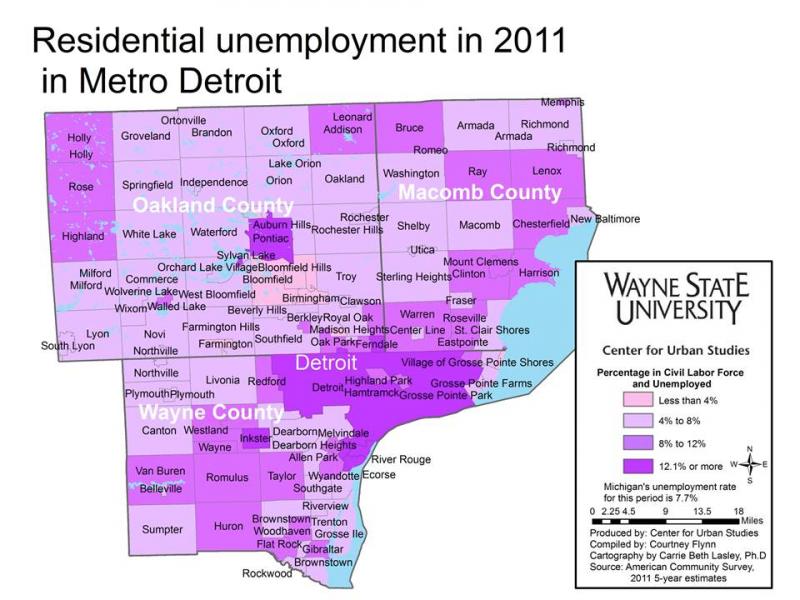
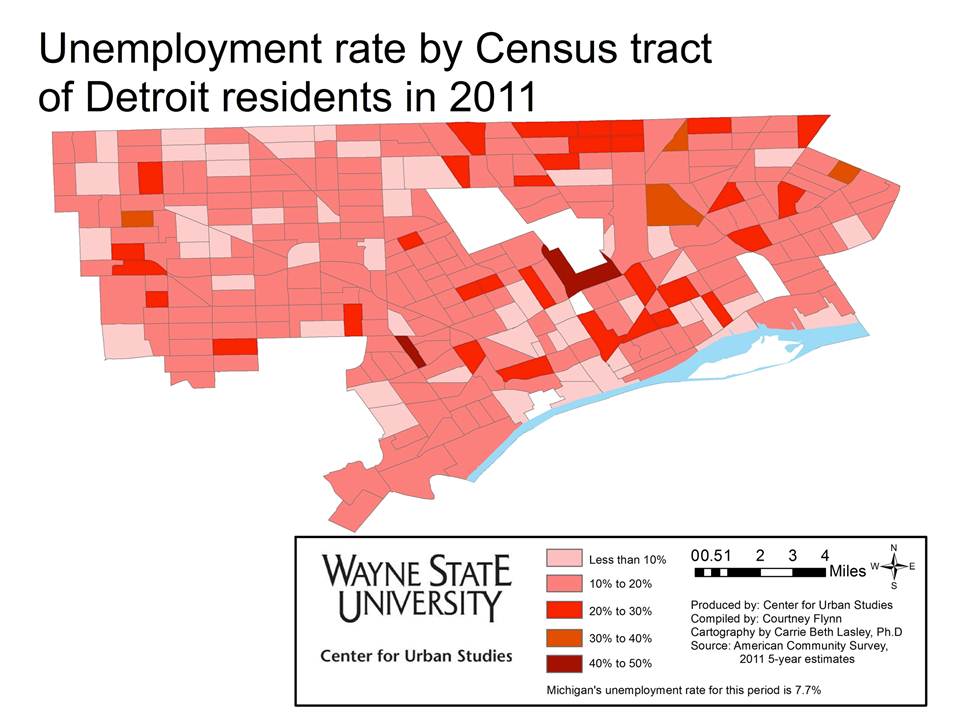
Although recent unemployment data is currently unavailable, the above maps show unemployment rates for 2011 from the American Community Survey. The maps display data showing those who are both in the civil labor force and unemployed, representing the number of people actively looking for a job but not finding one. In both the seven county (Livingston, Macomb, Monroe, Oakland, St. Clair, Washtenaw, and Wayne counties) and three county (Wayne, Macomb, and Oakland) regions, Detroit, Inkster and Pontiac had the highest unemployment rates. All three cities had unemployment rates above 12.1 percent, compared to the state average at the time of 7.7 percent.
There were two Census tracts in Detroit, one just outside of Hamtramck and one in Southwest Detroit, where the unemployment rates were between 40 and 50 percent.
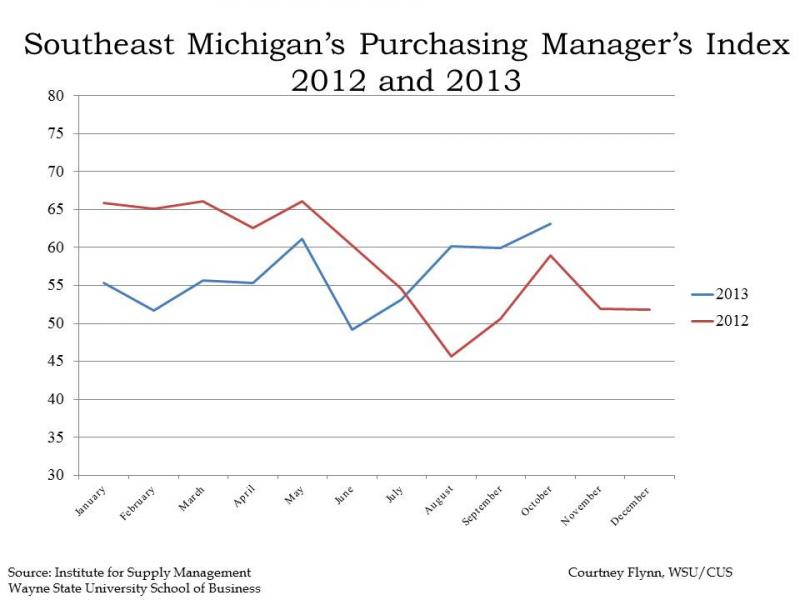
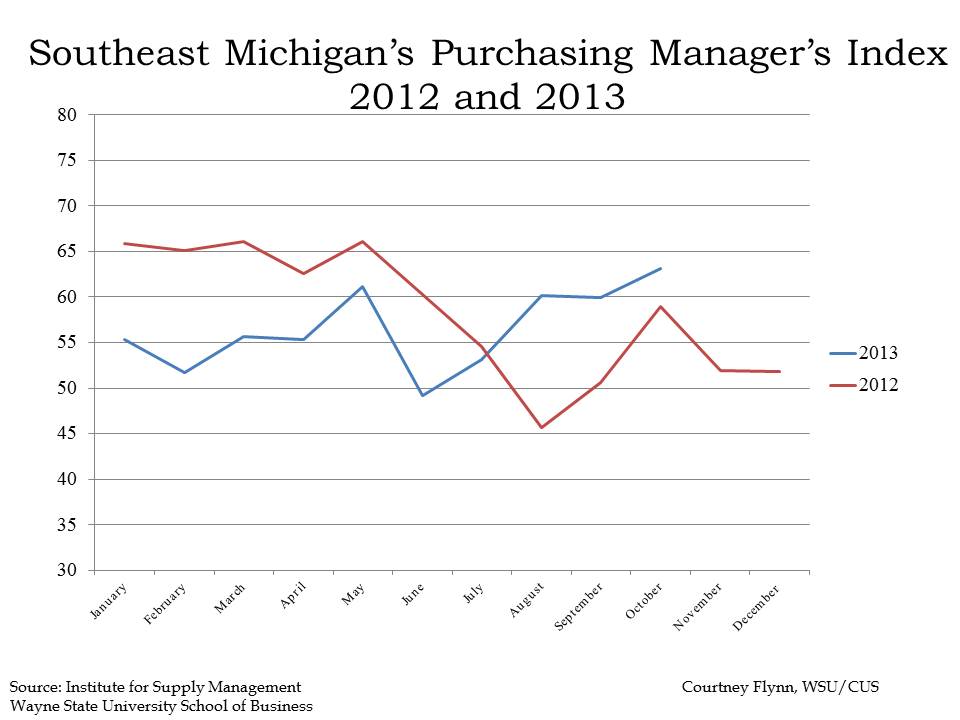
The Purchasing Manger’s Index (PMI) is a composite index derived from five indicators of economic activity: new orders, production, employment, supplier deliveries, and inventories. A PMI above 50 means the economy is expanding.
According to the most recent data released on Southeast Michigan’s Purchasing Manager’s Index, there was an increase of 4.2 points from September 2013 to October 2013. In September 2013, a PMI of 63.1 was recorded which is reflective of an increase in the production activity and new orders index, along with finished goods inventories.
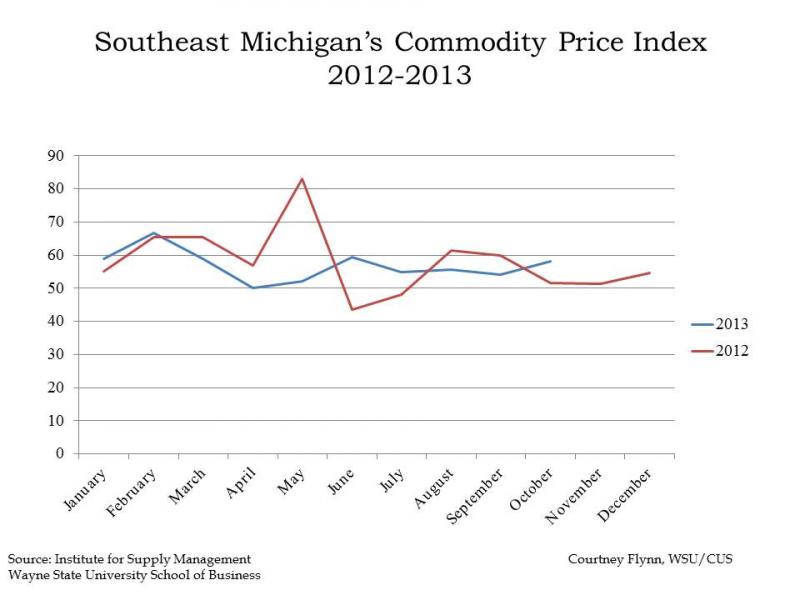
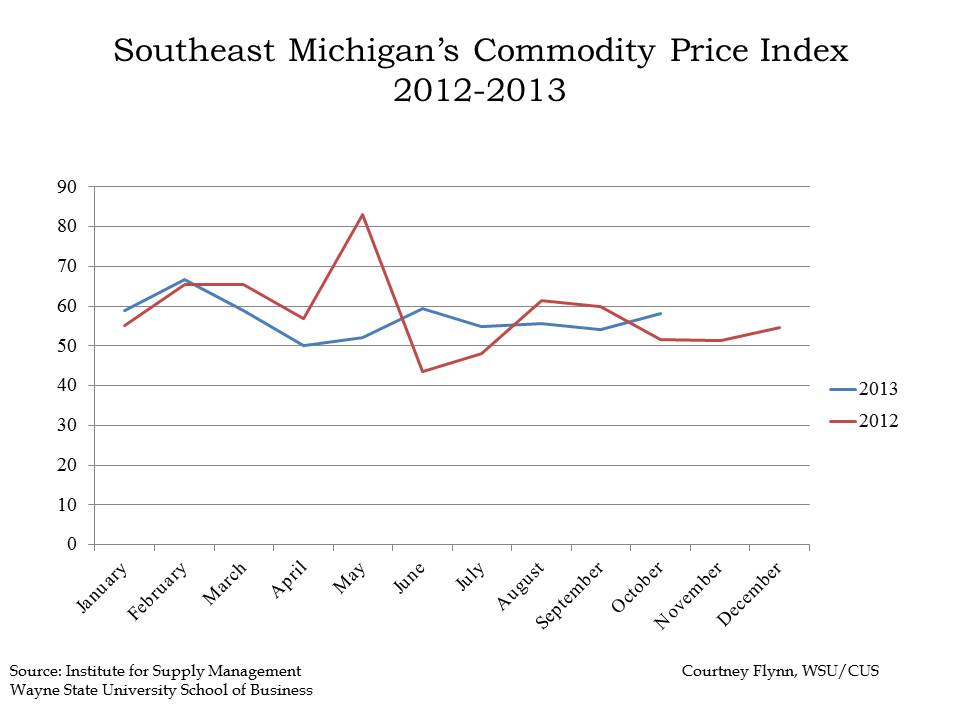
The Commodity Price Index, which is a weighted average of selected commodity prices, was recorded at 58 in October 2013, which was 3.8 higher than the previous month.
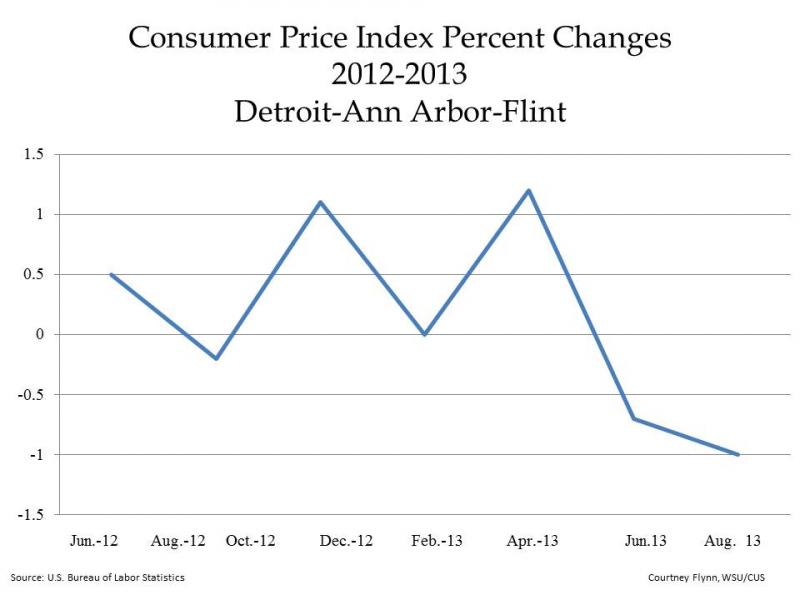

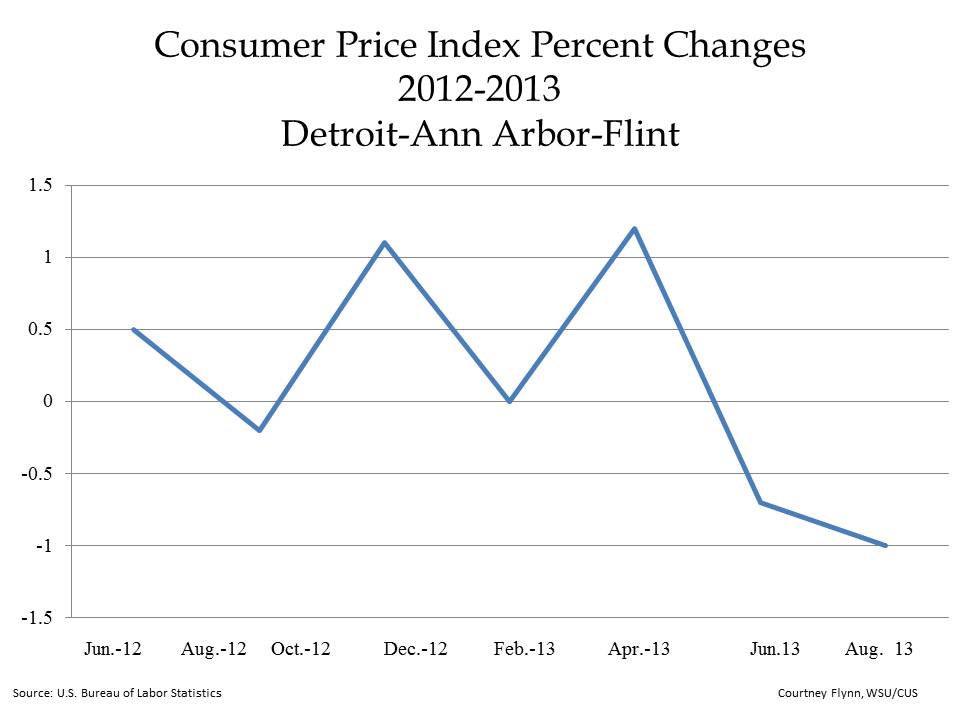
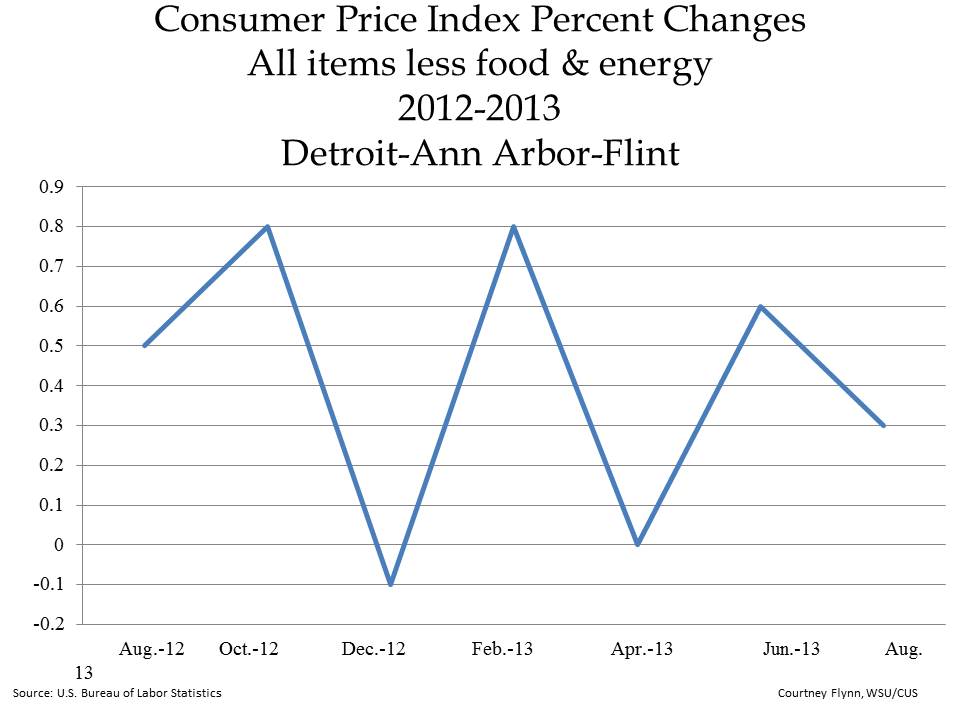
The Consumer Price Index measures the change in prices in a fixed market. The index is based on prices of “food, clothing, shelter, fuels, transportation fares, charges for doctors’ and dentists’ services, drugs, and the other goods and services that people buy for day-to-day living,” according to the Bureau of Labor Statistics.
The above graphs show the percent change in the price index measurements. The first graph shows there was a 1 percent decrease in the overall Consumer Price Index from August to October of 2013 in the Detroit-Ann Arbor-Flint area. According to the Bureau of Labor Statistics, this is mainly based on the fact that energy costs decreased by 2.8 percent over the two month time period and the food index fell by .2 percent.
For the Consumer Price Index Less Food and Energy, there was a 0.3 percent increase in the index from August to October of 2013 because of higher prices for education, communication, airline fares and medical care.
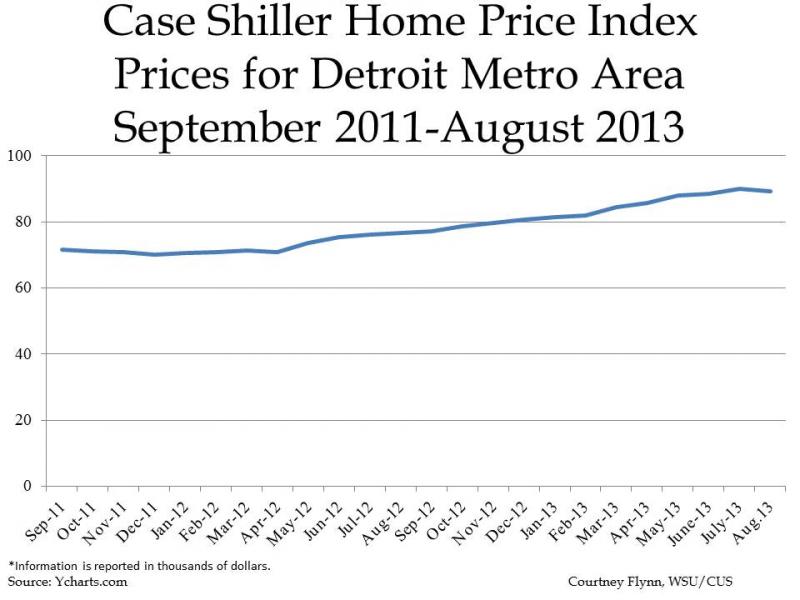

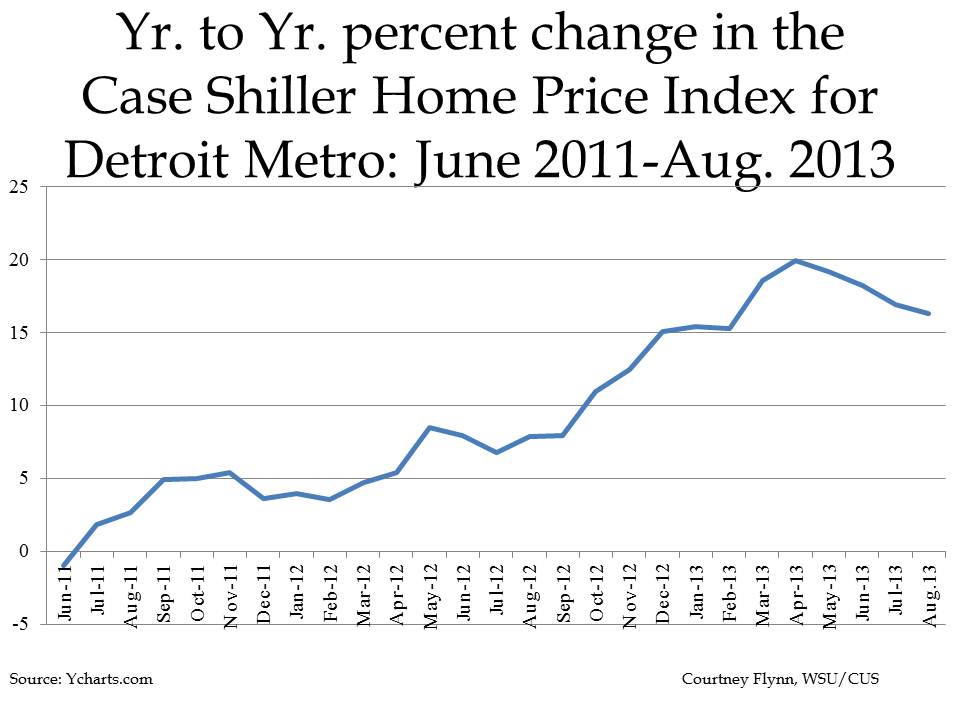
The above charts show the Standard and Poor’s Case Shiller Home Price Index for the Detroit Metropolitan Statistical Area. The index includes the price for homes that have sold but does not include the price of new home construction, condos, or homes that have been remodeled.
According to the index, the average price of single-family dwellings sold in Metro Detroit was $89,160 in August 2013. This was an increase of approximately $9,440 from the average price in August 2012.
The year to year percent change in the Home Price Index showed a slight decrease from the increase the region experienced in July. Between August 2012 and August 2013, there was a 16.34 percent increase in home prices for the Detroit MSA.

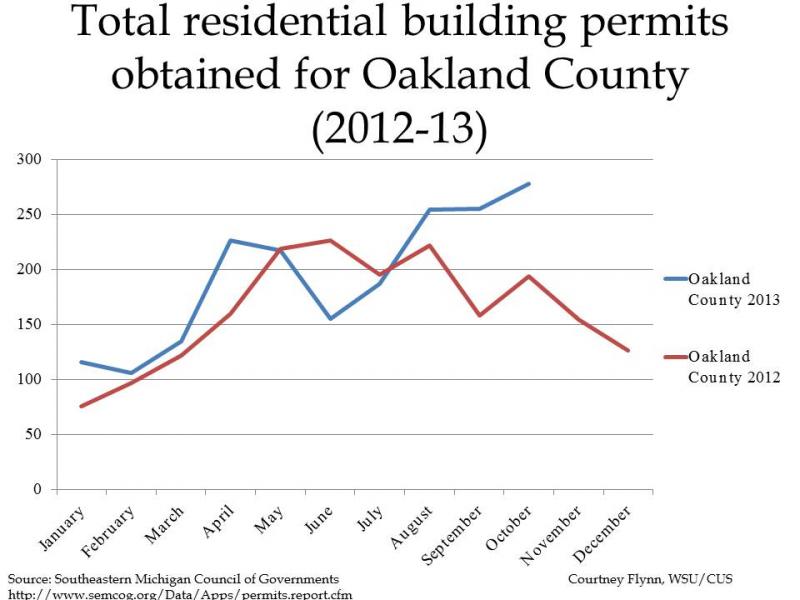
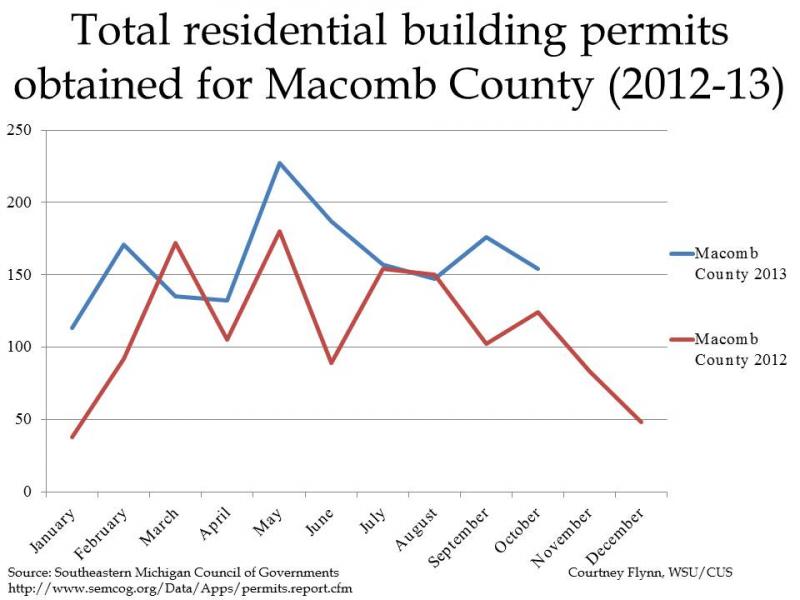
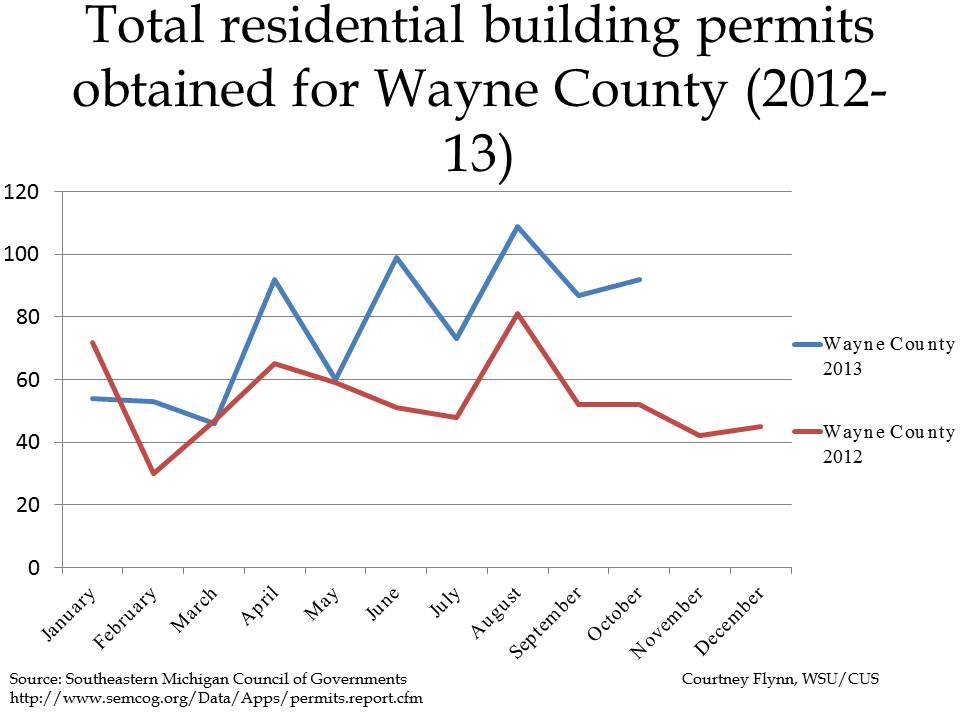
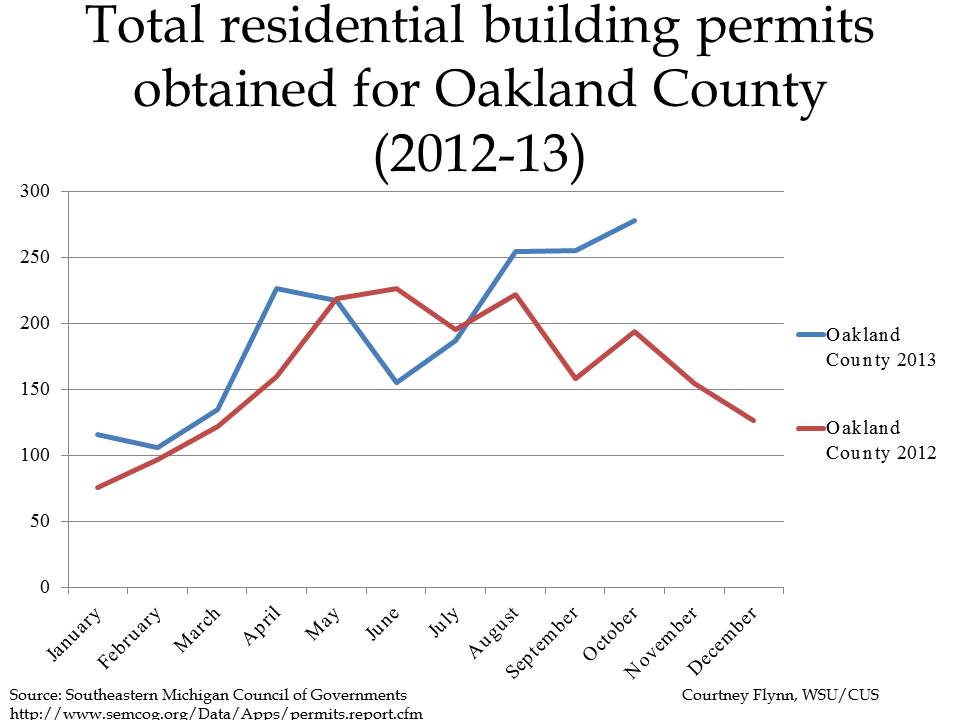
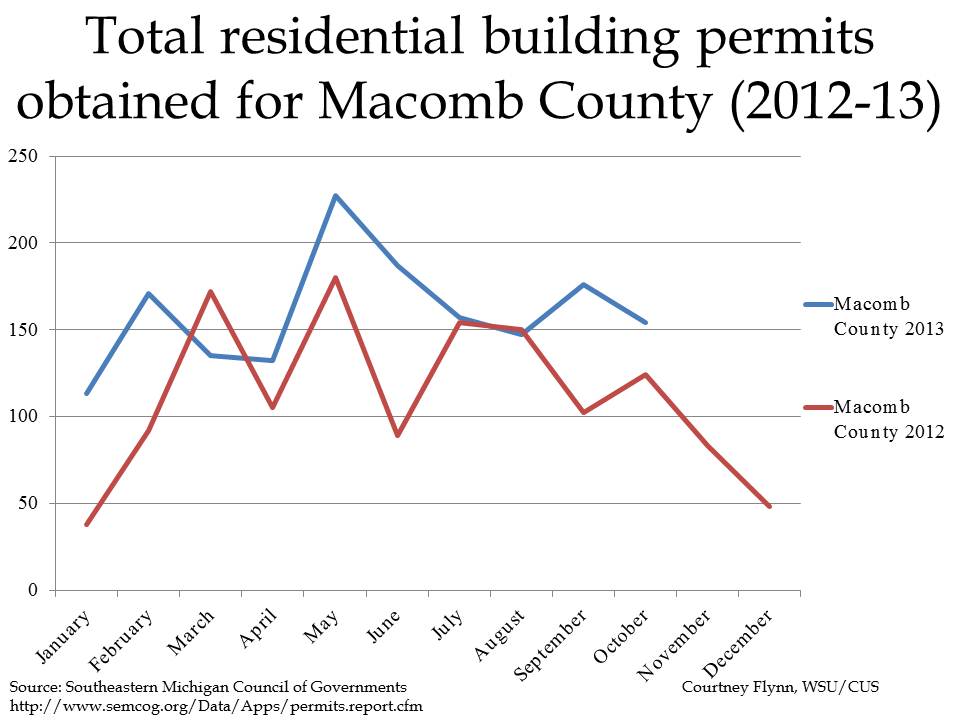
The above charts show the number of residential building permits obtained each month in Wayne, Oakland, and Macomb counties from January 2012 until October 2013. These numbers are reported by local municipalities to the Southeastern Michigan Council of Governments and include single family, two family, attached condo, and multi-family units.
Of the three counties examined, Macomb County was the only county that did not experience an increase in the number of permits obtained from September to October in 2013; rather, the number of permits decreased by 22. The number obtained in Wayne County increased by 5 from September to October 2013 and the number for Oakland County increased by 23 for the same time period.
When comparing the number of permits obtained in October 2012 versus October 2013 for these three counties all showed an increase in the number of permits pulled. In Wayne County there was an increase from 52 to 92, respectively. For Oakland County, 172 building permits were obtained in August of 2012 and 278 were obtained a year later. For Macomb County, there were pulled this year 154 and 124 in October of 2012. All of these numbers represent relatively low levels of residential construction.


