Minorities increasingly distributed across the region

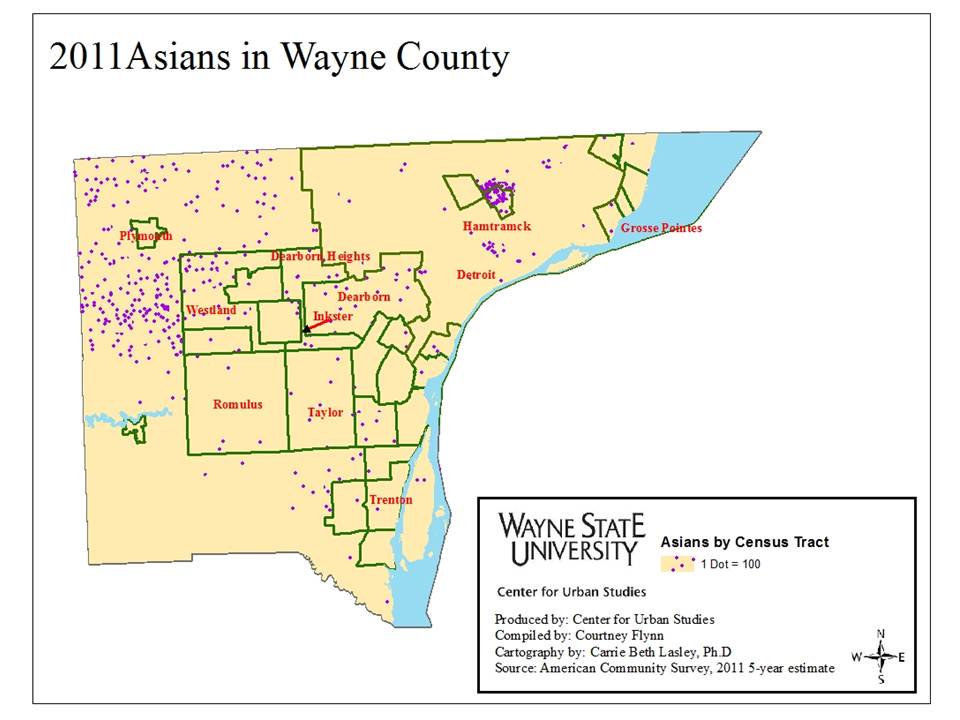
In the following post the percent of minorities that makeup Southeastern Michigan is examined. We examine the overall percent of minorities for the region, in addition to showing, through a dot map, the concentration of African Americans, Asians, and Whites in the region. The maps show that the City of Detroit has the highest percent of minorities in the region, particularly African Americans. However, Asians are largely located outside Detroit, though they represent a smaller portion of minorities.

The information shown throughout this post was obtained from the 2011 American Community Survey, which was based on five year estimates. For the total minority maps the following races are included: African American, Native American, Asian, Pacific Islander, other races and two more races. 

race1

race2

race3

race4

race5

race6

race7

race8WhitesSEMIch2011

race9WhitesMetro2011

WhitesWayne2011


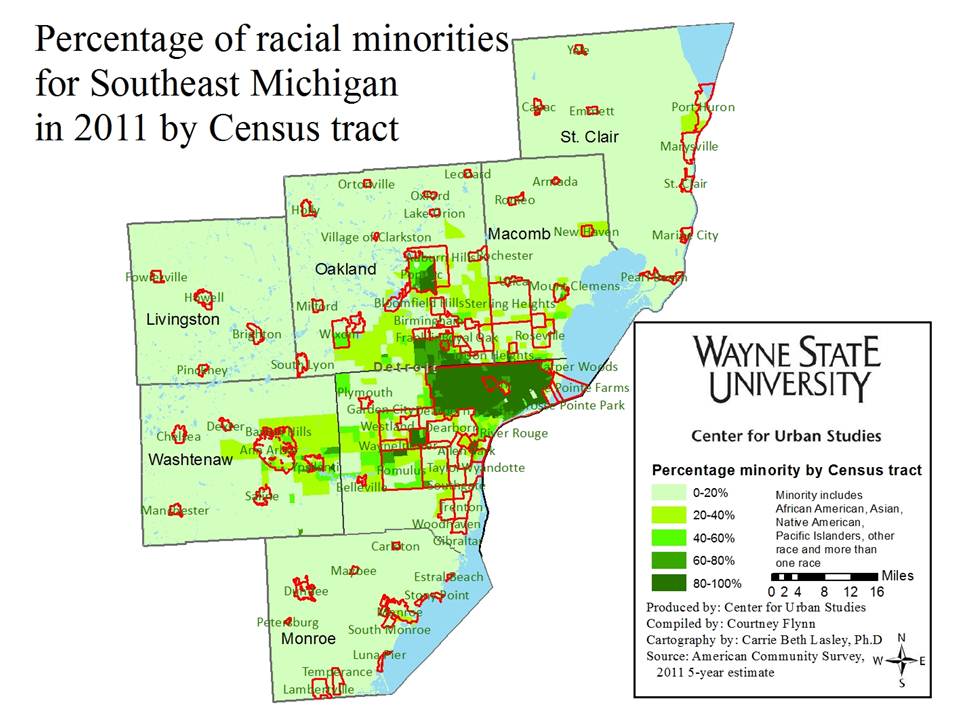
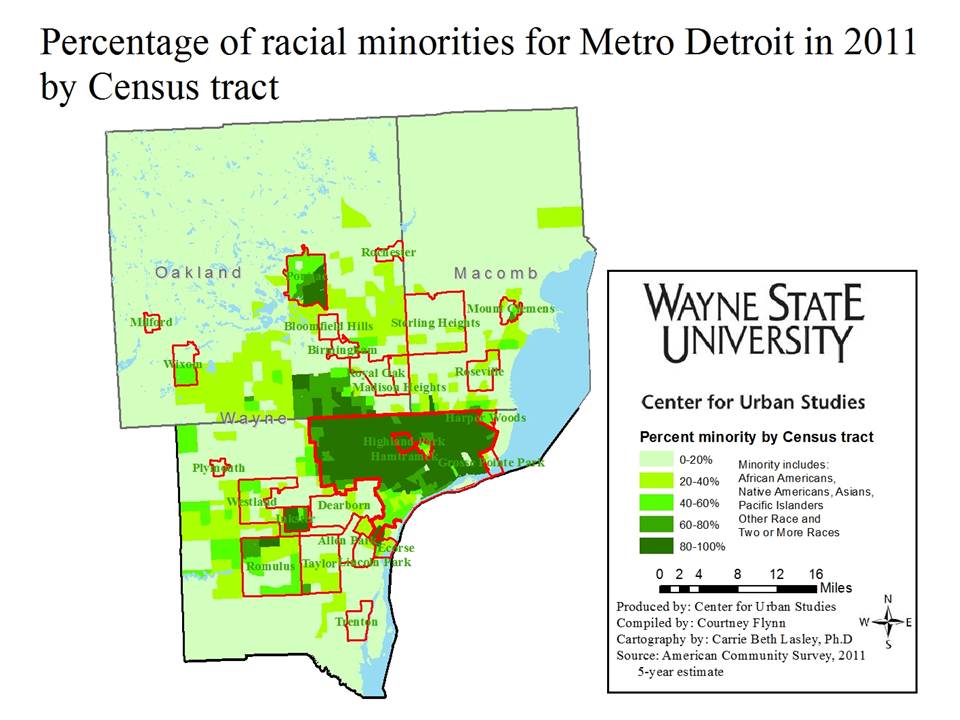
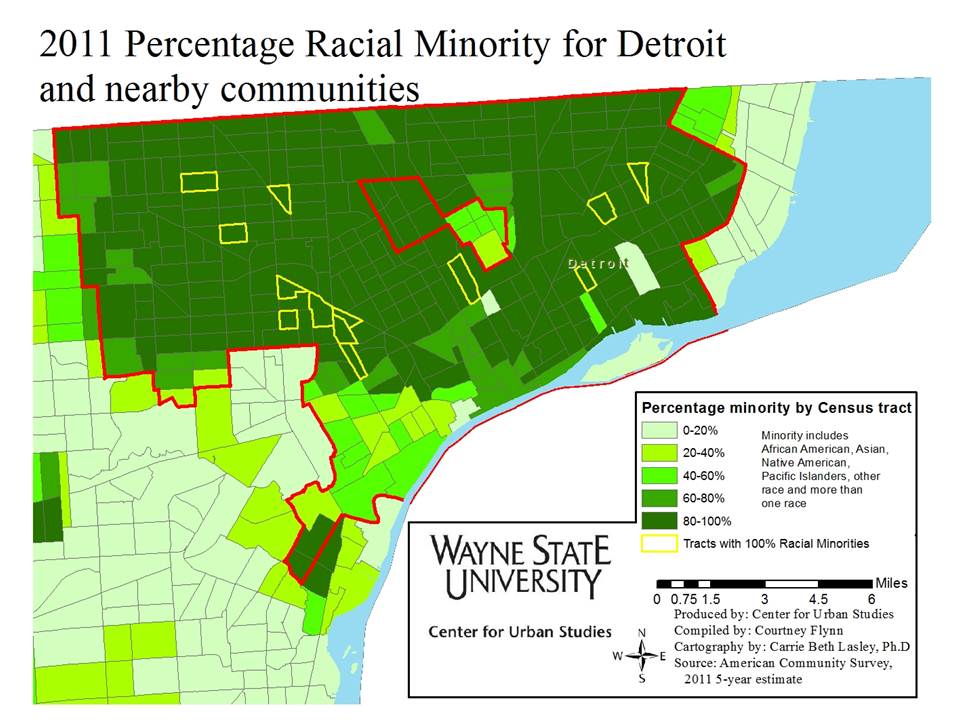
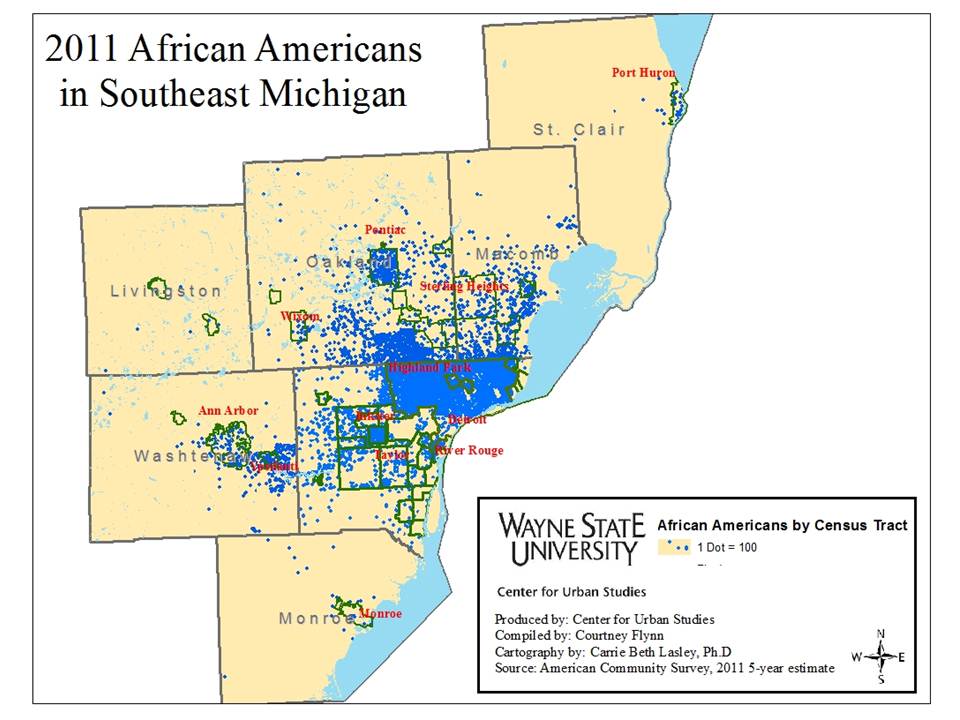
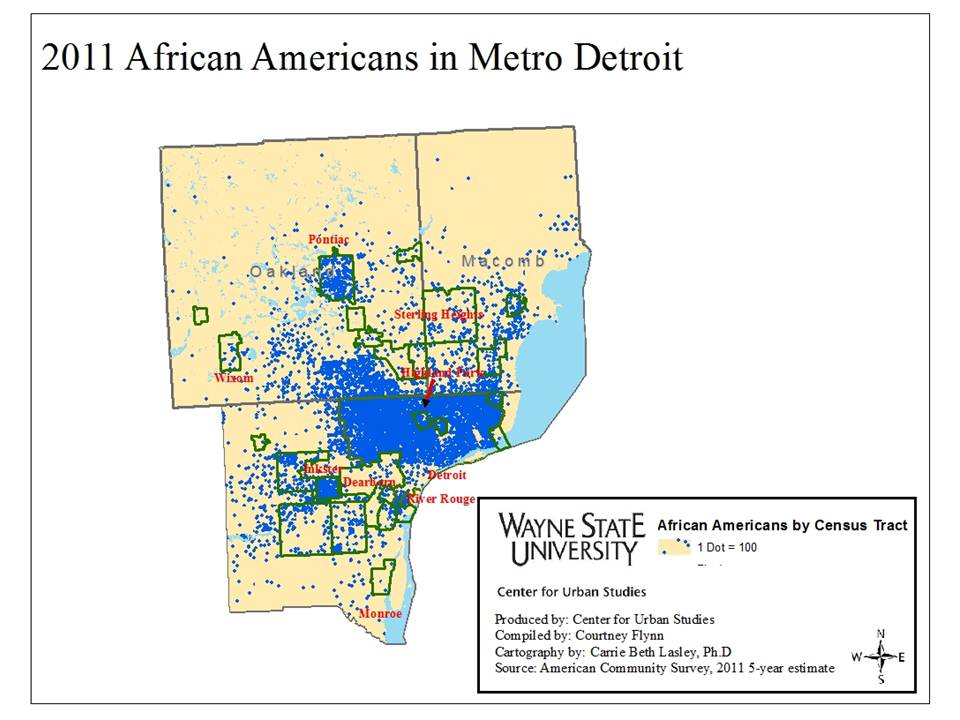
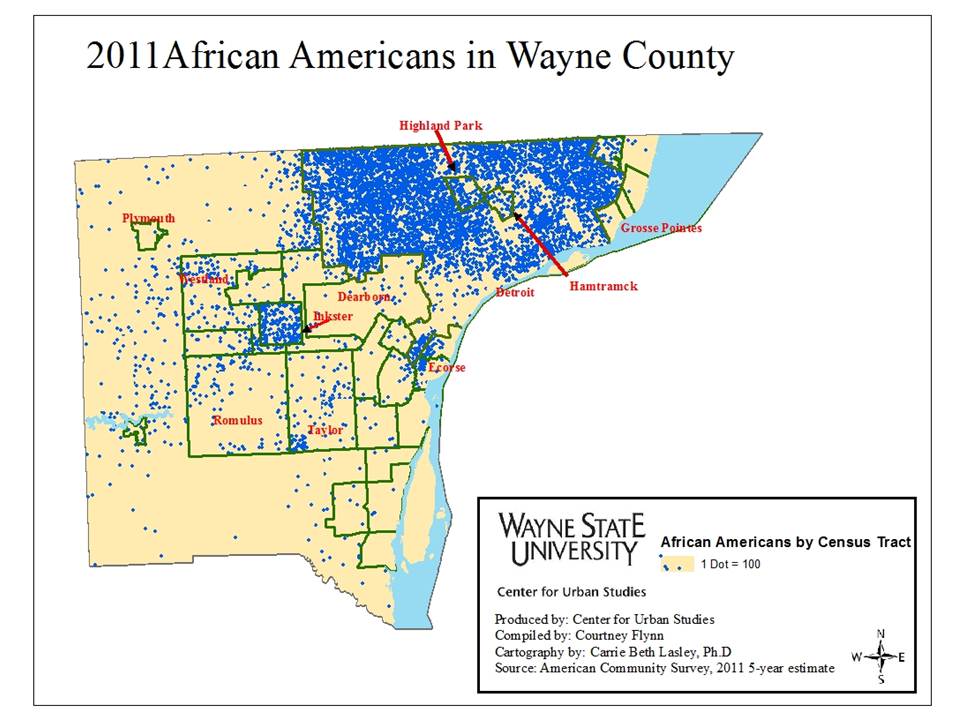
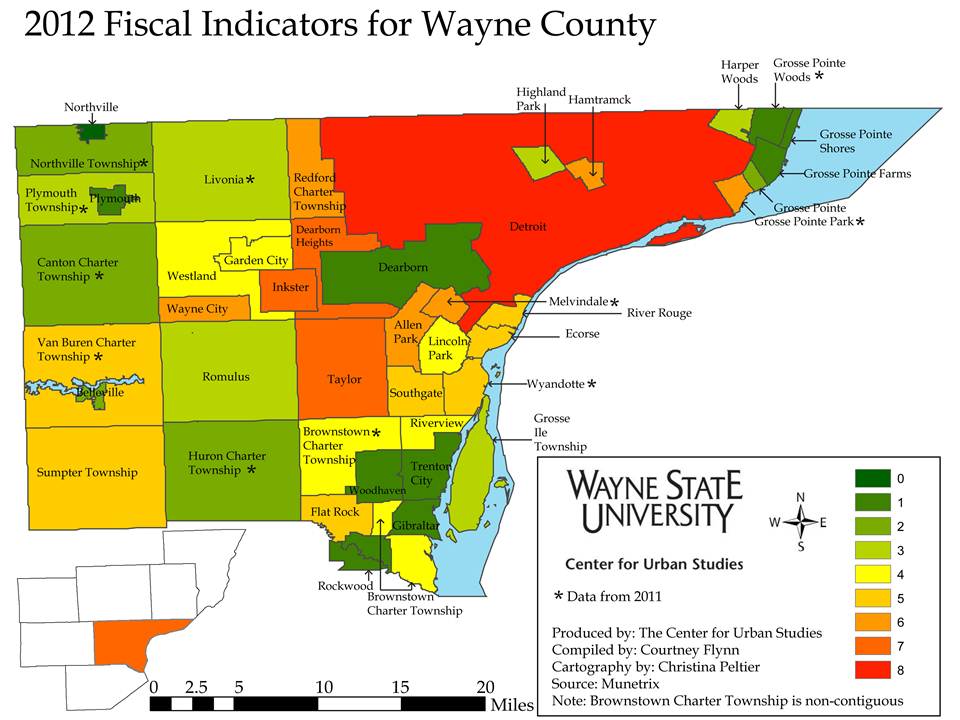
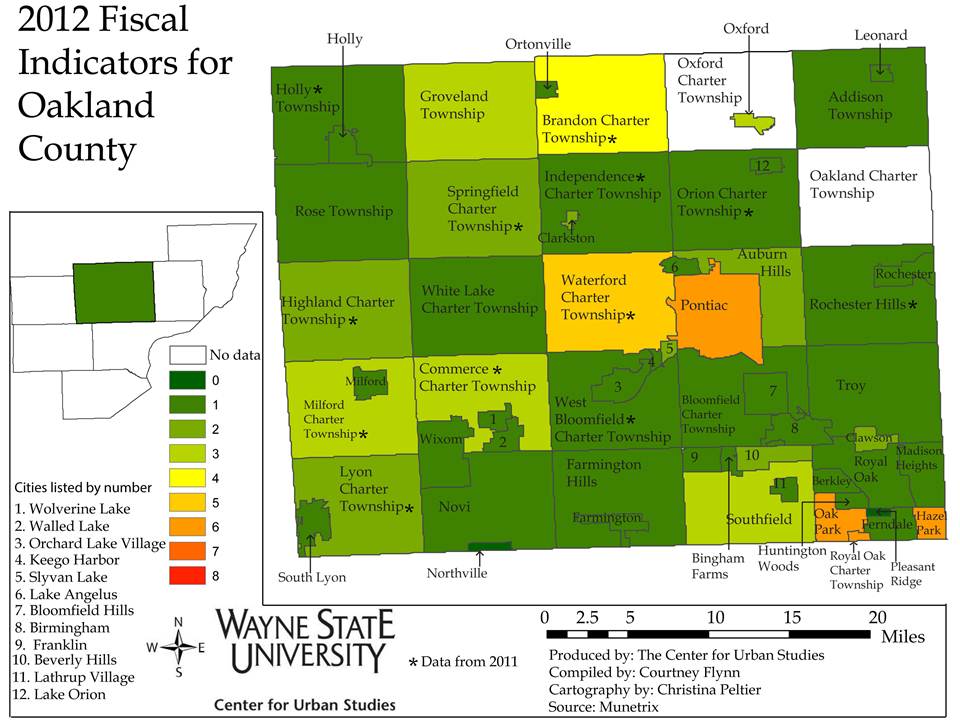
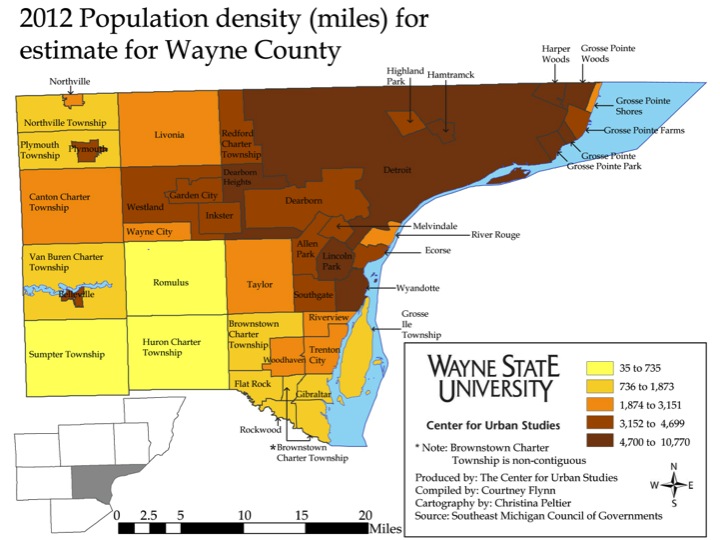
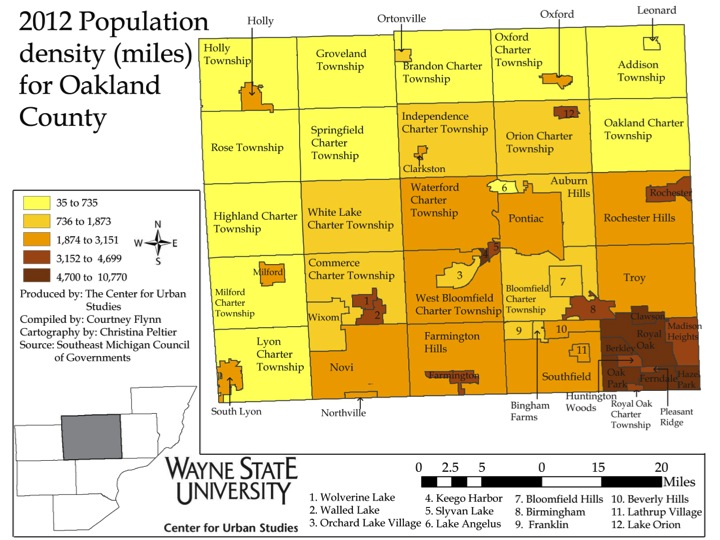
The City of Detroit is predominantly minority, the majority of which are African American, according to the 2011 American Community Survey. While not every neighborhood of Detroit was predominantly minority, there were several-Northwest, Barton-McFarland and portions of the east, west and northeast sides-where 100 percent of the residents were identified as minority. Other areas in the region where the population was made up of between 81 and 100 percent minorities were Pontiac, Inkster, Highland Park and River Rouge.

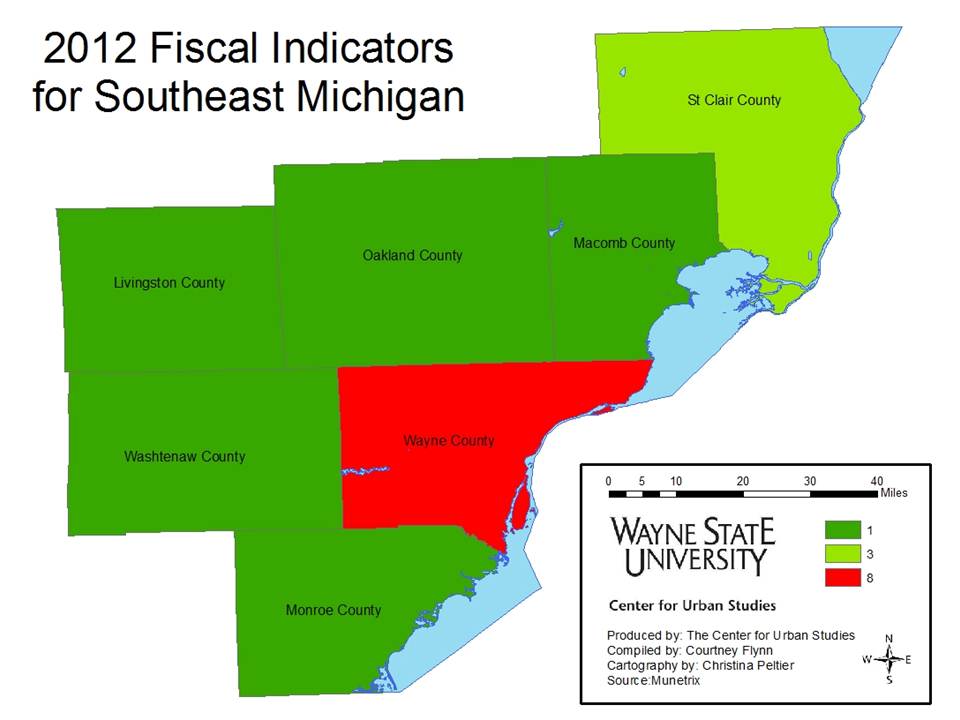
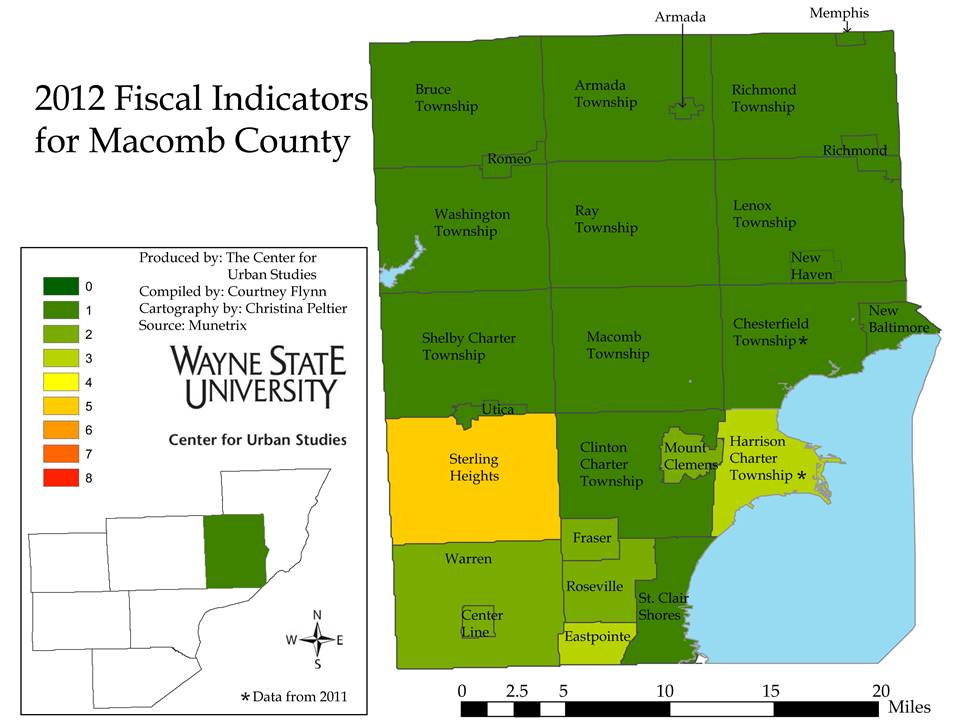
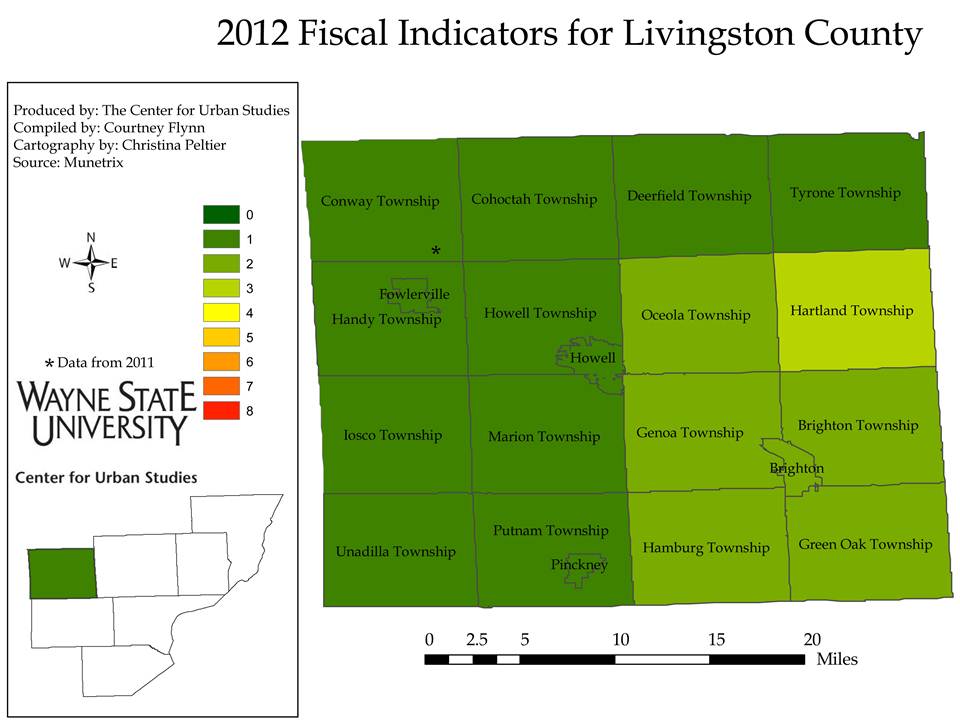
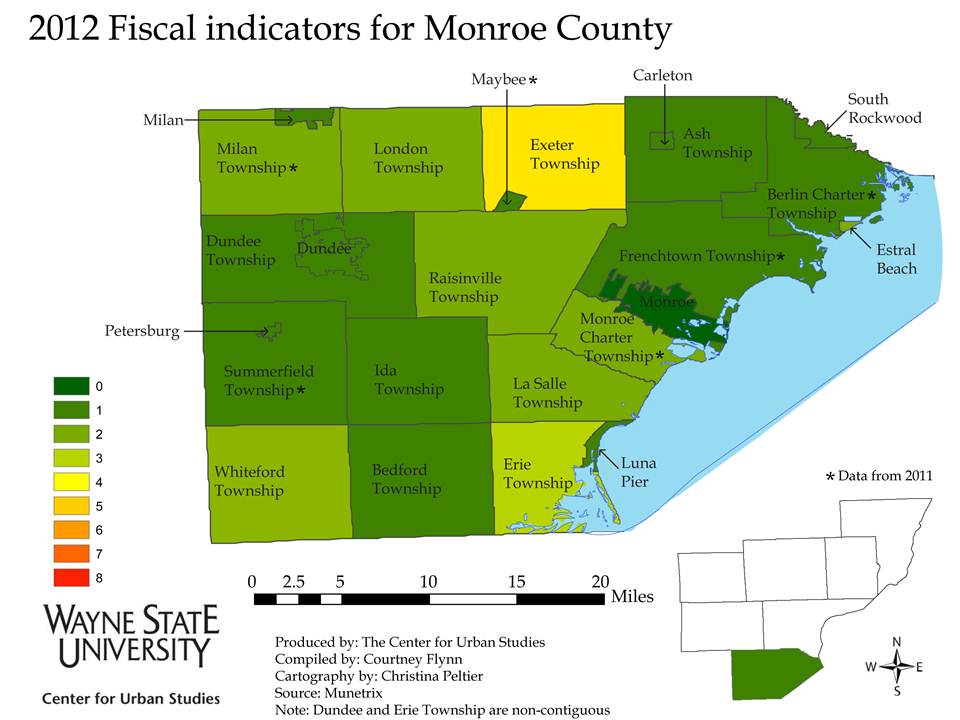
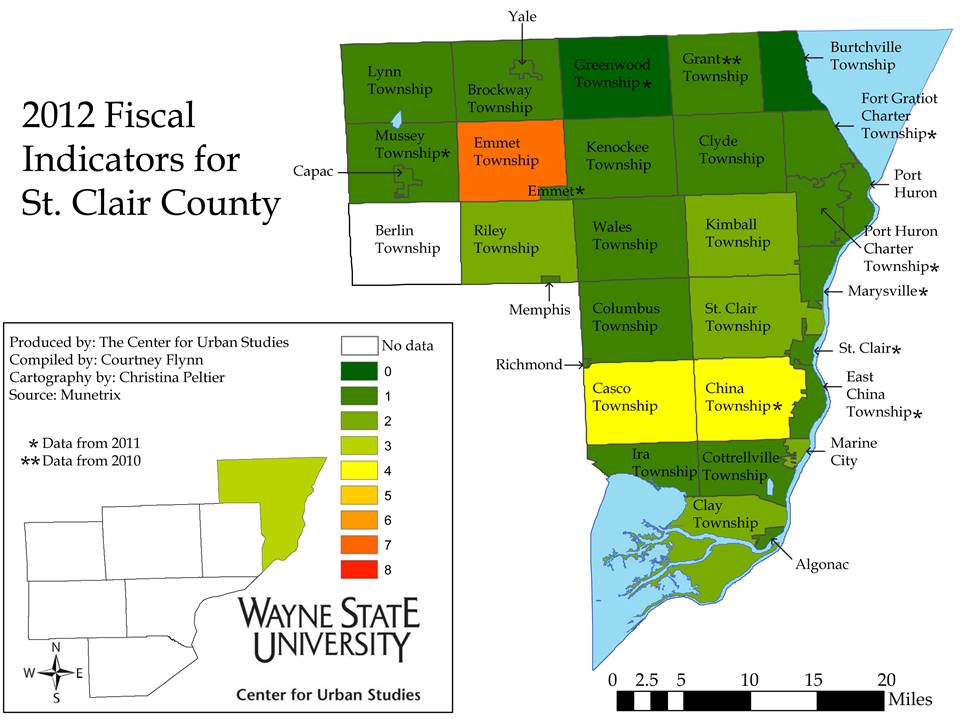
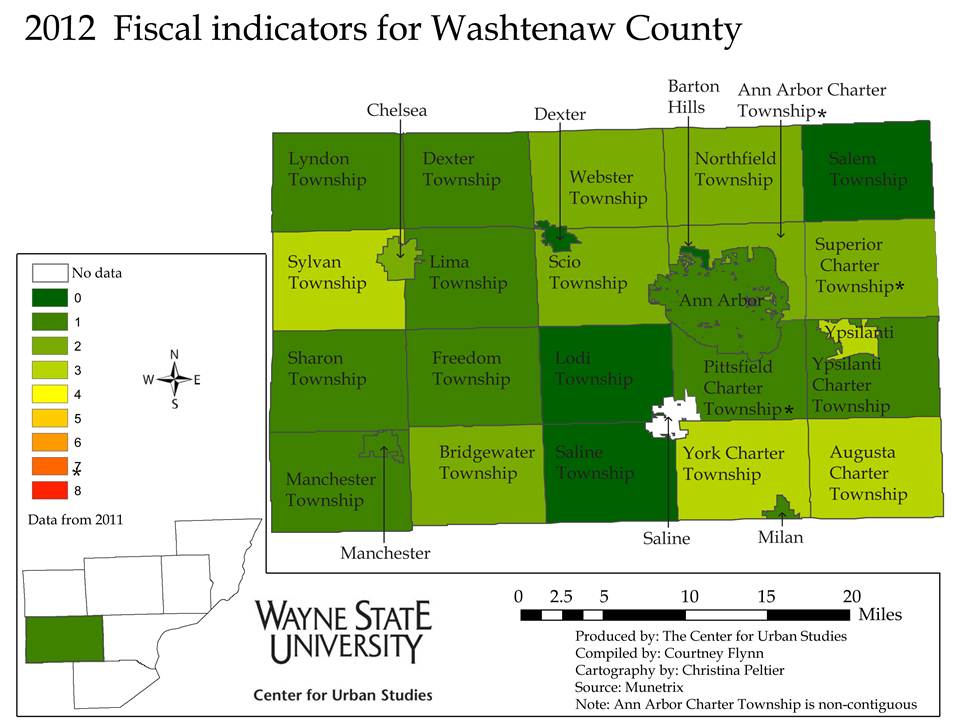
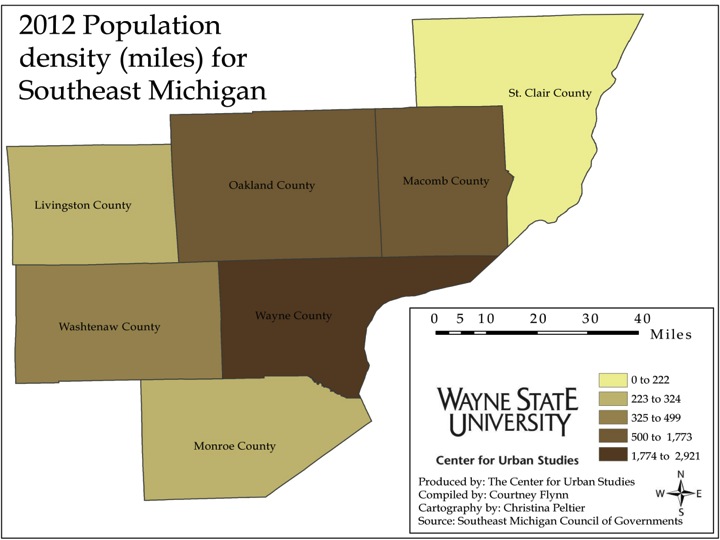
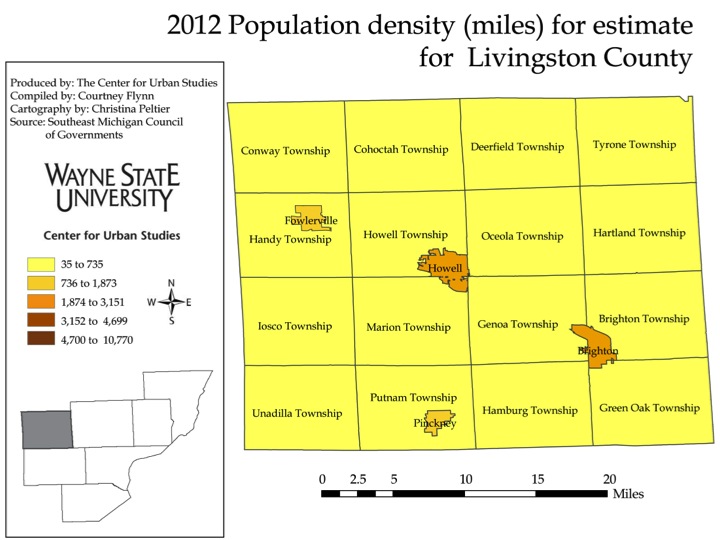
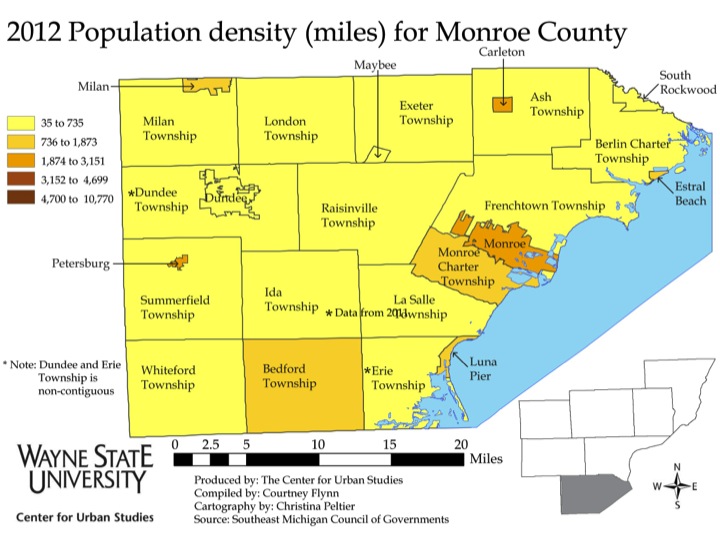
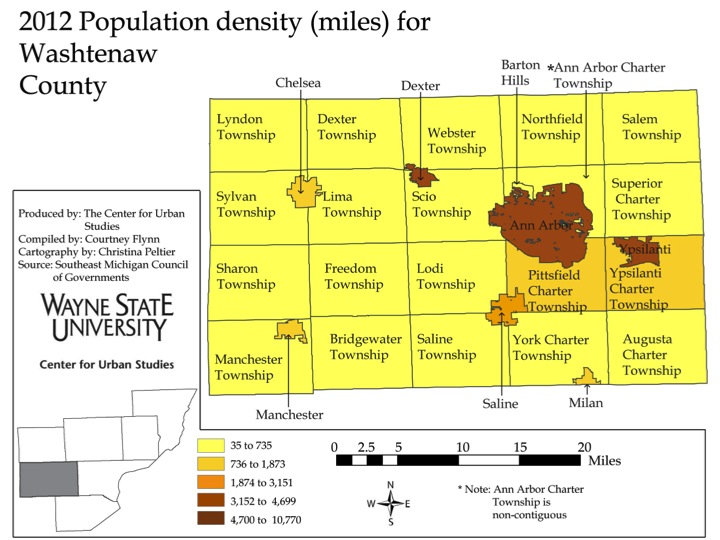
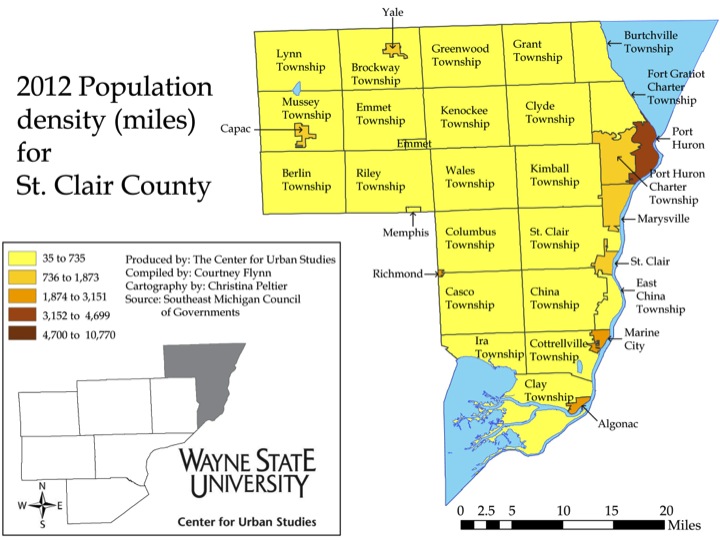
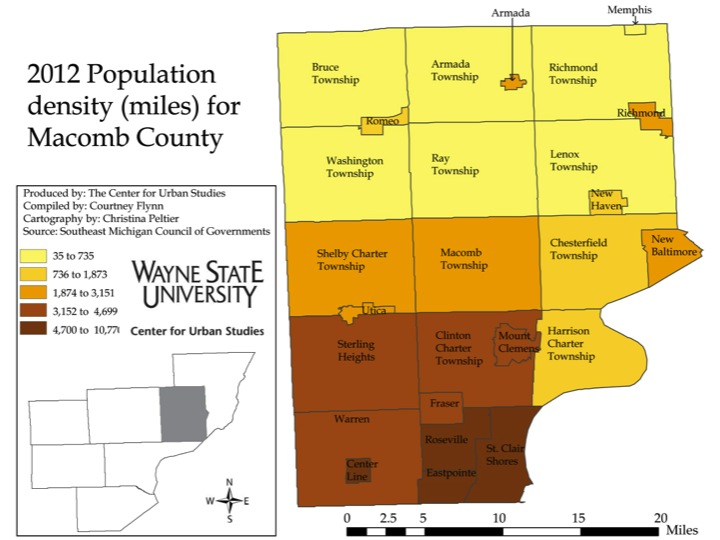
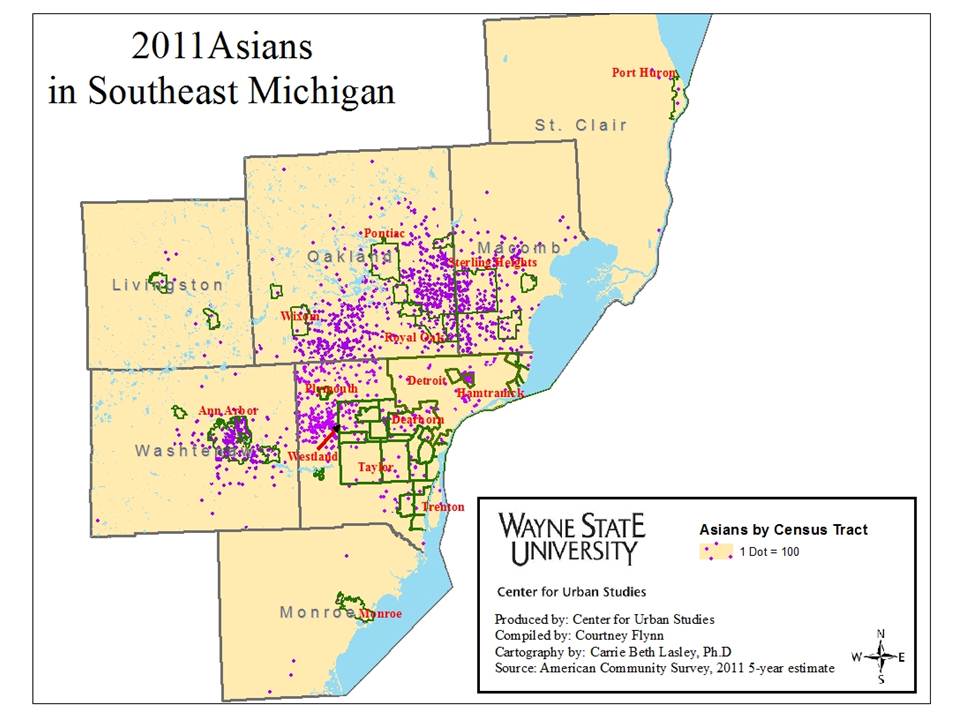
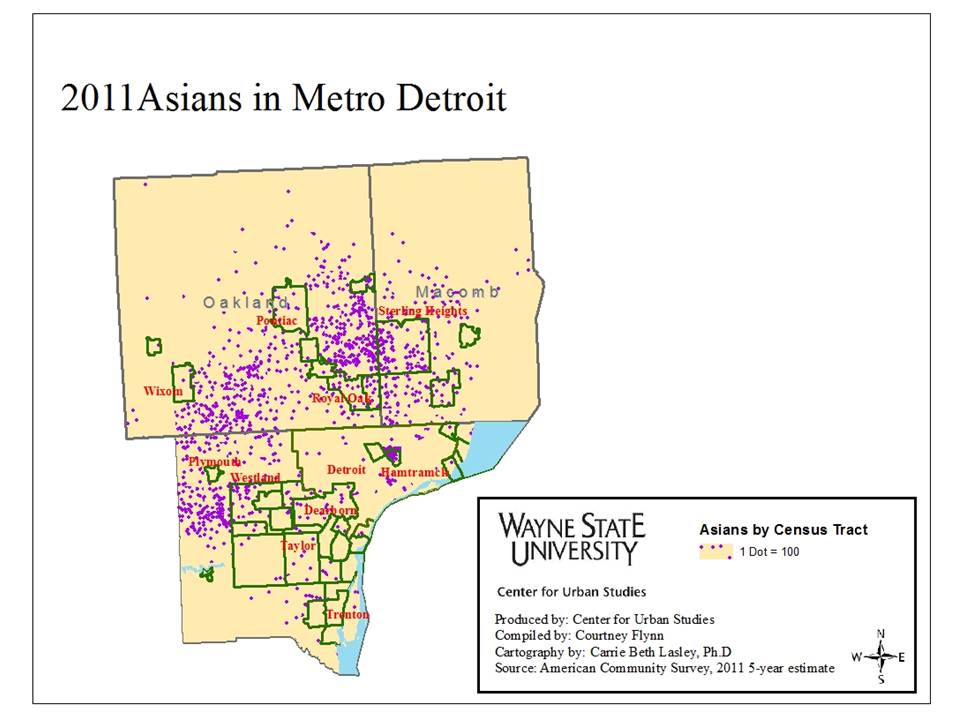
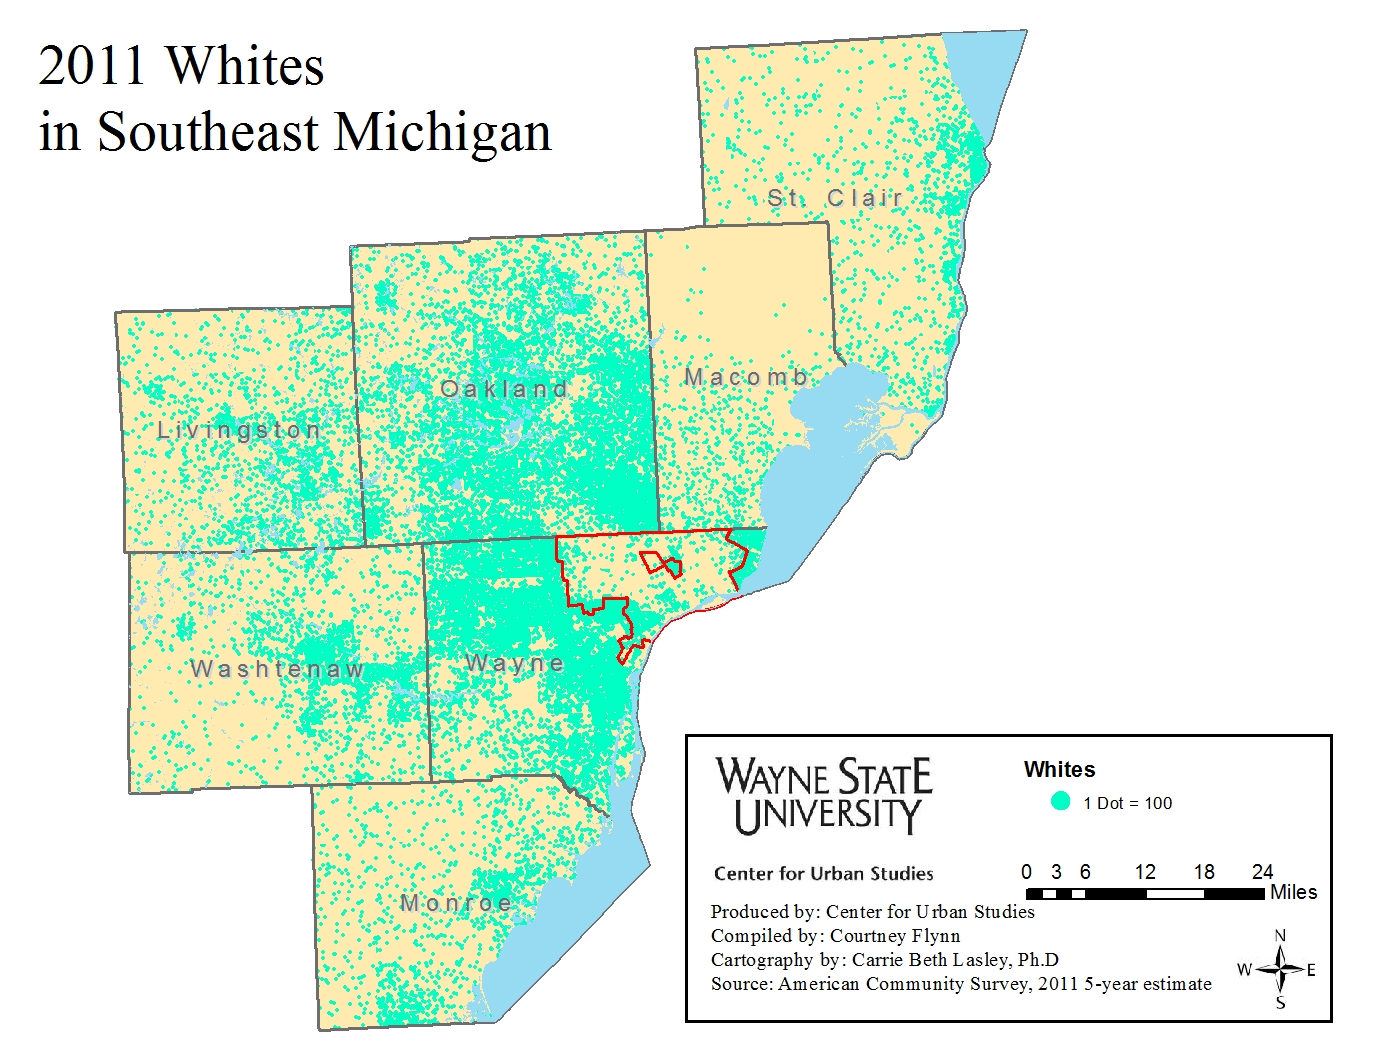
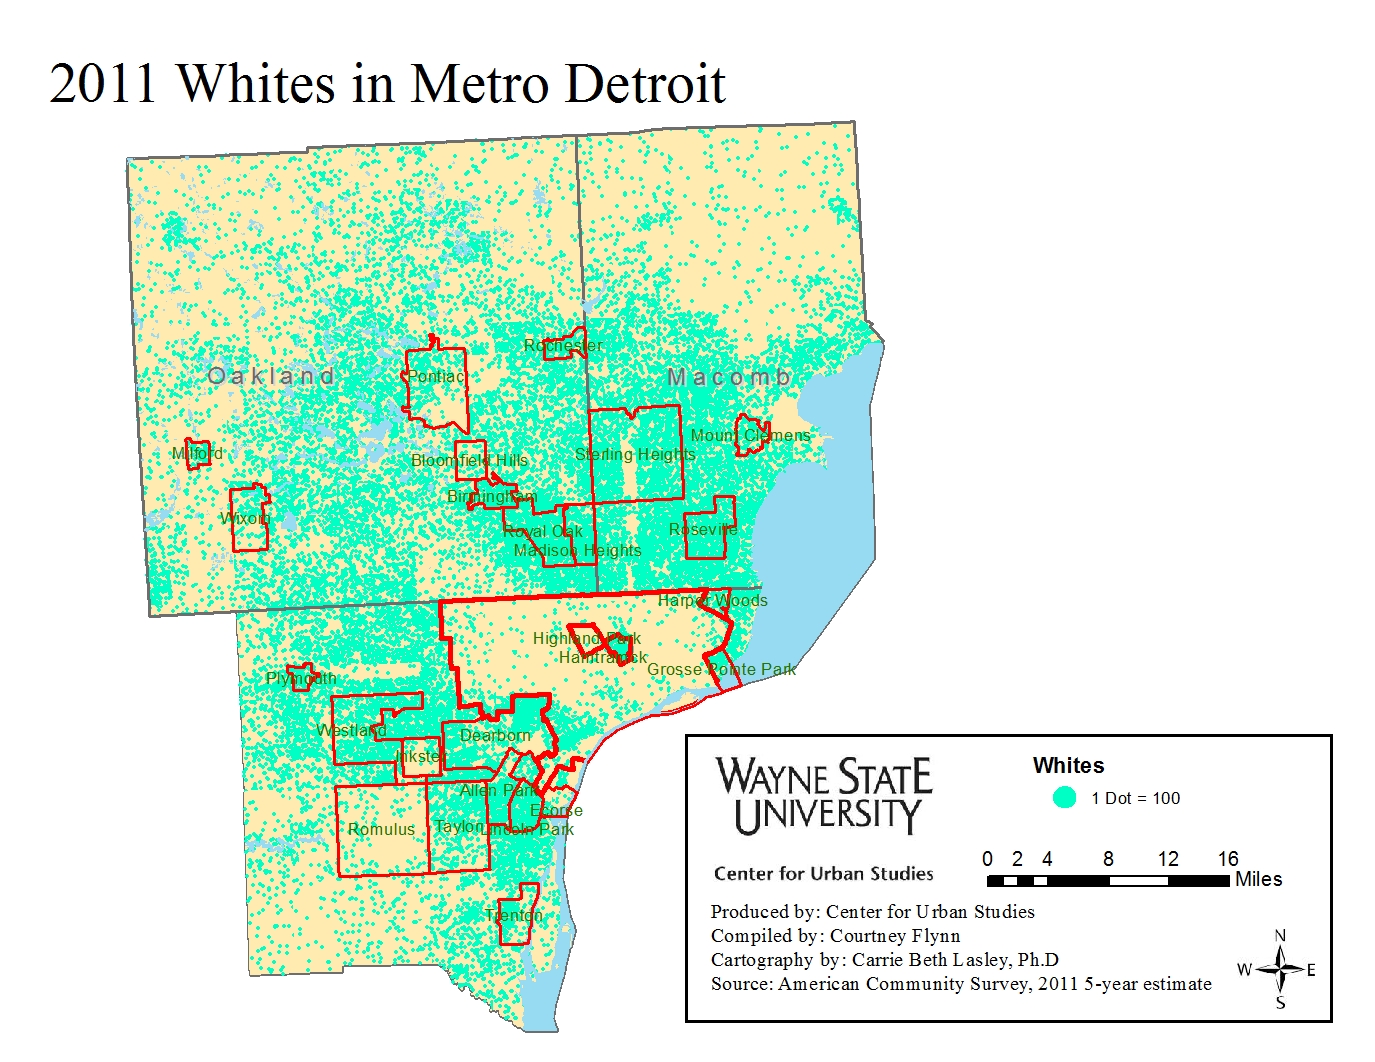
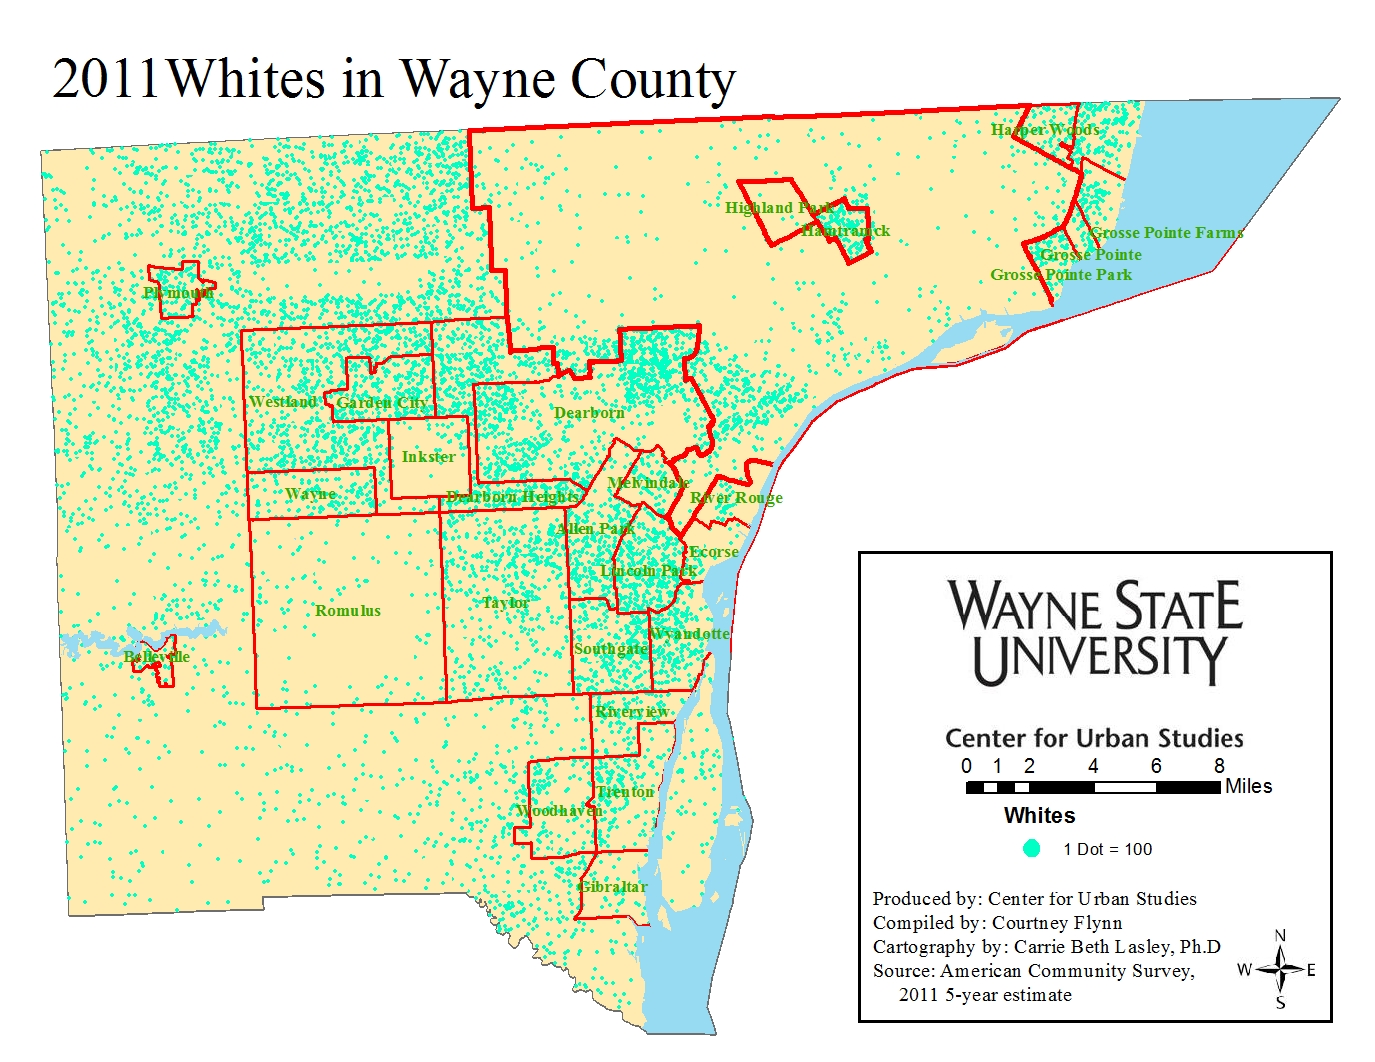
When looking beyond the City of Detroit, the percent is much lower. For example, nearly all of Livingston, St. Clair, Monroe and Macomb counties are made up of 0-20 percent minorities. When looking at the dot map depicting where Asians live, it is clear that there are heavy concentrations in the Ann Arbor, Plymouth, Westland, Sterling Heights and Royal Oak. The dot maps that depict the White population show high concentrations just outside of the City of Detroit, in the Grosse Pointes, Lincoln Park and throughout Oakland County.

In next week’s post we will examine the distribution and concentration of various ethnic groups in the region, particularly Hispanics and Arabs.

Detroit isn’t the only Metro area municipality facing high fiscal stress

Below are eight different maps that describe the fiscal situation of each municipality in Southeast Michigan. These scores were obtained through Munetrix, and are based on a scoring methodology that was originally developed in 1992 by the Michigan Department of Treasury and Michigan State University. Since then, the methodology has been updated and the score is now based on an algorithm focused around population, debt, taxable value, general fund expenditures, fund balances, and the health of current and past operating budgets.

According to Munetrix (LINK), “The system is digital in nature, a pass-fail with ten categories. If a community ‘passes’ a given metric, or beats the trigger, they score a zero in that metric. If they fail, they are assigned a one.  Add up the ones in all 10 categories and that is the fiscal score for that unit of government.”

Each community is given a score on a 0-10 scale. A zero, which is associated with the darkest shade of green in the maps below, means the community is in a healthy financial state, while a 10 means the municipality has challenges in all 10 fiscal categories considered.

No community in the seven county region was given a 10 as its fiscal indicator score. The City of Detroit received an 8, which was the highest score given in this region.

Please note that each municipality’s fiscal score for 2012 is represented unless specified otherwise.

Image

Image

Image

Image

Image

Image

Image

Image

Below are eight different maps that describe the fiscal situation of each municipality in Southeast Michigan. These scores were obtained through Munetrix, and are based on a scoring methodology that was originally developed in 1992 by the Michigan Department of Treasury and Michigan State University. Since then, the methodology has been updated and the score is now based on an algorithm focused around population, debt, taxable value, general fund expenditures, fund balances, and the health of current and past operating budgets.

According to Munetrix, “The system is digital in nature, a pass-fail with ten categories. If a community ‘passes’ a given metric, or beats the trigger, they score a zero in that metric. If they fail, they are assigned a one.  Add up the ones in all 10 categories and that is the fiscal score for that unit of government.”

Each community is given a score on a 0-10 scale. A zero, which is associated with the darkest shade of green in the maps below, means the community is in a healthy financial state, while a 10 means the municipality has challenges in all 10 fiscal categories considered.

No community in the seven county region was given a 10 as its fiscal indicator score. The City of Detroit received an 8, which was the highest score given in this region.

Please note that each municipality’s


Outlying counties in Southeast Michigan have lower population density

In a previous post, we examined the population densities in Wayne, Oakland, and Macomb counties. This post examines the population densities for the outlying counties in Southeast Michigan: Livingston, Monroe, St. Clair and Washtenaw.

As can be seen in the map below, the population densities in four outlying counties are much lower than those in Wayne, Macomb and Oakland counties.

The data used for these maps came from the Southeast Michigan Council of Governments (SEMCOG) December 2012 population estimates, which are the most recent available.  To calculate the population density, each municipality’s  population was divided by  its square mileage.

Slide3


Slide4


Slide5


Slide6


Slide7


There are no municipalities in the outlying counties in Southeast with a population density categorized in the highest bracket (4,700 to 10,770 residents per square mile) and only three municipalities  in the second highest bracket (3,152 to 4,699 residents per square mile): Port Huron in St. Clair County and Ann Arbor and Ypsilanti in Washtenaw County. Ypsilanti has the highest population density of all the communities presented in this post with 4,296 residents per square mile. In contrast, neither Livingston nor Monroe have any municipalities  with a population density above 3,151 residents per square mile(the maximum density for the middle bracket).


The Boston Consulting Group presents optimistic reports for U.S. manufacturing

In two recent studies produced by The Boston Consulting Group it has been found that the U.S. economy is experiencing an upswing in the export manufacturing industry and with this manufacturing upswing between 2.5 and 5 million jobs could be created in the U.S. by the end of the decade. “The U.S. Skills Gap: Could it Threaten a Manufacturing Renaissance” report examines the whether or not there really is a gap of skilled employees in the manufacturing industry and The U.S. as one of the Developed World’s Lowest-Cost Manufacturers” examines what the future for the U.S. economy will look like in terms of manufacturing exports.


Detroit and surrounding communities have highest population density

In this post we will examine the population density for the Southeast Michigan region as a whole, as well as the population density of each municipality within each county in the region. The first map shows the population density of the entire region by county, is presented in a different color because the data represents a larger region.

Population density is described as a measurement of population per area or unit volume; for this post population density is examined per square mile.

Overall, according to the maps below, Wayne County, as a whole, has the highest population density of the counties being examined. It can also be seen that the City of Detroit and the surrounding communities  have the highest population density; not all the surrounding communities are in Wayne County.

The data used for these maps came from the Southeast Michigan Council of Governments (SEMCOG) December 2012 population estimates. We use the SEMCOG estimates for 2012 because they are the most recent available.  That data was then divided by each municipality’s square mileage to determine the population density per square mile.

Slide3

Slide4


Slide5


Slide6


Of the three counties represented above, Oakland County has the highest number of municipalities with a population density ranging from 4,700 to 10,770 (this is the highest category, displayed in dark brown), although all of these are relatively small. These municipalities are: Berkeley (5,840), Clawson (5,840), Ferndale (5,073), Hazel Park (5,882), Keego Harbor (7,657), Oak Park (5,618) and Royal Oak (4,976). Ferndale, Oak Park and Hazel Park, all directly border Detroit, which is the largest municipality in the seven county region. However, even though Detroit is the largest municipality in the region, it does not have the highest population density; the population density for Detroit is 4,792. This still puts the city in the largest population density category, but Lincoln Park, which borders Detroit, has the highest population density in the county, it has been recorded at 6,513. The population density for Dearborn Heights, which also borders Detroit and is in the highest category, is recorded at 4,929; Wyandotte has a population density of 3,632. In Macomb County, with the exception of Center Line and Roseville, the municipalities with the highest population density also border Detroit. These municipalities are St. Clair Shores (4,186) and Eastpointe, (6,406). The population density for Roseville has been recorded at 4,793 and for Center Line it is recorded at 4,913.


In next week’s post we will examine the population density for the remainder of the Southeast Michigan region. The post will focus on Livingston, Monroe, St. Clair and Washtenaw counties. All of these counties have much lower population density levels than the three counties we examined this week.