Inner-Ring Detroit Suburbs Have Highest Vacancy Rates in 2019

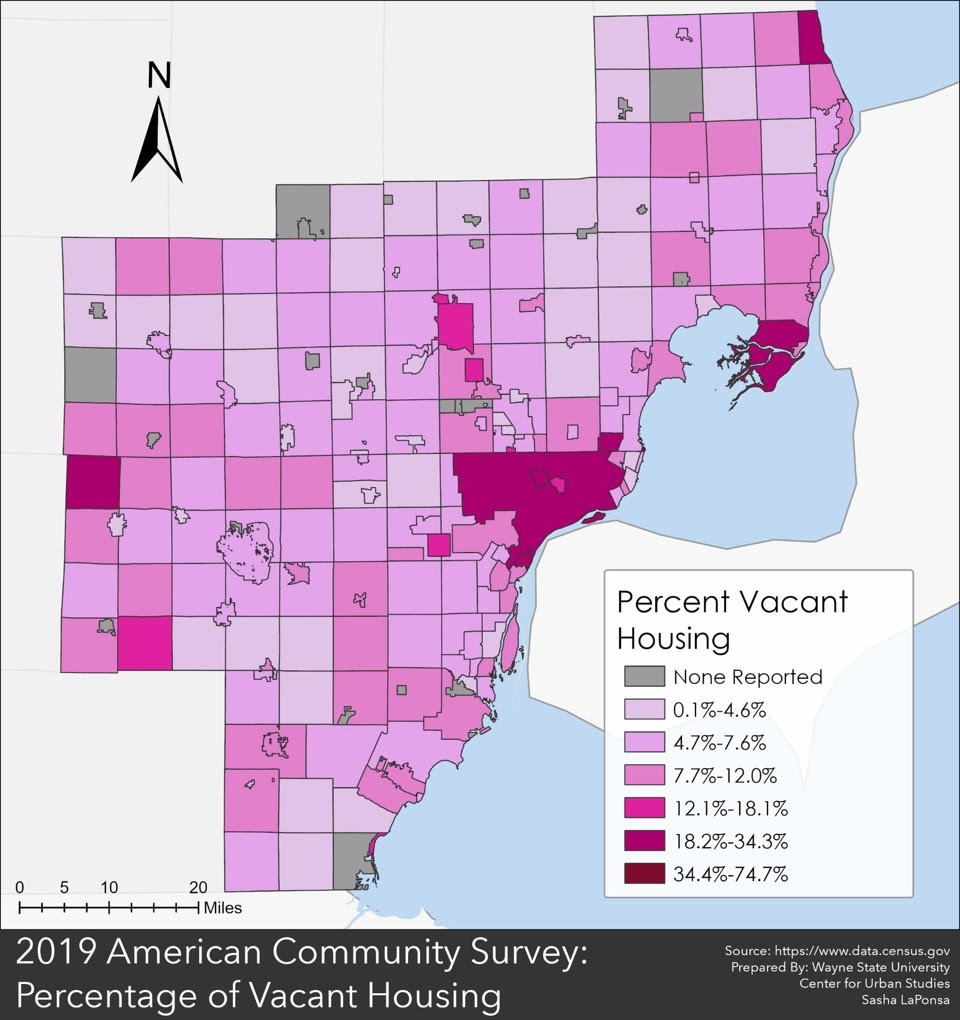
In 2019, Highland Park had the highest vacancy rate in Southeastern Michigan at 34 percent, according to the American Community Survey; the vacancy rate is the percentage of all available units in a rental property, such as a hotel or apartment complex, that are vacant or unoccupied. Clay Township (St. Clair County) had the second highest vacancy rate at 30 percent and Detroit had the third highest rate at 27percent. There were only seven communities in the region with vacancy rates at or above 20 percent; of those communities four were Detroit or an inner-ring suburb (Highland Park, River Rouge and Eastpointe) and the remaining three were outer-ring suburbs (Clay, Burtchville and Lyndon townships). While there were a handful of outer-ring suburbs with high vacancy rates, those with the lowest vacancy rates were all outer-ring suburbs. Orchard Lake Village had the lowest vacancy rate in 2019 at 1.4 percent, followed by Clarkston at 1.6 percent and Plymouth and Augusta townships at 1.8 percent. The inner-ring suburb with the lowest vacancy rate was Southfield Township at 4.1 percent, followed by Allen Park at 4.9 percent. 

In knowing that the Detroit inner-ring suburbs had among the highest vacancy rates in the region, it is not surprising that Wayne County had the highest vacancy rate at the county-level at 15.5 percent. However, St. Clair County had the second highest vacancy rate at 12 percent; St. Clair County is home to the community with the highest vacancy rate (Clay Township). When breaking down the type of vacancies that makeup each county’s overall percentage though Wayne County did not rank the highest amongst any of the categories. The breakdown of vacancy types-housings units for sale, housings units for rent and “other” (described below)-is only available at the county level. So, while we cannot fully understand the specifics of vacancy rates at the municipal level, the county data does give us some insight.

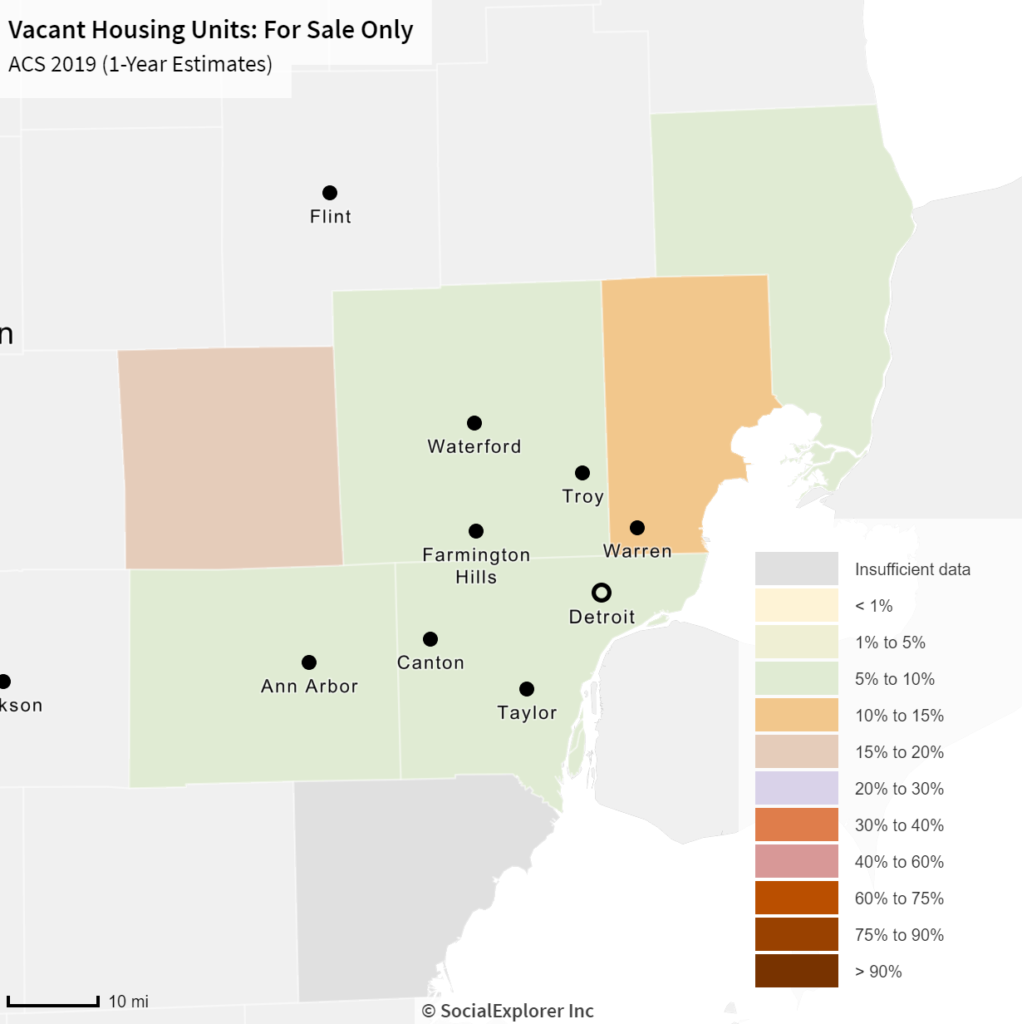
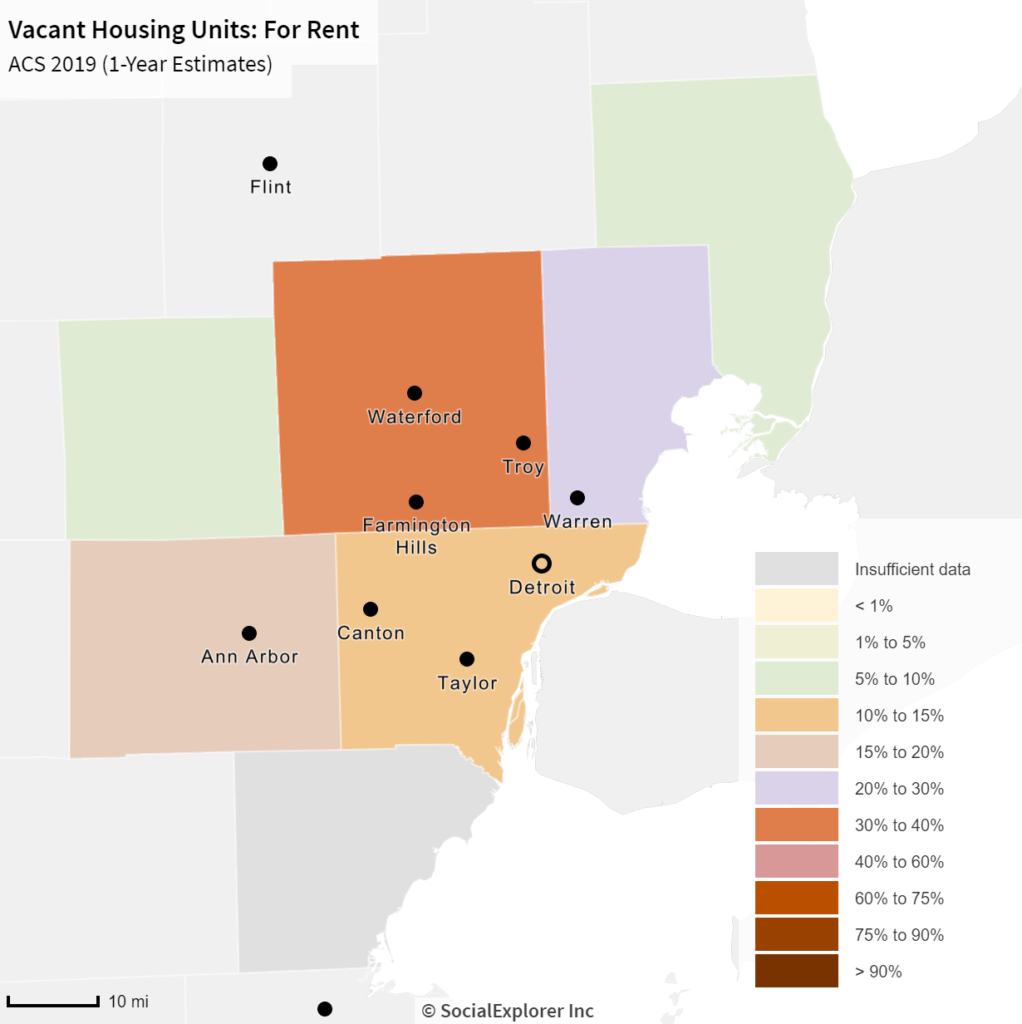
According to the data, Livingston County had the highest percentage of vacant homes for sale at 18 percent, followed by Macomb County at 14 percent and then Wayne County at 10 percent. For rental vacancies, Oakland County had the highest percentage at 31 percent and Macomb County at 26 percent; Wayne County had an 11 percent vacancy rate for rentals. Overall we see that rental units tend to have higher vacancy rates than homes for sale; the rental vacancy rate may grow even higher in areas such as Detroit where demand for rentals is down just as new apartment buildings are opening, according to the Detroit Free Press.

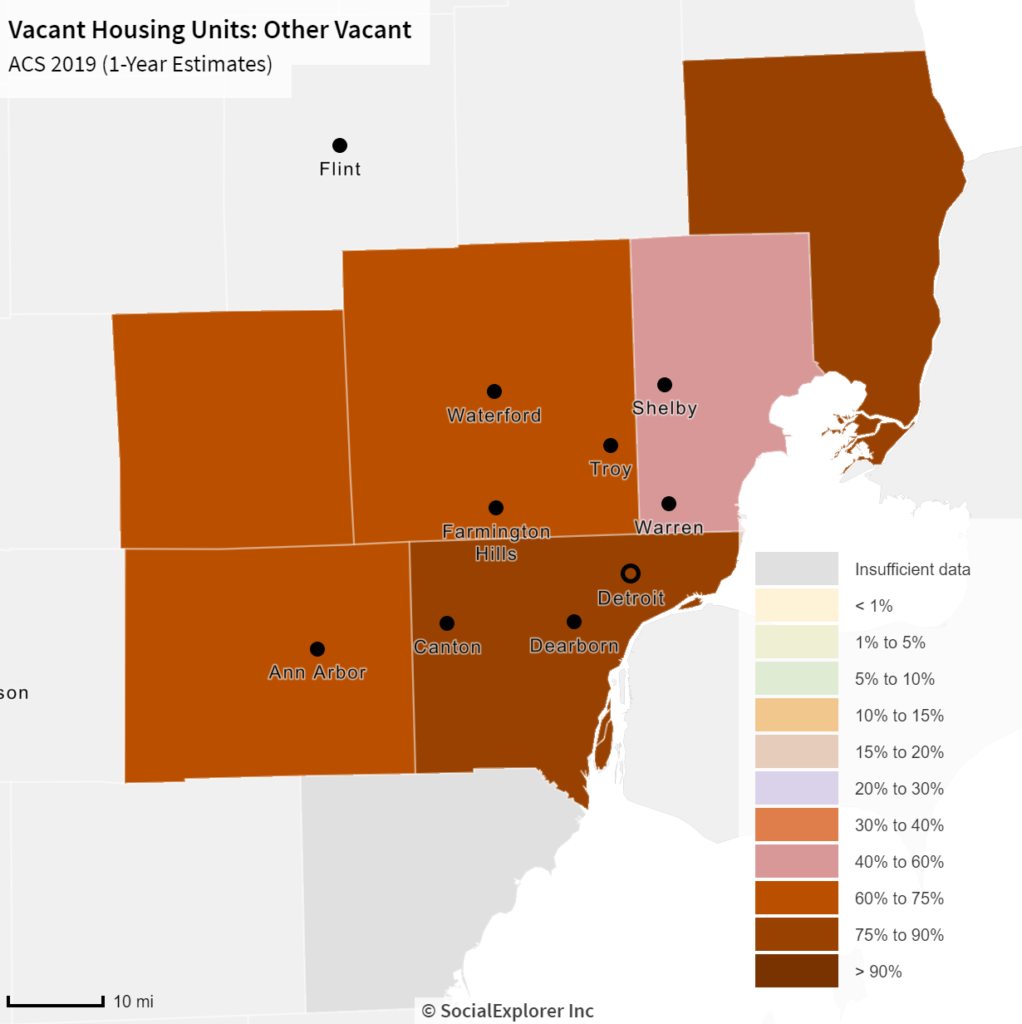
A property is labeled as “other” vacant by the U.S. Census Bureau when it does not fit into one of the categories discussed above. According to the U.S. Census Bureau “other” properties are typically vacant because the owner does not want to rent or sell it; it is being used for storage; the elderly homeowners are living in a nursing home; it’s in an estate settlement; it is being repaired or renovated or it is in foreclosure. According to the data at the County level, St. Clair County had the highest percentage of “other” vacant properties (as described above) at 88 percent, followed by Wayne County at 79 percent. Macomb County had the lowest percentage at 60 percent. This data was only available at the county level.

While the breakdown of vacancy rates is only available at the County level it does shed some light on why certain communities may have some of the highest vacancy rates. For example, we know that communities such as Highland Park and Detroit have higher vacancy rates due houses being abandoned and people leaving those cities for outer-ring suburbs. Furthermore, according to Next Gen City, the highest vacancy rates are in areas that have the highest population of black residents; Detroit and Highland Park have the highest black populations in the State of Michigan. As the COVID-19 pandemic continues to affect the economy it will interesting to see how vacancy rates change in the future.

Marriage Rates Declining in Southeastern Michigan

The day of love just passed, and data shows the tradition of marriage may be becoming a thing of the past too. According to the 2019 American Community Survey fewer people were married in 2019 in Southeastern Michigan than in 2010. 

As shown in the first map below, compared to the second map, each of the seven counties in the region had a lower percentage of married individuals in 2019, with Wayne County having the lowest percentage of married individuals. In Wayne County, 39 percent of the population was married in 2010, and by 2019 that percentage had dropped to 36 percent.  Livingston County had the highest percentage of married individuals. In 2019 61 percent of the population in Livingston County was married, and in 2010 64 percent of the county was married. Monroe County experienced the largest decline between 2010 and 2019; in 2010 58 percent of the population was married, and in 2019 that decreased to 53 percent.

Declining marriage rates have been a trend for nearly two decades now, and this is likely due to economic and social trends. According to the Brookings Institute, as marriage rates decline, non-marital births, cohabitation and single parenthood have all been increasing. Furthermore, education and income levels also play a role in current marriage trends. For example, those with at least a bachelor’s degree are more likely to get married than those without such a degree, according to the Brookings Institute. Additionally, marriage rates are declining the most in the middle class. Potential reasons for such declines include economic instability for both men and women, wage inequalities and the concern over the cost of children.

In addition to the percentage of people getting married declining, so is the percentage of married individuals with children. Between 2010 and 2019 each county in Southeastern Michigan experienced a decline in the percentage of married couples with children under the age of 18 in the house. In both 2010 and 2019 Livingston County had the highest percentage of married individuals with a child; in 2010 that percentage was 30 percent, and in 2019 that percentage was 24 percent. Wayne County had the lowest percentage of married individuals in 2010 and 2019 at 18 percent and 15 percent, respectively. Monroe County experienced the largest decline of individuals married with children; in 2010 25 percent of individuals were married with at least one child under the age of 18, and by 2019 that declined 15 percent.

Overall, the data shows that we as a society are moving away from the traditional idea of love, marriage and a baby. As mindsets have shifted, so have economic conditions. What is in store for the tradition of marriage and a family remains unknown post-pandemic. 

Black Population in Southeastern Michigan has Lowest Life Expectancy

Life expectancy is a key metric in measuring public health and the chart below shows the life expectancy for everyone and then the white, black and Hispanic populations by race in Southeastern Michigan in 2019. The blue column shows what the average life expectancy was for all races in Southeastern Michigan, with Washtenaw County having the highest overall life expectancy at 84 years of age and Wayne County having the lowest at 75 years of age. The life expectancy for those in Michigan is 78 years of age.

When comparing life expectancy at the racial level in Southeastern Michigan we see that the black population had the lowest life expectancy across all counties while the Hispanic population typically had a higher life expectancy. Furthermore, Washtenaw County had the highest life expectancy for all of the populations examined, with the exception of the black population. In Washtenaw County, the life expectancy for the Hispanic population was 86; it was 76 for the black population and 82 for the white population.

Wayne County had the lowest life expectancy across all populations examined. In Wayne County, the life expectancy for the Hispanic population was 80, it was 72 for the black population and 77 for the white population.

For Livingston County, data was not available for the black population. Oakland County had the highest life expectancy for the black population at 77. This data is from the Centers for Disease Control 2019 Health Survey.

This data further highlights facts we all know; race and ethnicity do impact one’s life expectancy, as does where an individual lives, their education levels, income and genetic pre-dispositions. Of course, race often plays a factor into these factors as well. As we continue to explore health disparities it is vital to understand how underlying factors play a role in them and for us to determine how to create further equity in those too.

Such policies are certainly a tangled web, but their impacts are vast and have a direct impact on an individual’s life. Looking at the impact COVID-19 had on the black population in Michigan is an example of this. In April of 2020, it was found that 40 percent of COVID deaths at the time occurred in the black population, despite it only making up 14 percent of the State’s population. This staggering discovery brought on the creation of a statewide task force to investigate and address the disparity. According to the report the task force released in December, increased and strategic testing, primary care provider and telehealth access, public health campaigns and improved data quality on cases and deaths helped decrease the number of cases per capita in the black population. The number of cases between March and February dropped from 176 cases per million people per day to 44 cases per million people per day, according to the Michigan Department of Health and Human Services. This decrease is a target result of targeted investigation, analysis and policy implementations. Now it is time to further the scope of such targeted efforts.

Affordable Care Act Making an Impact in Southeastern Michigan

The Affordable Care Act was signed into legislation nearly 11 years ago (March, 2010) and while it has faced hurdles and scrutiny from the public and the public policy world, data shows it has expanded healthcare coverage to Americans. As we continue to battle the COVID-19 pandemic, access to healthcare arguably grows more and more important.

As shown in the first graph below, Wayne County had the highest percentage of individuals without health insurance in 2019 at 6.8, according to the U.S. Census Bureau. Washtenaw County had the lowest percentage at 3.7 percent. The second graph shows that Wayne County, despite continuously having the highest percentage of uninsured individuals, experienced the greatest decline in the percentage of those without insurance between 2010 and 2019 at 8.8 percentage points. In 2010 15.6 percent of the Wayne County population did not have health insurance, and by 2019 that decreased to 6.8 percent.

Overall, all seven counties in Southeastern Michigan experienced a decline in the percentage of individuals without insurance. It should be noted that it was 2014 when the marketplace for health insurance opened, and Medicaid eligibility was expanded. In this time frame Wayne County had the largest decrease in the percentage of individuals uninsured at 7.1 percent, followed by St. Clair County at 6.3. percent. While access to the marketplace has certainly helped in providing individuals with access to health insurance, the expansion of Medicaid has been key, particularly for lower income individuals.

While the percentage of individuals without health insurance remains concerning, we must also be aware of how those with health insurance obtain it. In Southeastern Michigan, majority of the population obtained health insurance from their employers in 2019. In Livingston County, 59.3 percent of the population had employer-based health insurance, which was the highest percentage in the region.  Conversely, Livingston County had lowest percentage of individuals with public health insurance at 10.9 percent (Medicaid or Medicare). Additionally, 6.8 percent of the population in Livingston County purchased their insurance directly in 2019.

In Wayne County, 29.2 percent of the population utilized public health insurance, while 41.6 percent of the population received health insurance from an employer and 3.3 percent purchased it directly (6.8 percent of the Wayne County population was uninsured, bringing the total to 100 percent). Wayne County had the lowest percentage of individuals with employer provided health insurance and direct purchase health insurance but the highest percentage of individuals with public health insurance. Additionally, Wayne County had the highest percentage of individuals without health insurance. This sheds light on the fact that many individuals working in Wayne County have jobs where health insurance is not offered or affordable and may not have the means or access to obtain it through other outlets.

Overall, the data shows that the Affordable Care Act has had an impact on individuals in Southeastern Michigan, with fewer individuals going without health insurance. There is still room for improvement though in ensuring the uninsured gap is filled.