Michigan’s Total Solid Waste Production Declines, Amount Imported from Other States Increases

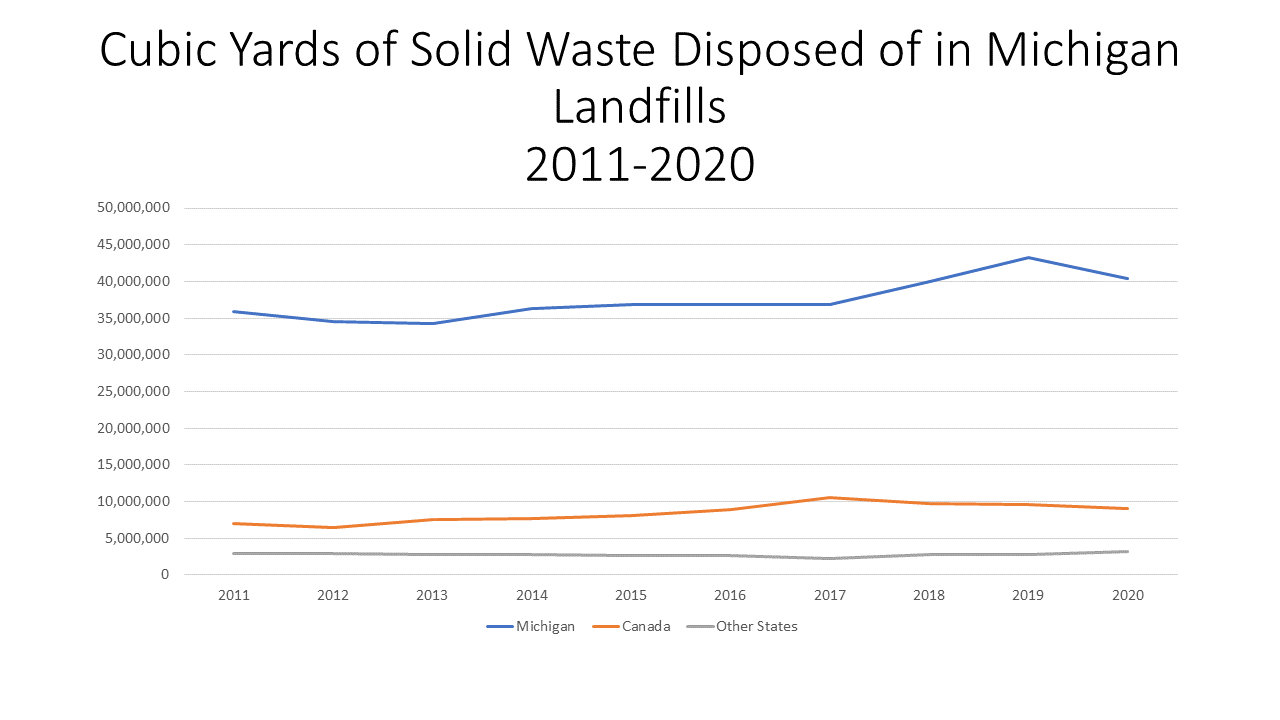
In Michigan, the total amount of solid waste disposed in the state decreased between fiscal year 2019 and 2020, as did the total amount of solid waste imported into Michigan. However, while the total amount of waste disposed of in Michigan decreased, the amount of waste disposed of in Michigan from other states increased.

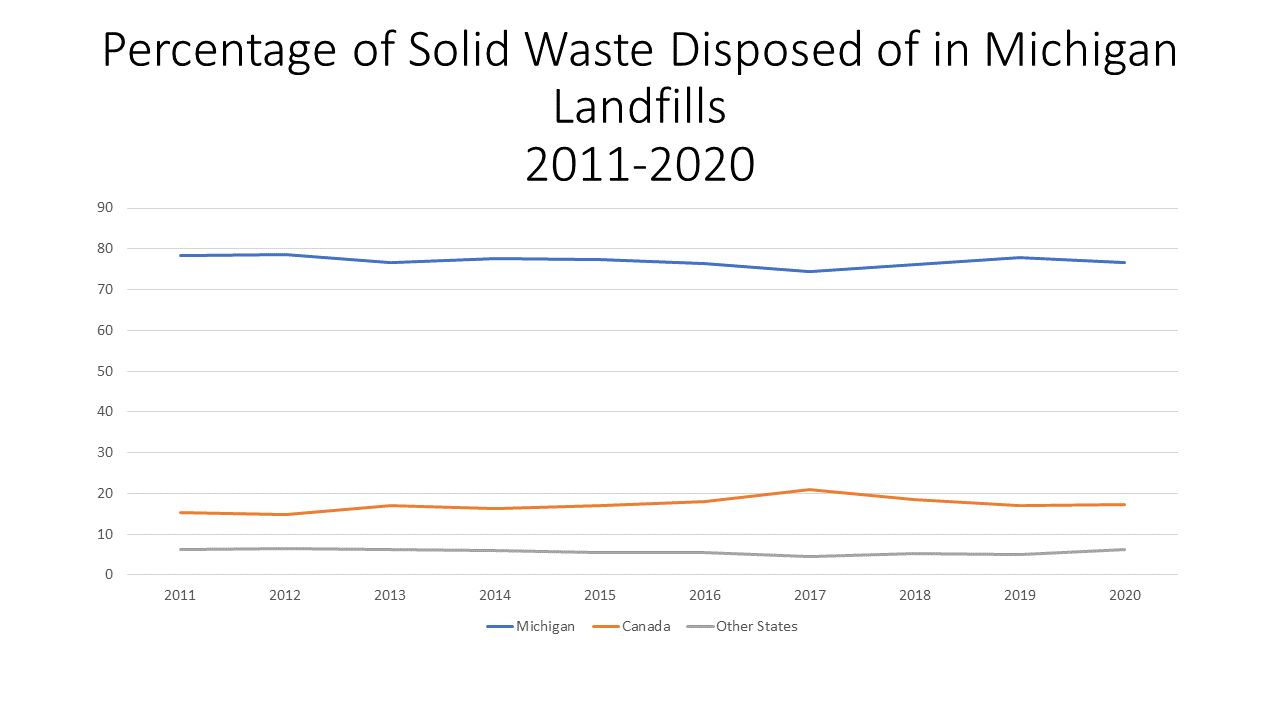
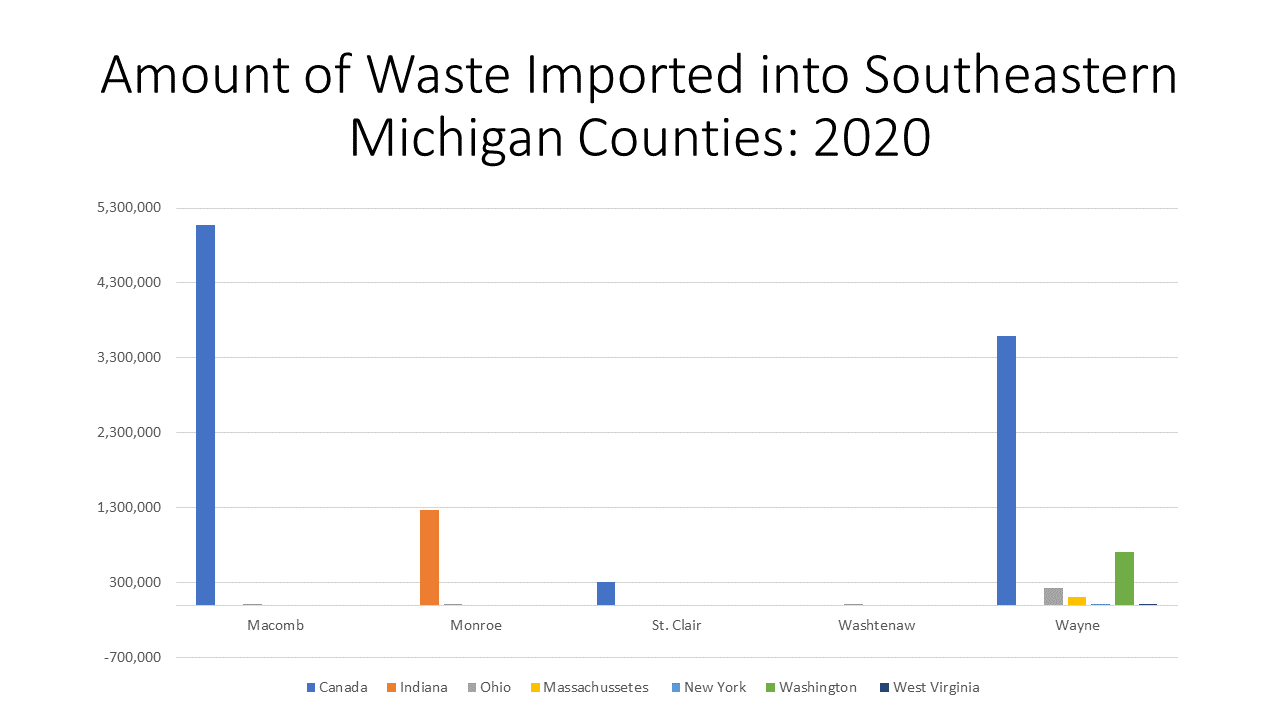
The total amount of solid waste disposed in Michigan in 2020 decreased by about 3 million cubic yards, or about 5.4 percent from the previous fiscal year (2019). The amount of solid waste generated in Michigan decreased from about 43.3 million cubic yards in fiscal year 2019 to about 40.4 million cubic yards, a decrease of about 6.8 percent. Overall, the total amount of imported waste into Michigan landfills decreased from 12,380,141 cubic yards in 2020 to 12,310,608 cubic yards in 2019, a decrease of about 0.6 percent. The largest source of waste imported to Michigan continues to be from Canada, with a total of about 9.1 million cubic yards, down 480,274 cubic yards reported for fiscal year. Overall, the amount of solid waste Canada imported to Michigan in 2020 was about 17.2 percent of all waste disposed in Michigan landfills, while Michigan created about 77 percent of the waste. Other states also contributed to the total amount of solid waste in Michigan, with waste from other states brought to Michigan making up 6 percent of Michigan’s total waste. As noted, while the total amount of waste disposed of in Michigan decreased, the amount imported from other states increased from 5 to 6 percent. So, while the total amount of waste disposed of in Michigan declined, due to a decline in the waste generated in Michigan and imported from Canada, the amount of waste being brought to Michigan from other states has increased.

The data discussed above is shown in the Chart 1 and Chart 2 below and has been provided from the Michigan Department of Environment, Great Lakes, and Energy.

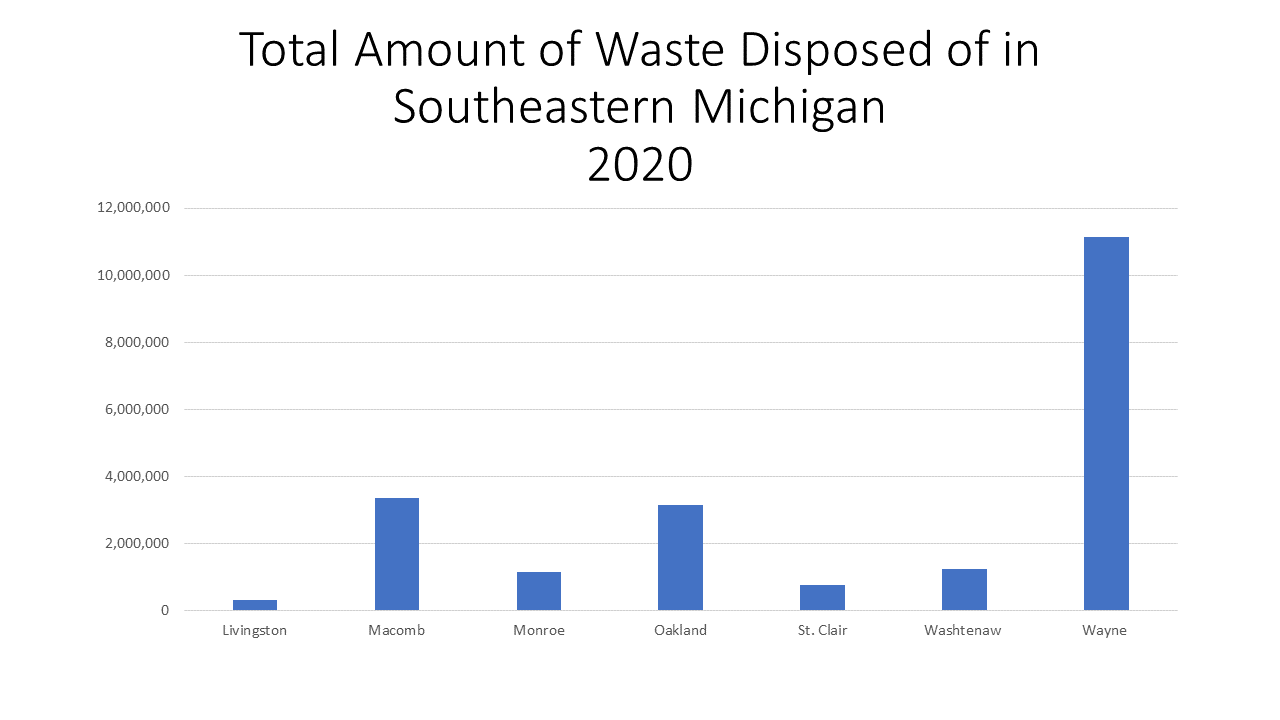
As noted, Michigan creates, and disposes of most of the waste in Michigan. Below we see how much waste was disposed of in each county in Southeastern Michigan. The chart below does not reflect the amount of waste created in each county, but rather disposed of, meaning waste from other counties, Canada and other states are included in the numbers below.

Wayne County had the highest amount of waste disposal at more than 11.1 million cubic yards in 2020. This was more than twice the amount of any other county in the region. Macomb County had the second highest amount of waste disposed in 2020 at about 3.3 million cubic yards. Livingston County had the lowest amount of waste disposed at about 330,000 cubic yards.

Wayne County not only had the highest amount of waste disposed of in it in 2020, it also had the highest number of importers. In 2020, there were six different places that imported waste into Wayne County. Canada imported the highest amount at about 3.6 million cubic yards, followed by Washington state and then Ohio. Of the counties in the region with imported waste, St. Clair County had the lowest amount of waste imported at about 305,000 cubic yards.

Overall, it is encouraging to see the total amount of waste being disposed of in Michigan has decreased, but it remains a concern that the State continues to allow outside states and countries to import their waste. This is especially concerning as the amount of waste being imported to Michigan from other states has been increasing, despite the total amount of waste being disposed of in Michigan is decreasing.

One of the many ways to combat climate change is to decrease the amount of waste we, as a society, produce. Ways to achieve this include reusing items, recycling and being mindful in our purchases and consumption.

Maternal Deaths and the Impact of Being Uninsured

Maternal deaths remain a concern, especially with Michigan’s maternal mortality rate at 16.4 per 100,000 live births in 2018, according to the National Center for Health Statistics, and the United States rate at 17.4 per 100,000 live births. As described in the Surgo Venture Maternal Vulnerability Index (MVI), there are many factors that contribute to maternal mortality rates including, but not limited to, accessibility, affordability and utilization of healthcare.

Health insurance plays an important role in a woman’s pregnancy, allowing for both the mother and unborn child to receive necessary care to ensure each individual remains healthy through regular checkups and addressing any issues that may be identified during the pregnancy.

Wayne County has the highest percentage of women of childbearing age (19-44) who were uninsured at 7.8 percent, followed by Macomb County where 7.5 percent of women of childbearing age are uninsured. In Wayne County 203 of the 610 Census Tracts have 10 percent or more of women of childbearing age without health insurance and in Macomb County that number is 57 of the 217 Census Tracts. As the second map below shows, the Census Tracts with the highest percentage of women of childbearing age without health insurance are in Wayne County, with additional pockets in Macomb and Monroe counties, where more than 16  percent of women of childbearing age in a Census Tract are without health insurance.

Washtenaw County has the lowest percentage of women of childbearing age without health insurance at 4.6 percent.

As noted, this data set plays a role in determining where a county or state falls in the General Healthcare Sub-Index of the MVI, which is one of six sub-categories that explores the factors that impact maternal mortality rates and maternal health in general. In Southeastern Michigan, St. Clair County has the highest vulnerability index at 45 while Washtenaw County has an index of 0, meaning there is ease in access to and affordability of healthcare for reproductive age women. Michigan has a General Healthcare Sub-Index of 29.

The fact that Washtenaw County has the lowest percentage of women of childbearing age without health insurance explains, in part, why it also has the lowest General Healthcare Sub-Index of the MVI. However, St. Clair County has the highest General Healthcare Sub-Index of the MVI in Southeastern Michigan but has the fourth lowest percentage of women of childbearing age without health insurance in the region (5.1 percent).

So, while access to and utilization of healthcare is a vital aspect in keeping maternal deaths low, it certainly is not the only factor. Other factors include mental health, substance use, socioeconomic status, education levels and more. We will further dig into these factors to see what factors impact the areas of Southeastern Michigan the most.

Climate Change in Detroit and What Can Be Done

Climate change became real for Detroiters this year when 30,000 found their homes flooded, some to the top of their first floor, some to the top of their basements. This was the second major flood in the last decade, with another in 2014 leaving behind a huge amount of damage as well. The mechanism behind the floods is clear: air temperatures have risen with climate change, hotter air holds more water, and storms produce heavier rainstorms that are slower to move on, meaning greater accumulations of rain.

It’s not that climate change was not already real, in Detroit and beyond, prior to this summer though. Temperatures have already risen 2.5 degrees in Michigan, summers are hotter, and heatwaves are stronger and last longer. Our urban area is a heat island in the summer, and it will only get worse as temperatures rise further.

So, what can be done? A lot.

In this post we introduce our 10 top policy proposals to overcome climate change in Detroit. Each month a detailed post on one the initiatives listed below will be posted. These posts will dive deep into each recommendation, exploring how the recommendations can impact climate change and help Detroit. The posts will also discuss the potential financial and political issues related to each proposal and provide recommendations on how to overcome them.

But before we dive deep, let us first lay out what our recommendations are.

Top 10 Climate Change Proposal/Policy Recommendations for Detroit

  1. Creating a program that strengthens rooftop solar opportunities in residential and commercial buildings;
  2. Creating a community solar program;
  3. Utilizing the space at the Detroit City Airport to develop a solar field;
  4. Planting more trees along medians and on some vacant land;
  5. Prioritizing weatherization efforts;
  6. Offering and supporting heat pumps for heating and cooling;
  7. Electrifying the bus system;
  8. Further investing in green infrastructure to help overcome flooding;
  9. Developing more robust urban gardening opportunities;
  10. Finding ways to further encourage and support working from home.

We can all take action to reduce our carbon footprint, the amount of waste we create and other ways in which we accelerate climate change. But, in addition to each individual’s responsibility to become a better steward of the environment, responsibility lies on each layer of government and corporate industries to also take action through policy changes, and operation changes. The proposals above will address all such facets.

Before diving into our proposals, we must also briefly touch on what is being done in Michigan and Detroit to address climate change.

In Michigan, the State committed to becoming carbon-neutral by the year 2050. The State also committed to reducing its greenhouse gas emissions by 2025 by 28 percent below its 1990 levels. Items that contribute to greenhouse gas emissions include the use of vehicles, the use of energy, the industrial and agricultural sectors and the creation of garbage.

According to US Energy Administration, Michigan is taking steps in reducing its reliance on coal, which is certainly a contributor to climate change. In 2020, natural gas generated the largest amount of Michigan’s electricity for the first time, surpassing coal, which fell to third after nuclear power. Natural gas accounted for 33 percent of the State’s net generation, while coal’s share declined to 27 percent. Renewable energy only contributed about 11 percent of Michigan’s net electricity generation in 2020, and wind energy accounted for three-fifths of that power. Michigan ranks among the top 15 states in wind-powered electricity generation.

Policy changes are certainly shaping Michigan’s future, and Detroit is also aiming to take action. In 2019, the City of Detroit released it Sustainability Action Agenda, which includes goals such as increasing air quality, reducing pollution and greenhouse gas emissions, transforming vacant lots into safe and sustainable places and more. Just as that document seeks to complement other City, State and national efforts to shift our climate change, so do the recommendations we have for the City of Detroit.

Detroit is not exempt from climate change, and the effects will only continue to intensify. Extreme weather patterns, flooding, decreased air and water quality, increased illness, impacts to housing—these are just a few of the impacts Metro-Detroiters (and beyond) will experience from climate change if actions aren’t taken.

January 2022 Economic Indicators

In November of 2021 the unemployment rate for the State of Michigan remained steady while the City of Detroit’s unemployment rate declined from the previous two months. The State of Michigan reported an unemployment rate of 5.9 in November, which was just slightly below the 6.2 percent unemployment rate reported in October. This is the first time the State’s unemployment rate has gone above 6.1 percent since January of 2021. In November of 2020 the unemployment rate was 6.3, which is on par with the November 2021 rate.

For the City of Detroit, the unemployment rate for November of 2021 was 8.4 percent, which is below the October rate of 10 and the September rate of 11.7. In November of 2020 the Detroit unemployment rate was 18.7, meaning there has been a significant decrease in the local unemployment rate in the last year.

While the data sets explored here show that unemployment rates are returning to pre-pandemic rates, the leisure, hospitality and tourism industries remain among the hardest hit, with many jobs not expected to return. But, hope remains, especially has new business formations increased by 56 percent in 2021, according to Michigan State University.

As should be expected, each county in Southeastern Michigan, with the exception of Washtenaw County, had a higher unemployment rate in November of 2020 as compared to November of 2021. Wayne County had the largest decrease between 2020 and 2021 at 7.1 points; the November 2021 unemployment rate was 4.9 percent. Wayne County also had the highest unemployment rate of the seven counties in November of 2021. Washtenaw County had the second highest unemployment rate during this time period at 4.7 percent, which was higher than the 2020 November unemployment rate of 3.7 percent.  Livingston County had the lowest unemployment rate in November of 2021 at 2.5 percent; the unemployment rate was 6.3 percent in November of 2020.

The charts below show the percent changes in the Consumer Price Index (CPI) on a month-to-month basis and a year-to-year basis for each month in years 2019, 2020 and 2021 in the Midwest Region. The CPI is a measure that examines the weighted average of prices of consumer goods and services, such as transportation, food, energy, housing and medical care. It is calculated by taking price changes for each item in the predetermined group of goods and averaging them.
The first  chart below highlights how the CPI changed on a month-to-month basis between 2019 and 2021. Currently in 2021, area prices are up 0.4 percent between October and November. According to the Bureau of Labor Statistics, contributing factors to the increase include a 2 percent increase for new and used motor vehicles and a 0.4 percent increase for shelter; the cost of apparel, education and communication decreased. Other factors included the increased cost of “food away from home” prices, which increased 1.2 percent, and energy prices which increased 0.8 percent.

When examining the second chart, which shows how prices changed on a year-to-year basis,  we see how prices continue to increase in 2021, with the November year-to-year CPI being the highest increase shown below. In November of 2021 the CPI was reported to be 7.9 percent above what it was the year prior. Contributing factors to the continued increase in the CPI include an increase in new and used motor vehicle prices by 17.2 percent, an increase in shelter by 4.5 percent, and an increase in household furnishings and operations by 7.6 percent. Additionally, energy prices increased by 36.7 percent between November of 2020 and November of 2021, largely due to higher prices for gasoline (62.9 percent). Prices paid for natural gas service increased 35.3 percent, and prices for electricity rose 3.6 percent during the last year. Food prices increased by 7.1 percent over the year, which also contributed to the increased CPI.

Home prices continue to increase, as has already been indicated by the increasing CPI. In Metro Detroit, according to the Case-Shiller Home Price Index, the average price of single-family dwellings sold was $156,550 in September of 2021; this was $1,110 higher than the average family dwelling price in August. The September 2021 price was an increase of $20,790 from September of 2020 and $58,210 from September of 2014. Home prices have continued to increase year-after-year but the recent average price of single-family dwellings sold in the Metro-Detroit area has shown signs of slowing down. For example, if you look at past economic indicators over the last year, the data shows that month-to-month and year-to-year increases were higher in previous months than for September.