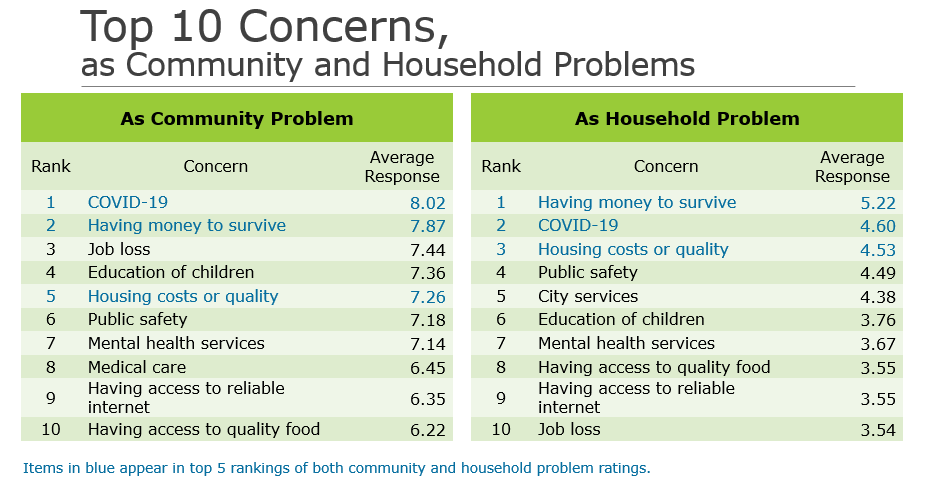
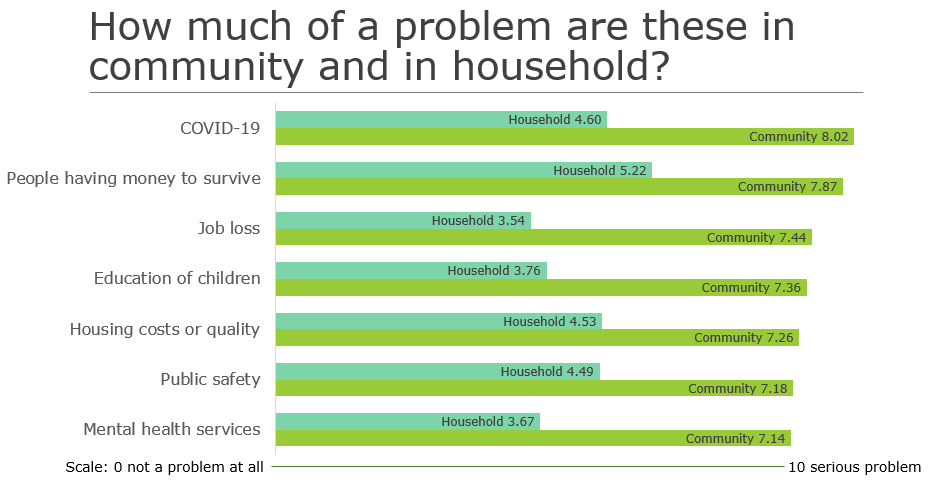
When respondents to the 2021 Detroit Community Survey were asked to rate top problems for their community and household, COVID-19 again found its way to the top of the list. Respondents were presented with a list of 15 concerns and asked to rate each one on a scale of 1-10, with 10 being the most serious, on how much of a problem it was their community and their household. For each item, the average response was greater on the rating as a community problem than as a household problem.
According to the respondents, COVID ranked as an 8.02 on the scale as a community problem and a 4.6 as a household problem. The average difference between the two ratings ranged from 1.59 to 3.92, and averaged 2.97.
The respondents ranked COVID, having money to survive and job loss as the top three community problems. The top three household problems were having money to survive, COVID and housing costs or quality.
As noted in the Monday post, COVID remains a problem locally, across the state and nationwide. Although the vaccination numbers continue to climb, so do confirmed COVID cases. On March 30 there 5,177 new confirmed cases, bringing the State total to 665,948 confirmed COVID cases. As noted in the Monday post, COVID remains a problem locally, across the state and nationwide. Although the vaccination numbers continue to climb, so do confirmed COVID cases. On March 30 there 5,177 new confirmed cases, bringing the State total to 665,948 confirmed COVID cases. Additionally, statewide unemployment rate was 5.2 percent in February and in Detroit the unemployment rate was 11.4 percent in January of 2021. So, the data on objective reality is entirely consistent with the issues that are at the top of residents’ list of concerns.
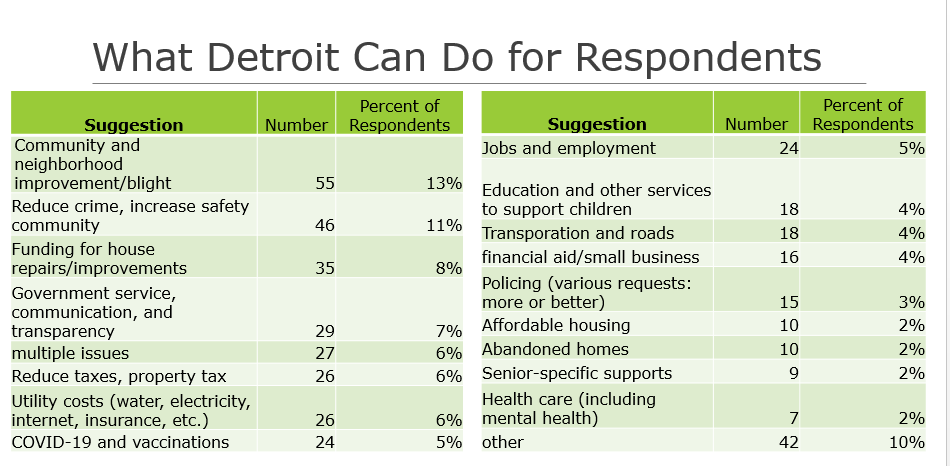
The Wayne State University Center for Urban Studies worked with MDP Black Caucus to develop the 2021 Detroit Resident Survey. This survey, based upon a random sample of Detroit residents found that the top area of improvement citizens want is community and neighborhood improvement/blight reduction. The second most frequently sought improvement was a reduction in crime together with an increase in community safety. Overall, there were 18 general areas that survey respondents said the City of Detroit can do to help them and their household. The 621 respondents to the survey made 437 suggestions on how the City can be improved.
As noted, the most common suggestion on what Detroit can do for citizens is to improve its community and neighborhoods and remove blight. Thirteen percent of respondents, or 55 citizens, made this suggestion. Eleven percent of respondents, or 46 citizens, suggested reducing crime and increasing community safety.
Blight and neighborhood improvements have long been a concern in the City of Detroit and while work has been done over the last several years, clearly residents still have concerns–as do community leaders. Between 2014 and 2020 more than 15,000 homes in the City of Detroit were knocked down with $265 million in federal funding. There are about 22,000 vacant properties left in the City that need to be addressed; the recent passage of Detroit’s Proposal N states the $250 million bond will allow an additional 8,000 to be razed and 6,000 to be secured.
On behalf of the Gilbert Family Foundation and Rocket Community Foundation, Dan and Jennifer Gilbert pledged $500 million over the next 10 years toward improving the Detroit community. The first $15 million will go toward paying the property taxes of 20,000 low income homeowners in the City. How the remainder of the donation will be spent has yet to be determined, but it could go toward things like digital equity, home repairs, housing access and employment. It is agreed upon though that with the funding must come a long-term strategy.
A reduction in blight can also improve community safety, according to a study by Wayne State University criminologists Matthew Larson and Charles Klahm IV. Larson and Klahm looked at Detroit crime data in areas where nearly 9,400 blighted homes were demolished between 2010 to 2014. According to their study they found that such blight demolitions reduced violent and property crimes. The study found that for about every three demolitions block-groups experienced about a 1 percent reduction in crime.
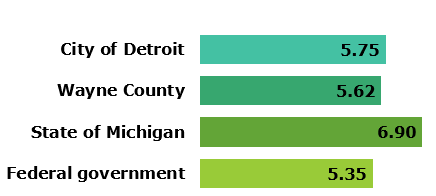
With a host of suggestions on how the City of Detroit can improve life for its residents it should not be a surprise than on a scale of 1-10 2021 Detroit Resident Survey respondents ranked their satisfaction with City leadership at a 5.75. Respondents rated their satisfaction with Wayne County leadership at a 5.62, at 6.9 with the State of Michigan’s leadership and 5.35 with the leadership at the federal level.
Tomorrow, we will further dig into the concerns of Detroit citizens, highlighting specific household and community concerns.
A lot of expectations come with being elected President of the United States, and the citizens of Detroit want President Joe Biden’s top priority to be continuing to navigate the COVID-19 pandemic.
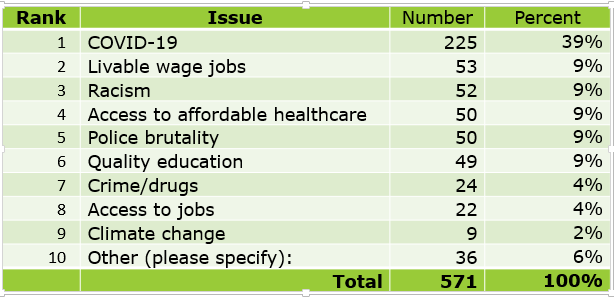
According to the 2021 Detroit Resident Survey conducted by the Wayne State Center for Urban Studies between Jan. 15 and March 1, 2021, 39 percent of respondents said COVID-19 should be President Biden’s top issue. Respondents, all who are Detroit citizens, were asked to choose from a list of 10 priorities on what they believe should be the top. Of the 571 respondents to this question 225, or 39 percent, said it should be COVID-19. Livable wages, racism, access to affordable health care, police brutality and quality education were all separate priorities that each received 9 percent of the vote as to what Biden’s top priority should be.
As of March 28, 2021 an ABC News/Ipsos poll found that President Biden received a 72 percent national approval rating for his handling of the COVID-19 pandemic. Additionally, the same ABC News article states 75 percent of Americans back how the President is handling the distribution of COVID vaccines. In the State of Michigan 653,659 COVID-19 cases were confirmed as of March 27, 2021 and in Detroit 32,998 COVID cases have been confirmed. In terms of vaccine distribution, according to the State of Michigan, 18 percent of residents are fully vaccinated and 31 percent of residents have started the process. Furthermore, 9.5 percent of Detroit residents are fully vaccinated and 17.6 percent have started the process, according to the City of Detroit Health Department.
While vaccination numbers continue to rise in Detroit and the State of Michigan, so do COVID numbers. On March 26, 2021 there were 4,670 new cases in Michigan and a 10 percent positivity rate, the highest recorded since December 2020.
Aside from COVID infections and deaths, economic and education issues related to the disease loom too. In February of 2021 the Michigan unemployment rate was 5.2 percent and in Detroit the unemployment rate was 11.4 percent in January of 2021 (the most recent data at the local level). And, just as soon as schools began to open, several districts are again moving back to online learning in response to the uptick in COVID cases.
While Detroit citizens have opinions of what Biden’s top priorities as President should be they also expressed opinions on the following in the 2021 Detroit Resident Survey:
What they feel the state of leadership is at the federal, state and local level;
How Detroit officials can best serve their citizens;
What their top household and community concerns and problems are;
What the barriers to finding employment and building wealth are;
The responses to these issues will be further explored this week in additional blog posts.
All response data in this post and in upcoming posts are from the 2021 Detroit Resident Survey conducted by the Wayne State University Center for Urban Studies, with the assistance of the MDPBlack Caucus. The survey was based on a random sample of about 20,000 households whose information was purchased from a business marketing vendor. The households were distributed throughout Detroit and where available, the vendor provided landlines, mobile telephone numbers associated with each household. Survey interviewers reached 953 individuals, 678 of whom confirmed they were Detroit residents. The Survey Findings are based on weighted totals and statistics to achieve representative findings. Respondents received a chance to be randomly selected to receive one of 10 $50 visa gift cards.
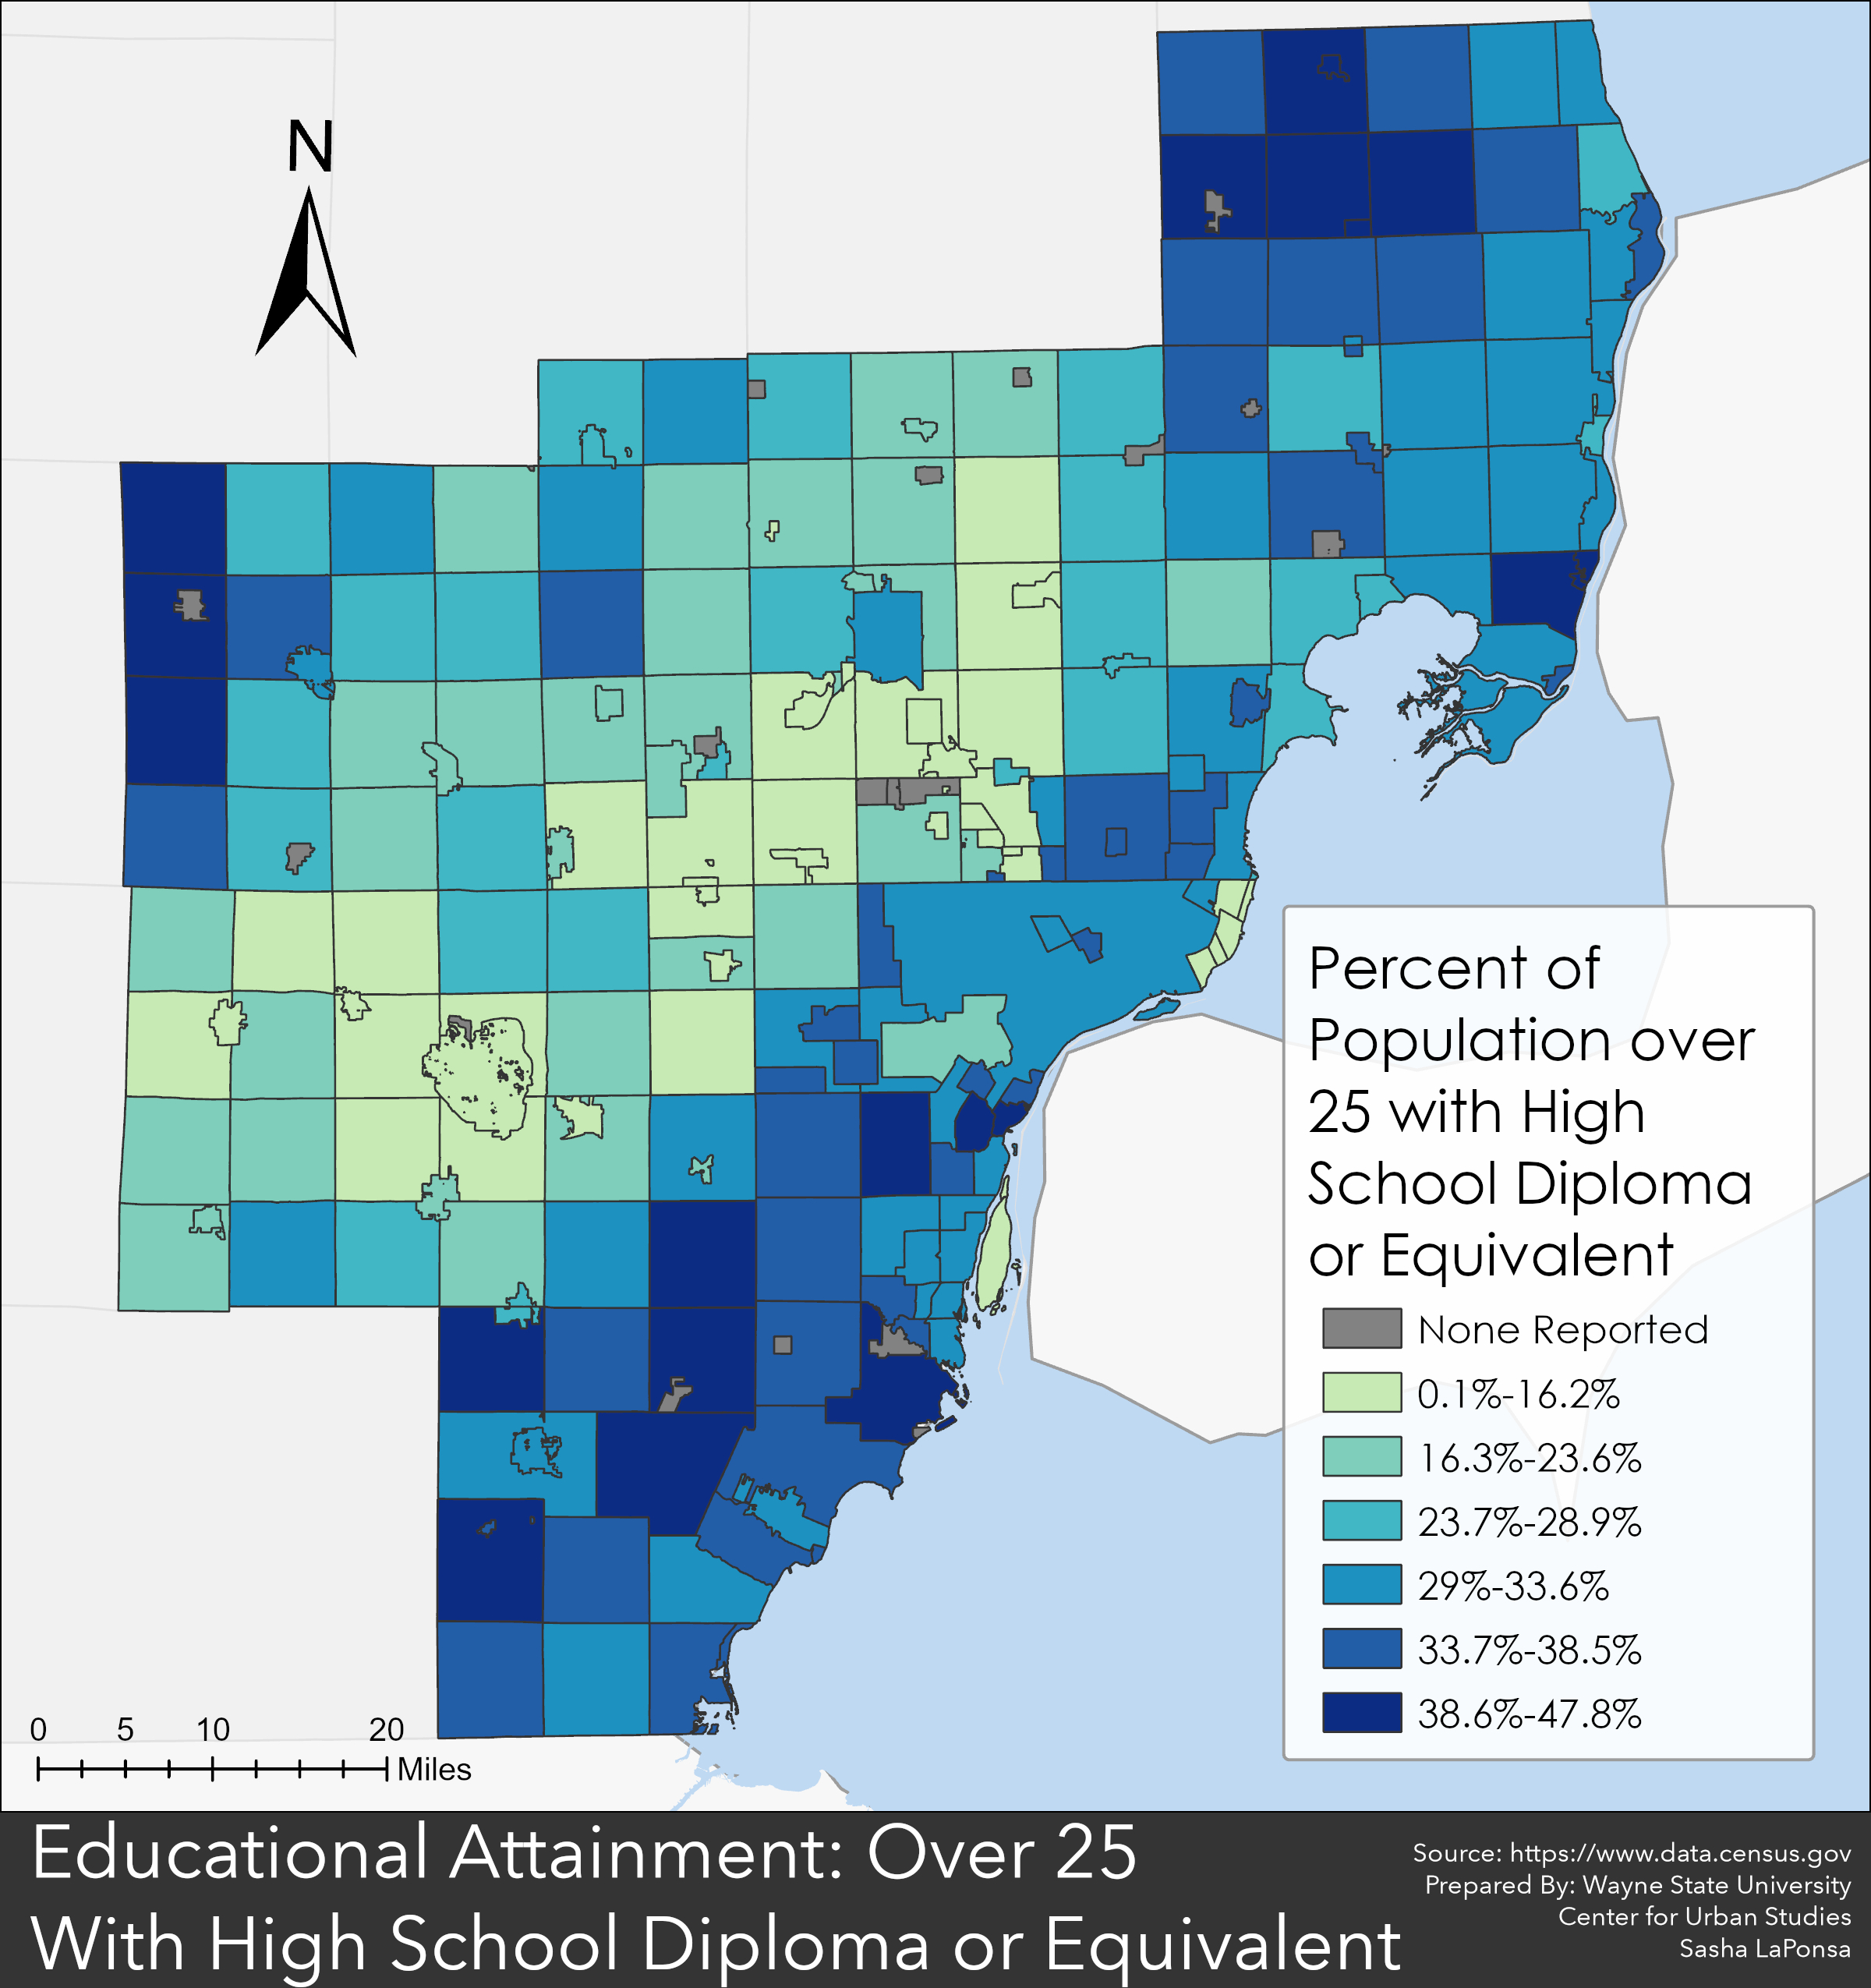
Understanding the educational attainment levels of a geographical location is important because it impacts employment rates, average income levels, job markets and other socioeconomic factors. Educational attainment is also dependent on several factors including, geography, family structure, transportation and access to educational opportunities. The majority of communities in Southeastern Michigan have 25 percent or more of their 25 years of age and older population with only a high diploma or equivalent. Furthermore, there are 14 communities in the region where 40 percent or more of that specific age population who had only attained a high school diploma or equivalent, according to 2019 data from the US Census Bureau. In Southeastern Michigan, Cottrelleville Township in St. Clair County had the highest percentage of residents 25 years of age or older with only a high school diploma at 48 percent. Exeter Township in Monroe County had the second highest percentage of residents with only a high school diploma at 44 percent. Both of these communities are outside of the inner-ring urban suburbs and are much less densely populated. There were several inner-ring suburbs though where a high school diploma was often the highest level of educational attainment. For example, in both Ecorse and Lincoln Park and 40 percent of the 25 years of age or older population only had a high school diploma or equivalent; in Hazel Park that percentage was 37 percent. In the City of Detroit 32 percent of 25 years of age or older population had only a high school diploma or equivalent. Pleasant Ridge had the lowest percentage of residents with only a high school diploma at 5 percent.
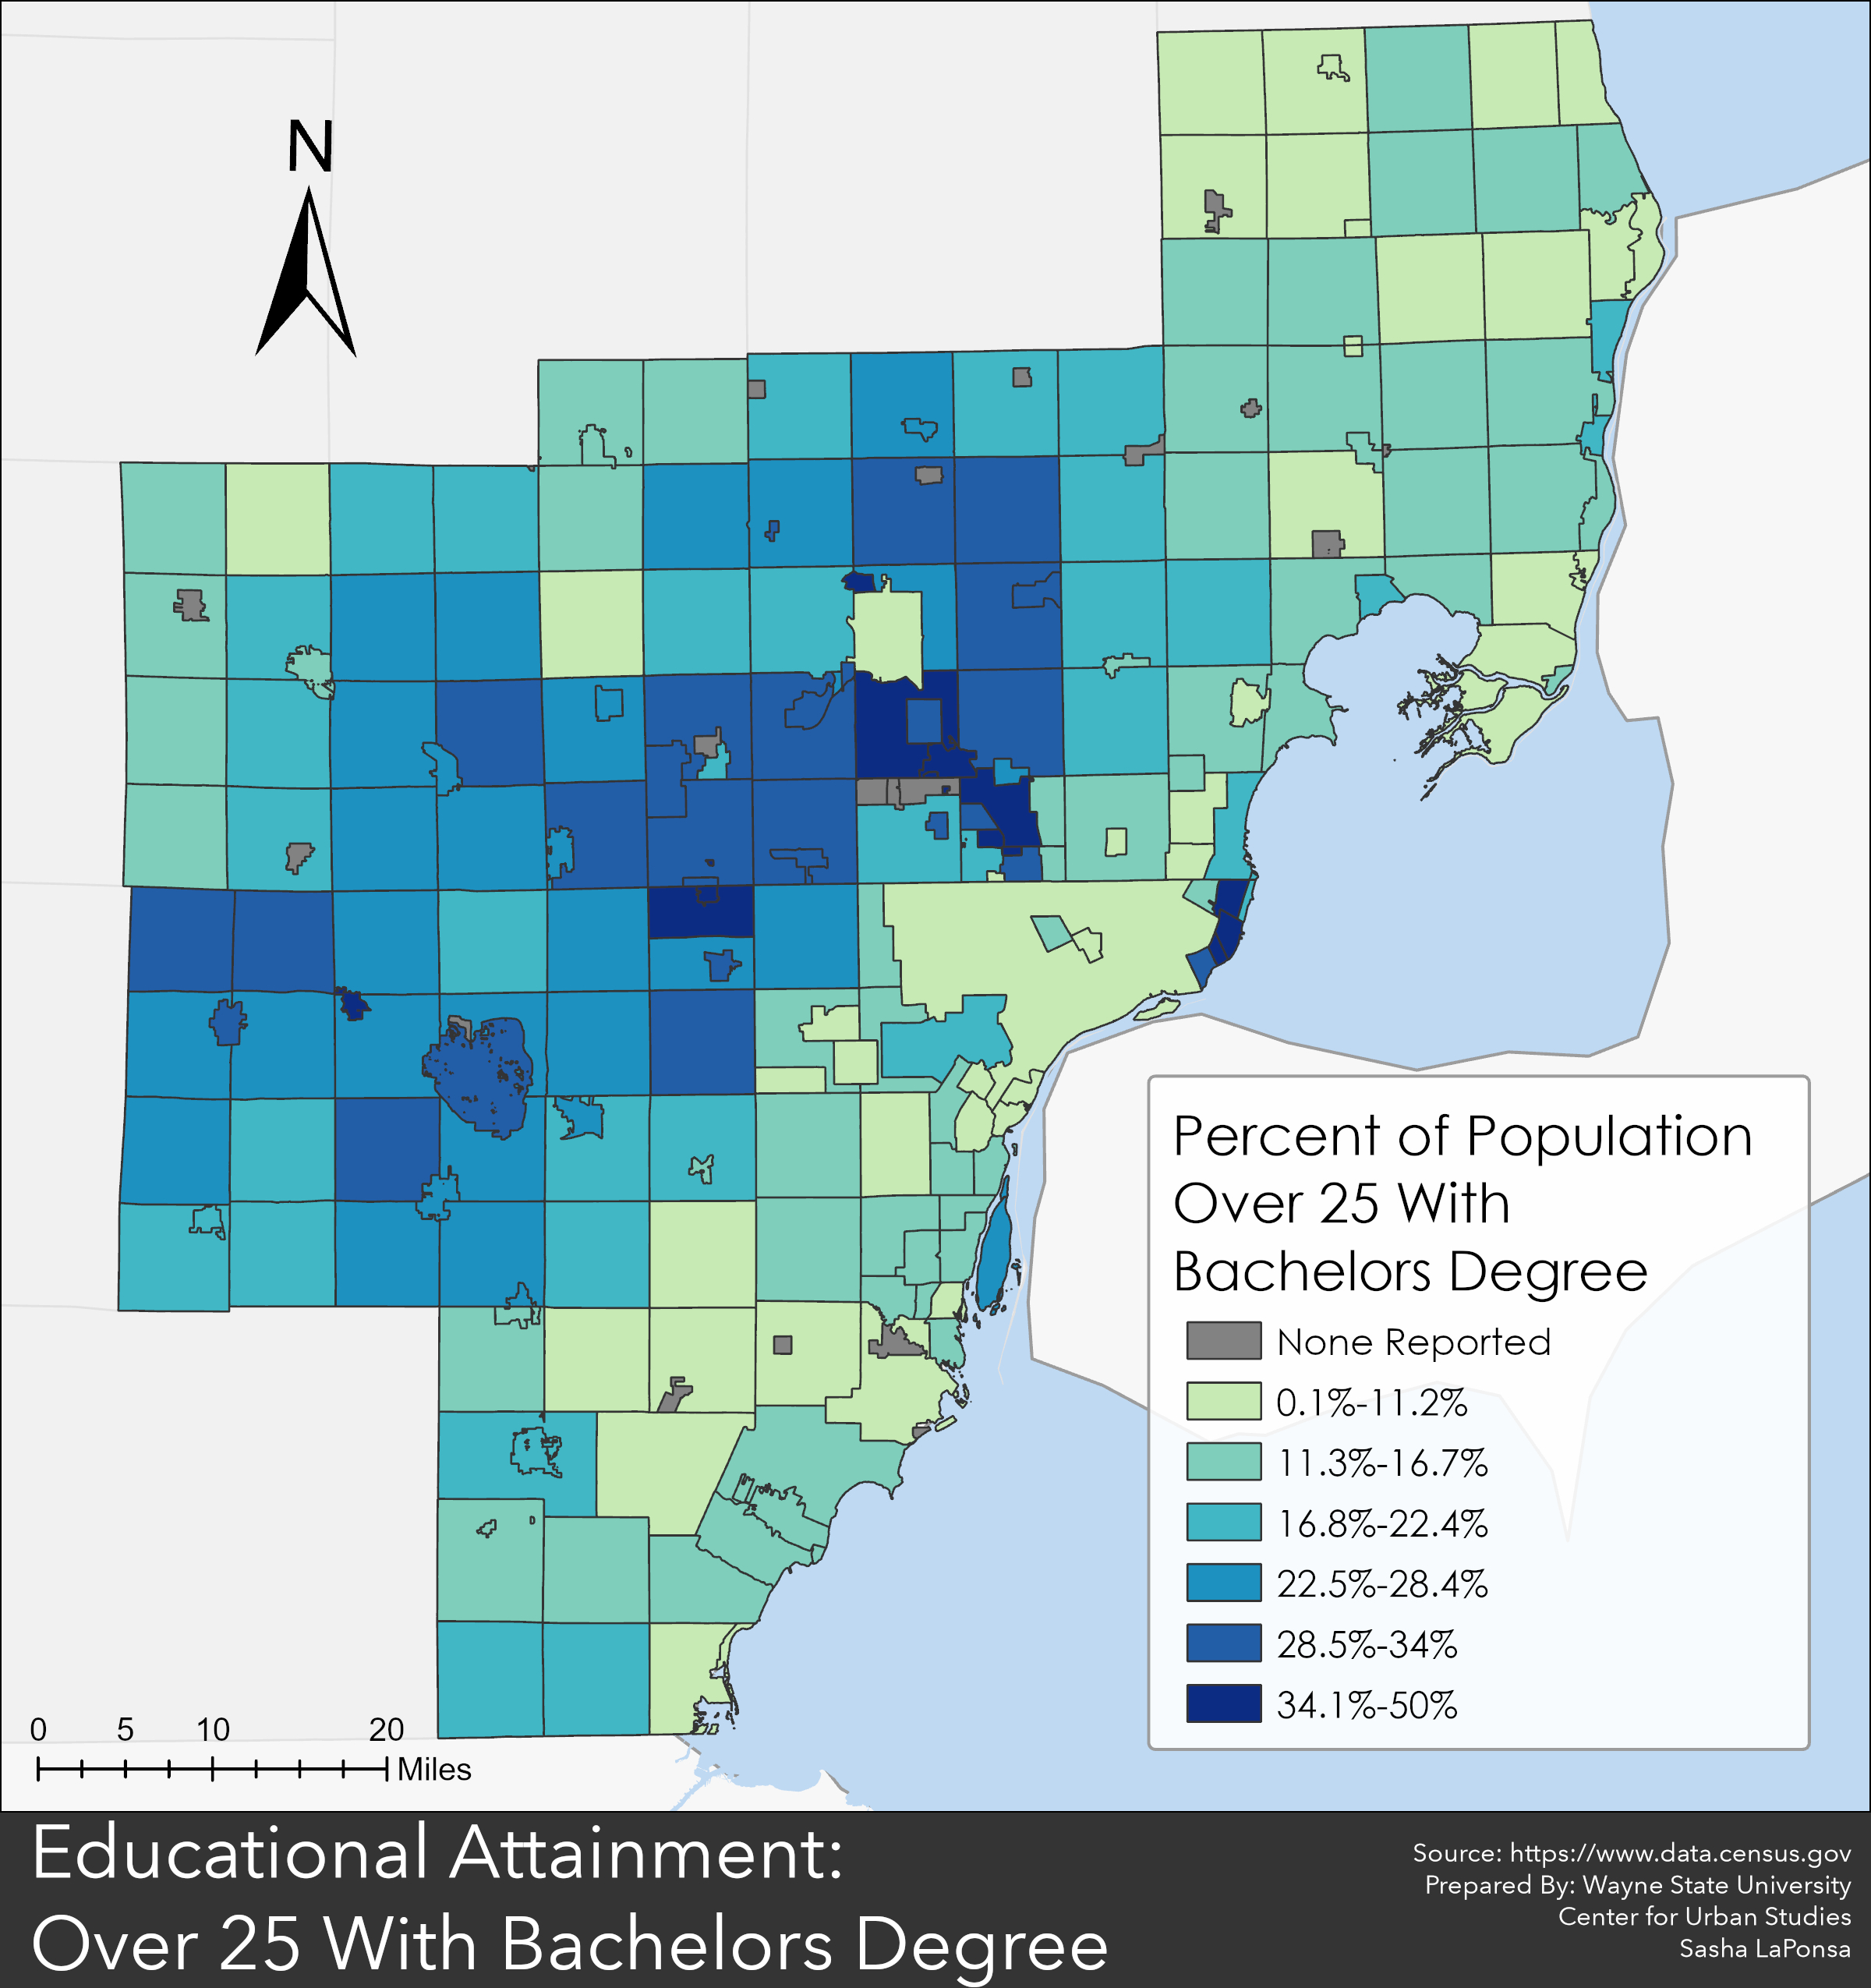
Just as Pleasant Ridge had the lowest percentage of residents 25 years of age or older with only a high school diploma it also had the highest percentage of residents in that age frame with a bachelor’s degree. In Pleasant Ridge 40 percent of the 25 years of age or older population had a bachelor’s degree; the same was true for Grosse Pointe Farms and Lake Angelus. Overall, Oakland and Washtenaw counties had the highest percentage of residents 25 years of age or older with a bachelor’s degree. While Cottrelleville Township in St. Clair County had the highest percentage of residents with only a high school diploma or equivalent, it did not have the lowest percentage of residents with a bachelor’s degree. Ecorse, Hamtramck and Highland Park all had populations 25 years of age or older where only 7 percent of the residents had a bachelor’s degree. In Detroit, 9 percent of the 25 years of age or older had a bachelor’s degree. While there was a concentration in Detroit and its direct neighbors with low college education attainment, this was also true for the more rural counties. Clay Township in St. Clair County had among the lowest percentage of residents 25 years of age or older with a bachelor’s degree at 9 percent, as did London and Luna townships. Several of the communities in St. Clair and Monroe counties had 15 percent or less of residents 25 years of age or older with a bachelor’s degree.
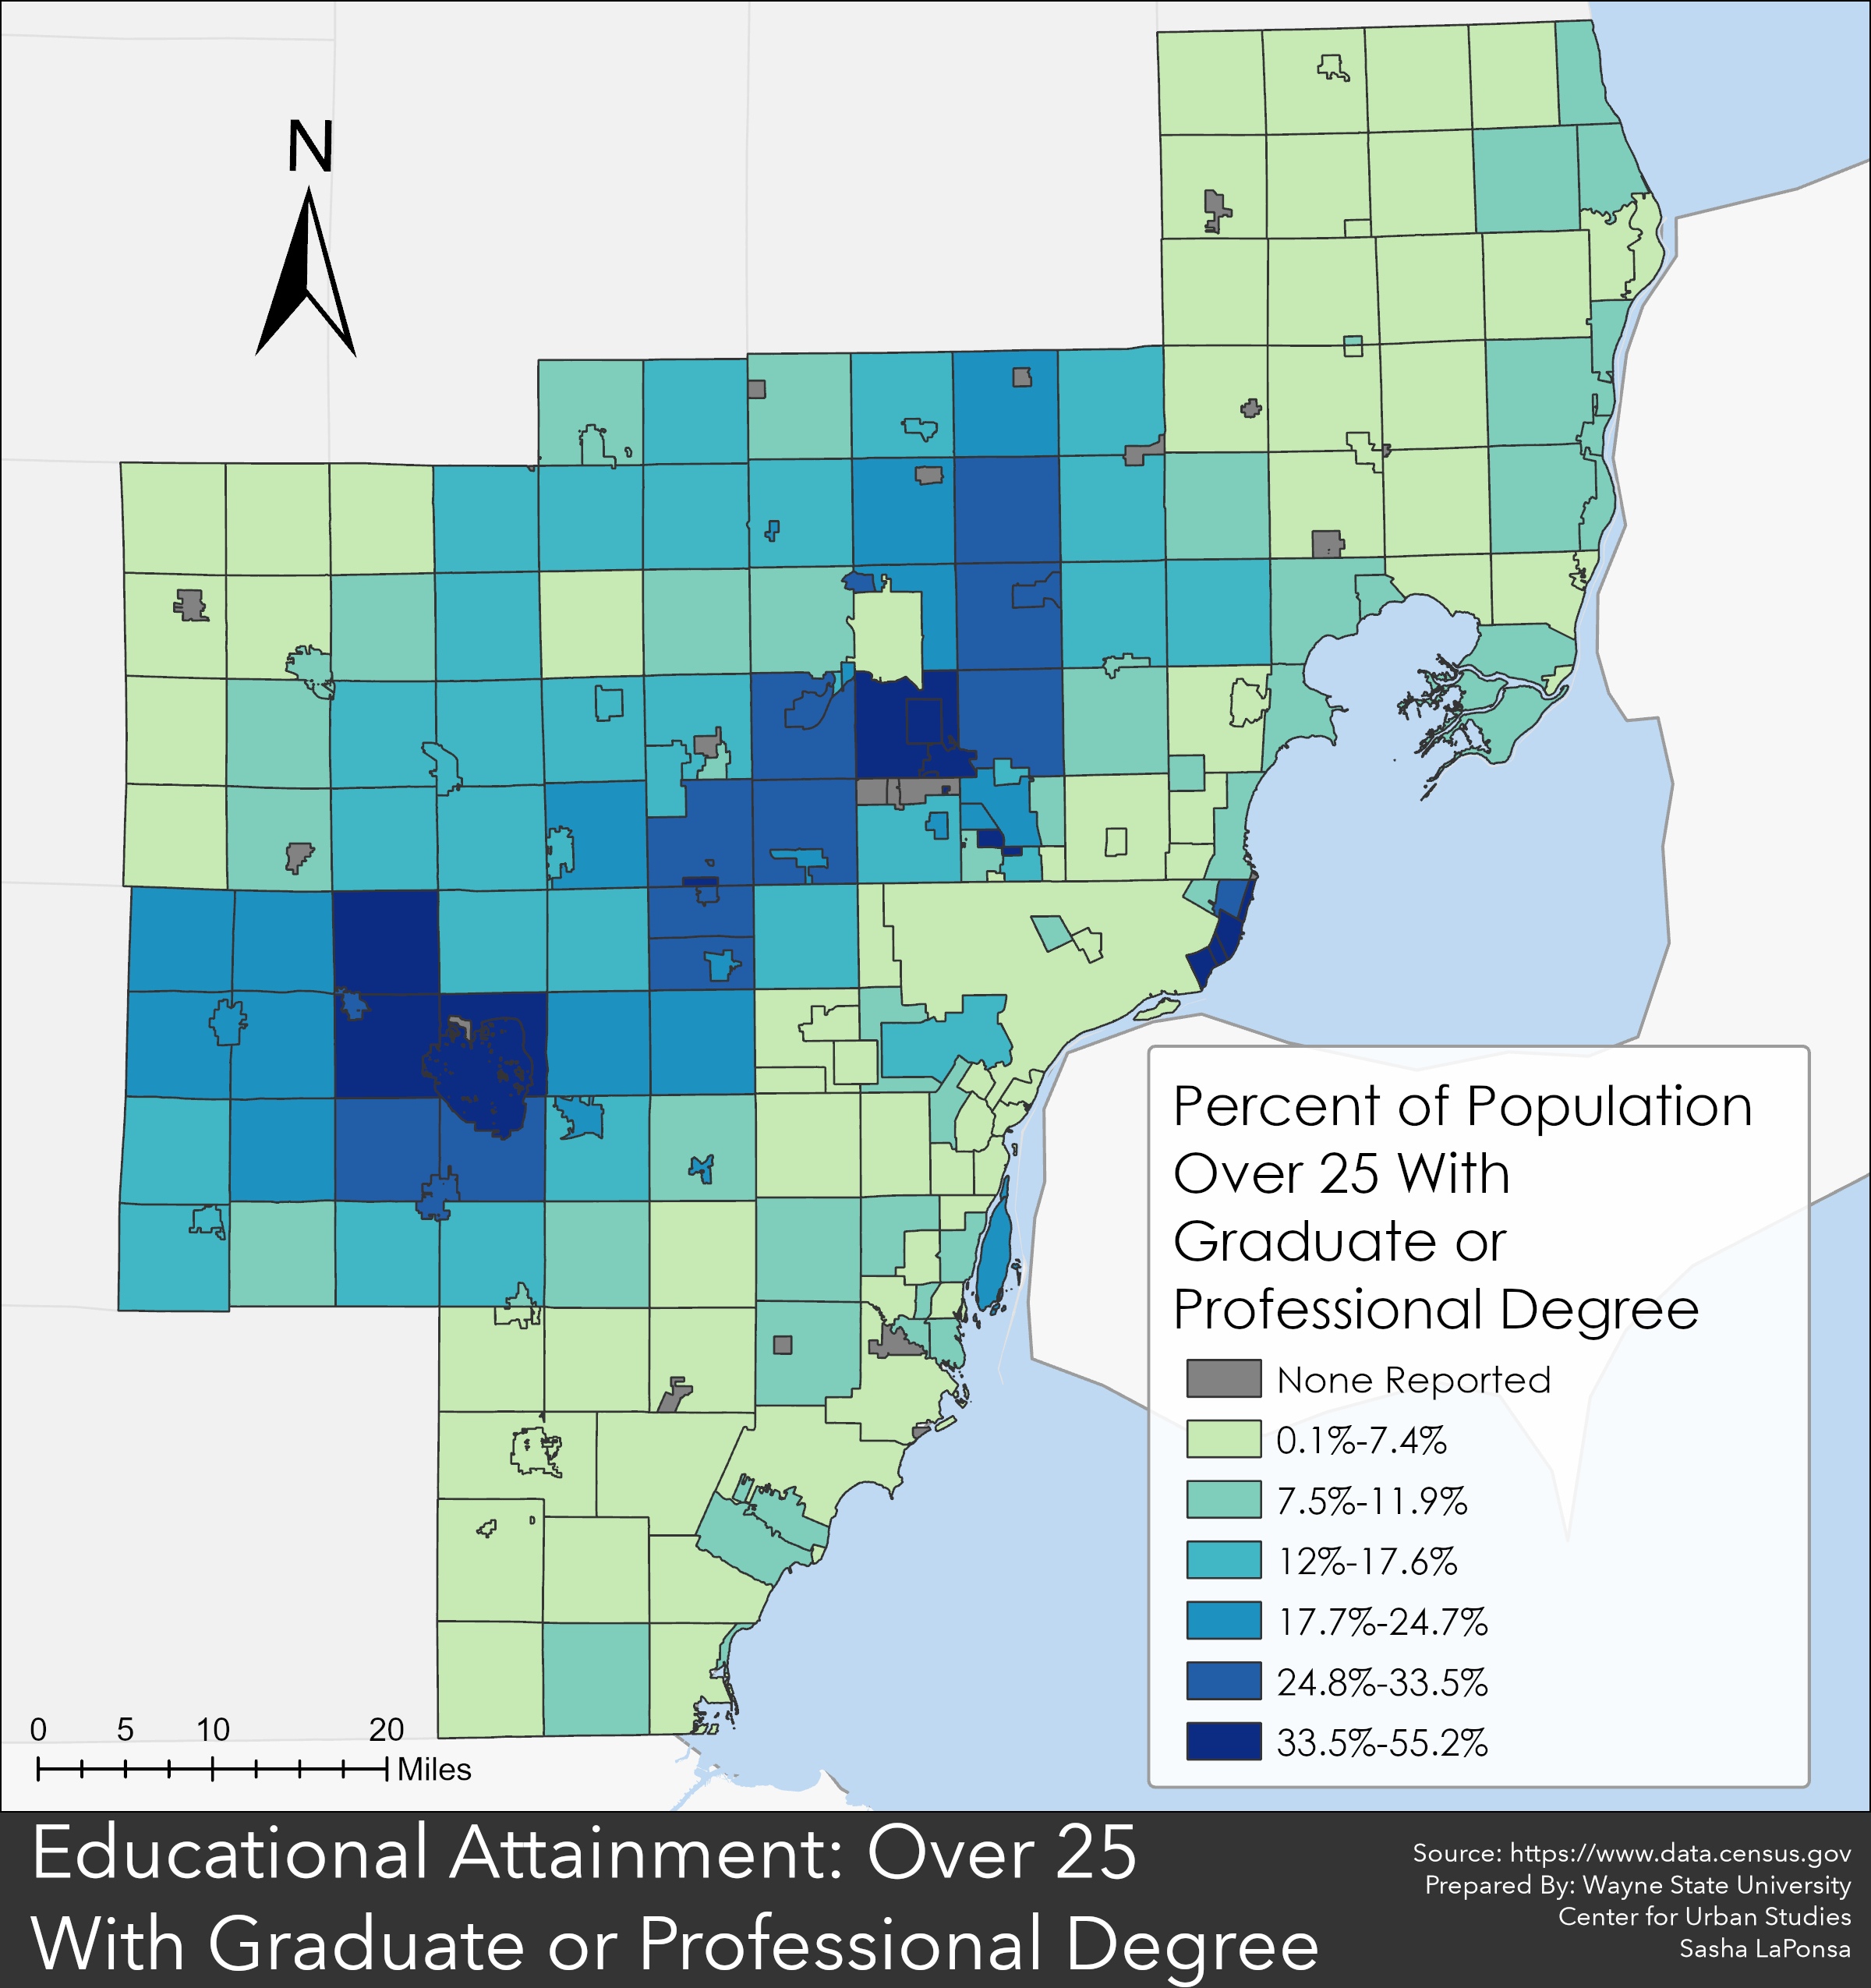
As one may expect, those with among the highest percentage of residents with a bachelor’s degree also had higher percentages of residents with a master’s degree. In Ann Arbor Township 55 percent of the 25 years of age or older population earned a master’s degree; in the City of Ann Arbor 44 percent had the same level of educational attainment. These were the highest percentages in the region of those who obtained a master’s degree. In the City of Detroit 6 percent of the 25 years of age or older population earned a master’s degree. In areas such as St. Clair and Monroe counties the percentage with a masters were mostly in the single digits; this was also true for many of the immediate inner-ring suburbs.
While there is a high percentage of residents 25 years of age or older with only a high school diploma Gov. Gretchen Whitmer recently unveiled a program that promises free community college tuition to residents 25 and older. This program is to make it easier for Michigan residents to earn a form of higher education. According to the State of Michigan, about 4.1 million of Michigan’s 10 million residents qualify for the program, which is called Michigan Reconnect. Furthermore, about 3 million of those who qualify are between the ages of 25-64, according to Census data.
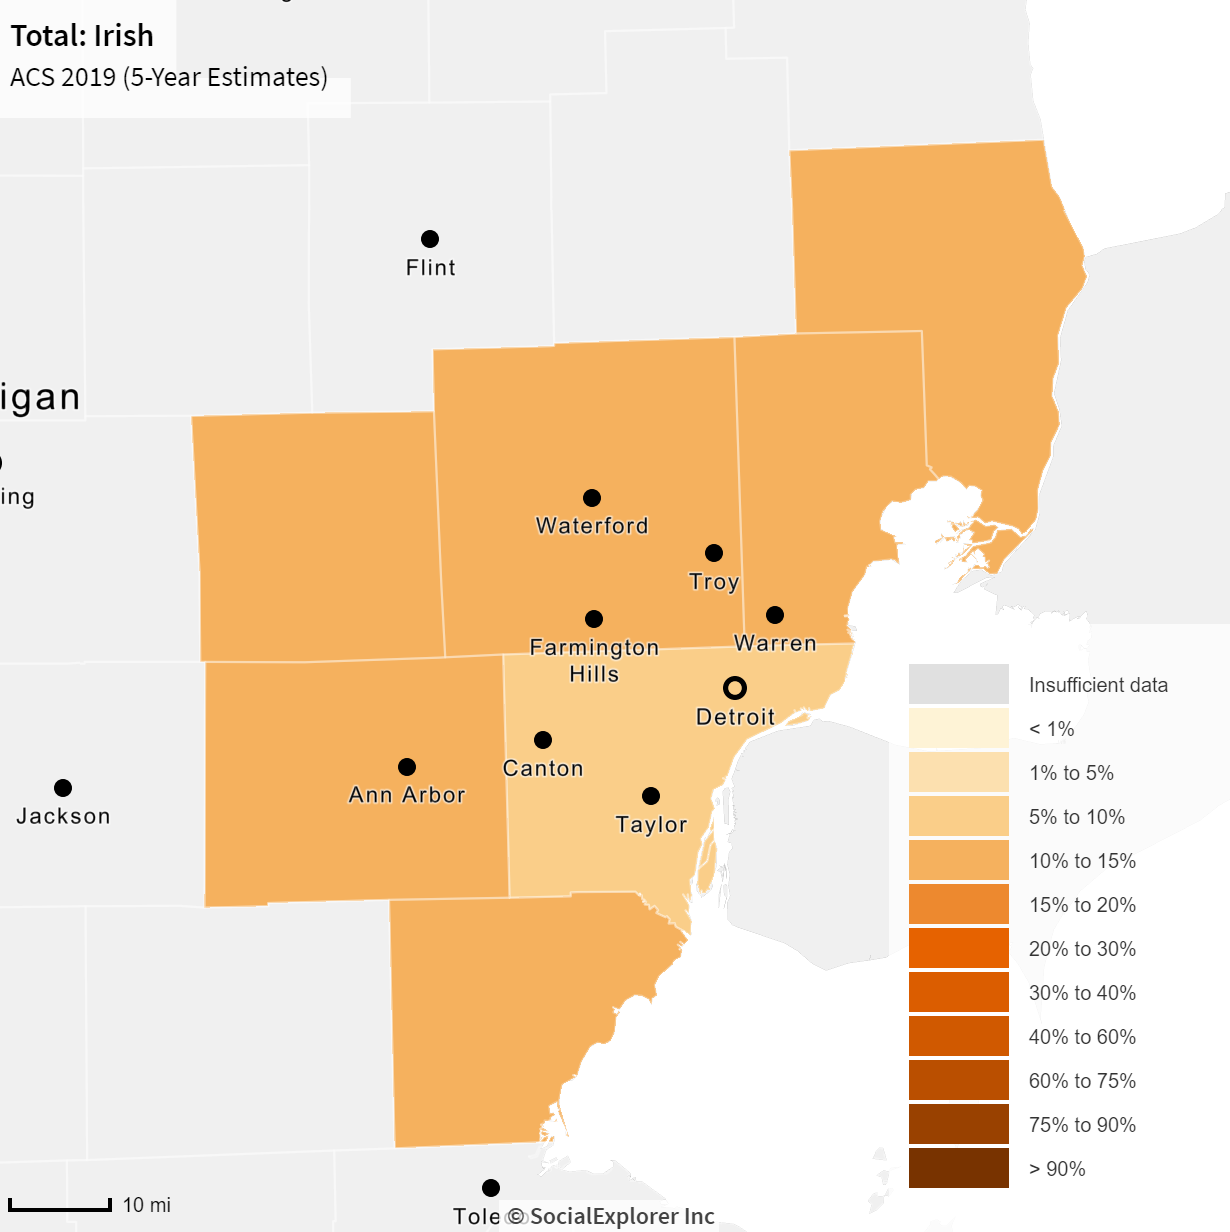
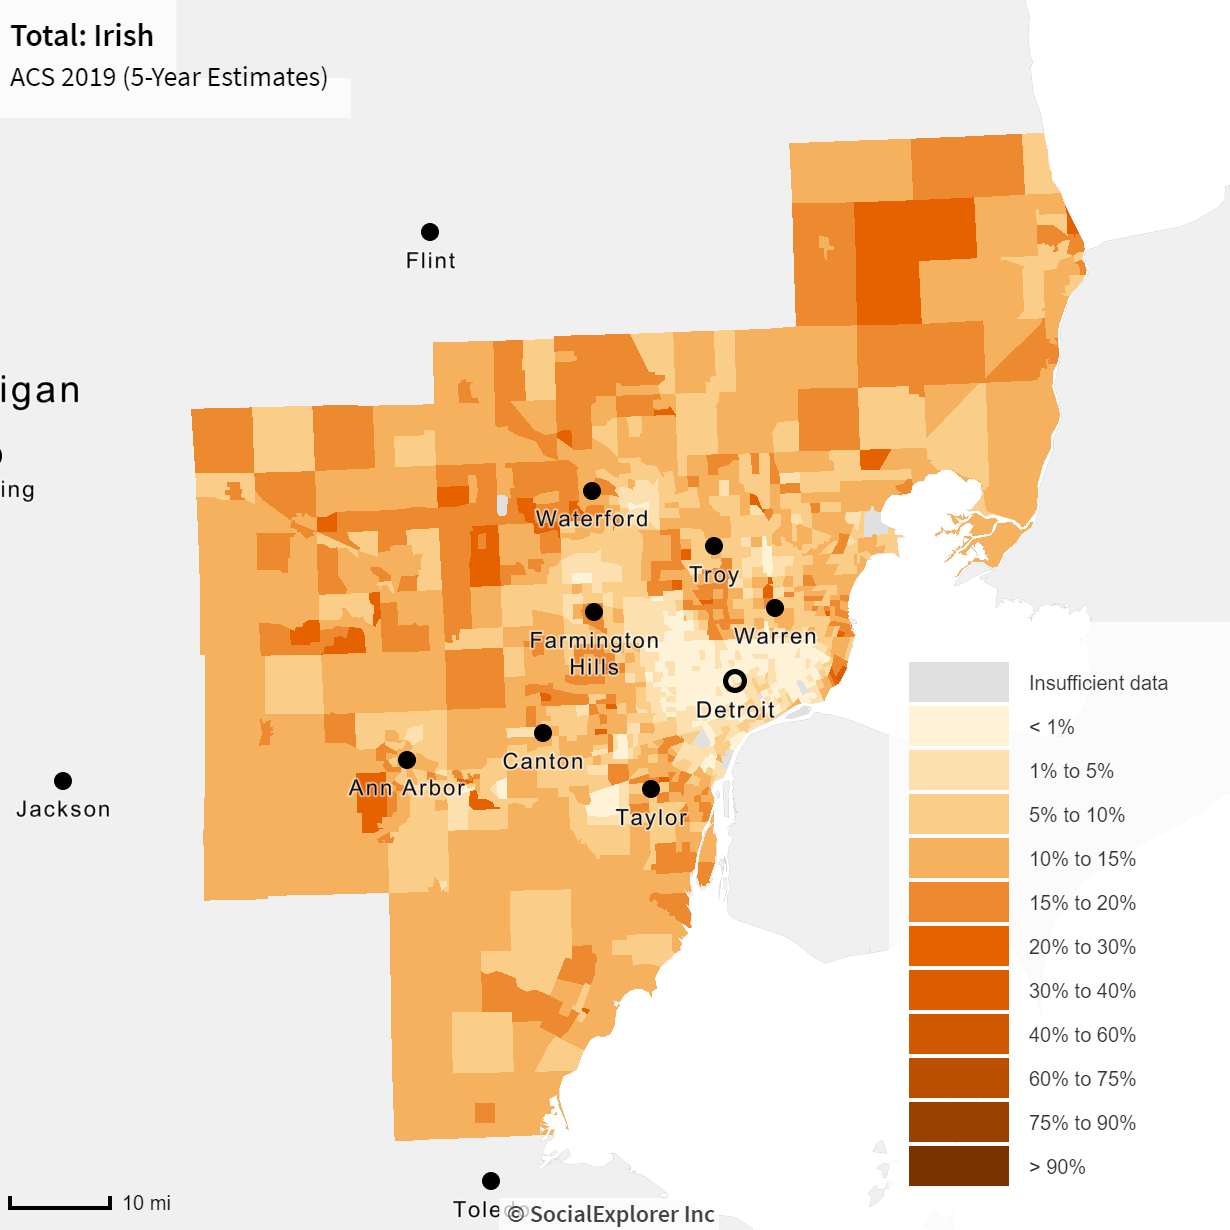
Everyone acts as if they have the luck of the Irish on St. Patrick’s Day, but according to Census data those with that ancestral luck are in the minority. According to 2019 ancestral data, Livingston County had the highest percentage of residents with Irish ancestry at 14 percent, followed by St. Clair County with 13 percent of the population claiming Irish ancestry. Wayne County had the lowest percentage at 7 percent. A closer look at the region through Census Tract data shows that an area in Grosse Pointe had the highest percentage of those with Irish ancestry at 30 percent; other pockets with some of the highest percentages were near Ann Arbor, Port Huron, White Lake and Farmington Hills. Statewide, 11 percent of Michiganders reported Irish ancestry.
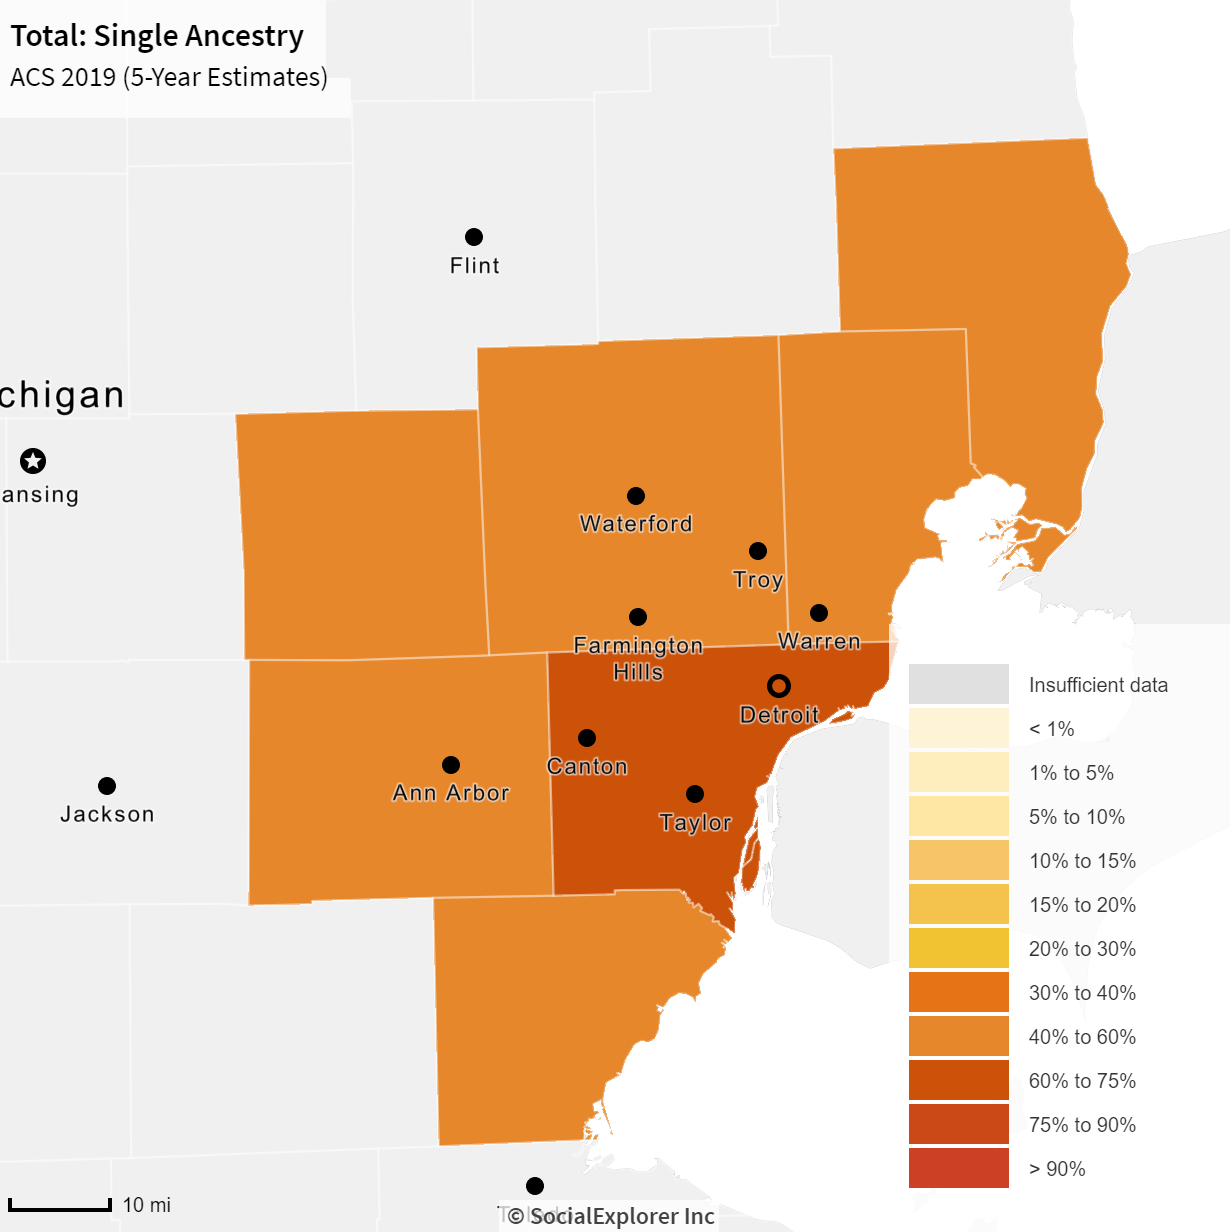
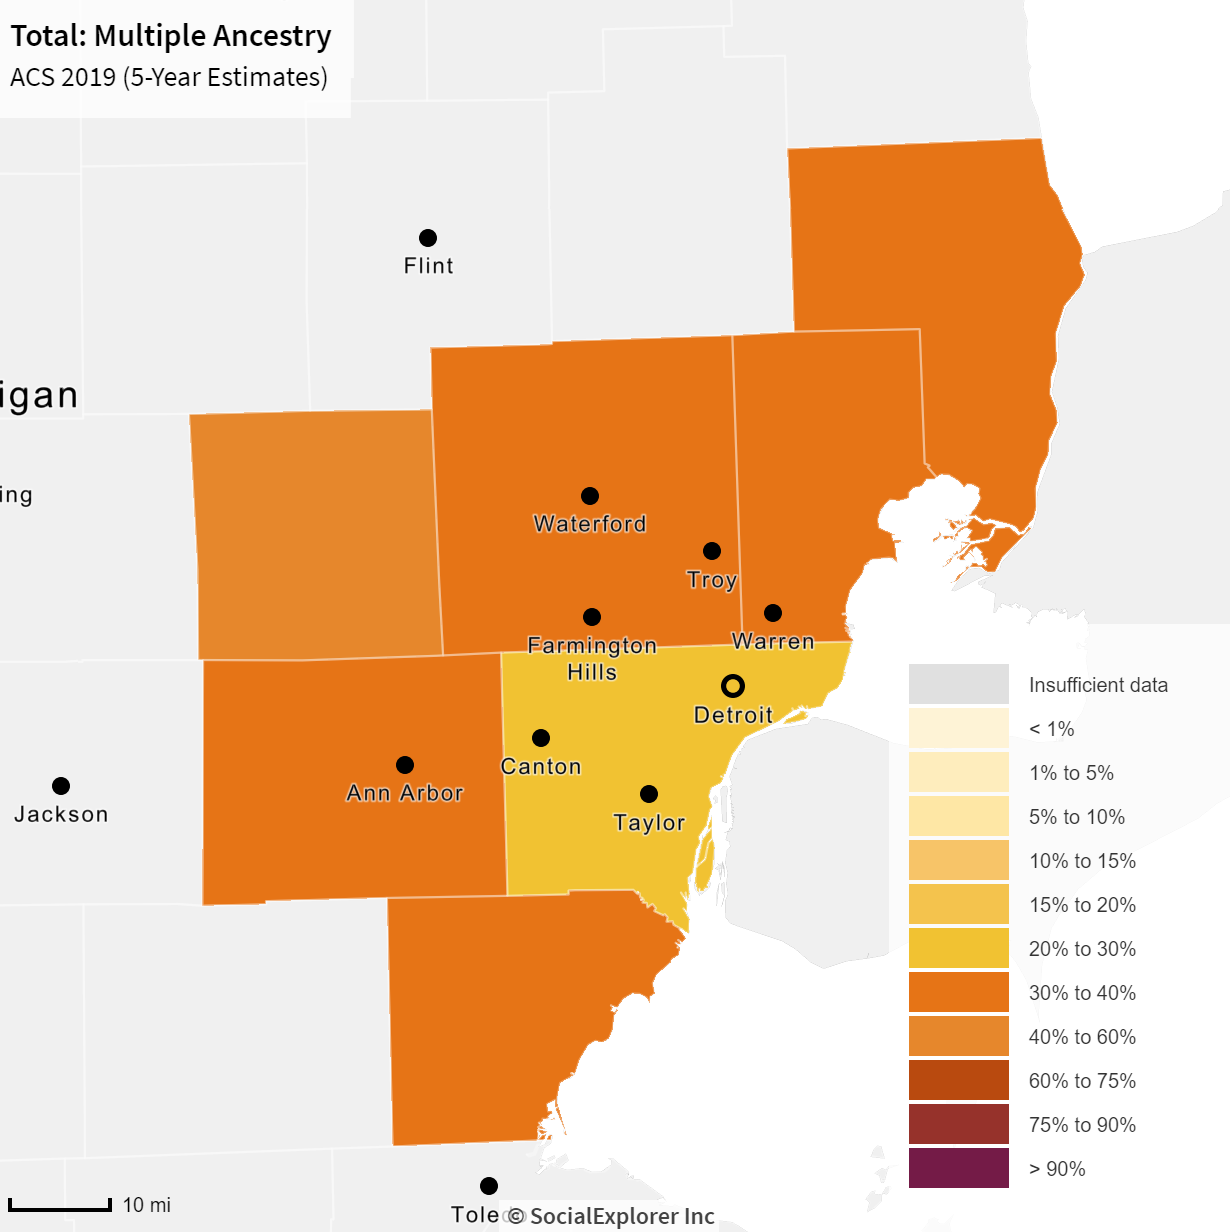
Understanding our ancestry is important, and the Census data not only shows breakdowns of origins from specific countries and regions, but also the percentages of those with single or multiple ancestral roots. Ancestry refers to one’s ethnic origin or heritage, or the place of birth of the person or the person’s parents or ancestors before their arrival in the United States. Throughout Southeastern Michigan each county had more than a third of its population report single ancestry data. Oakland County had the highest percentage of residents with a single ancestry at 53 percent, followed by Macomb County where 52 percent of the population reported a single ancestry of origin. Livingston County had the lowest percentage of residents with a single ancestry origin at 40 percent, conversely it had the highest percentage of multiple ancestry residents at 42 percent. Note that the percentages reported for multiple and single ancestry in the maps below do not add up to 100 percent, that is because the Census also accounts for those who do not report ancestry.
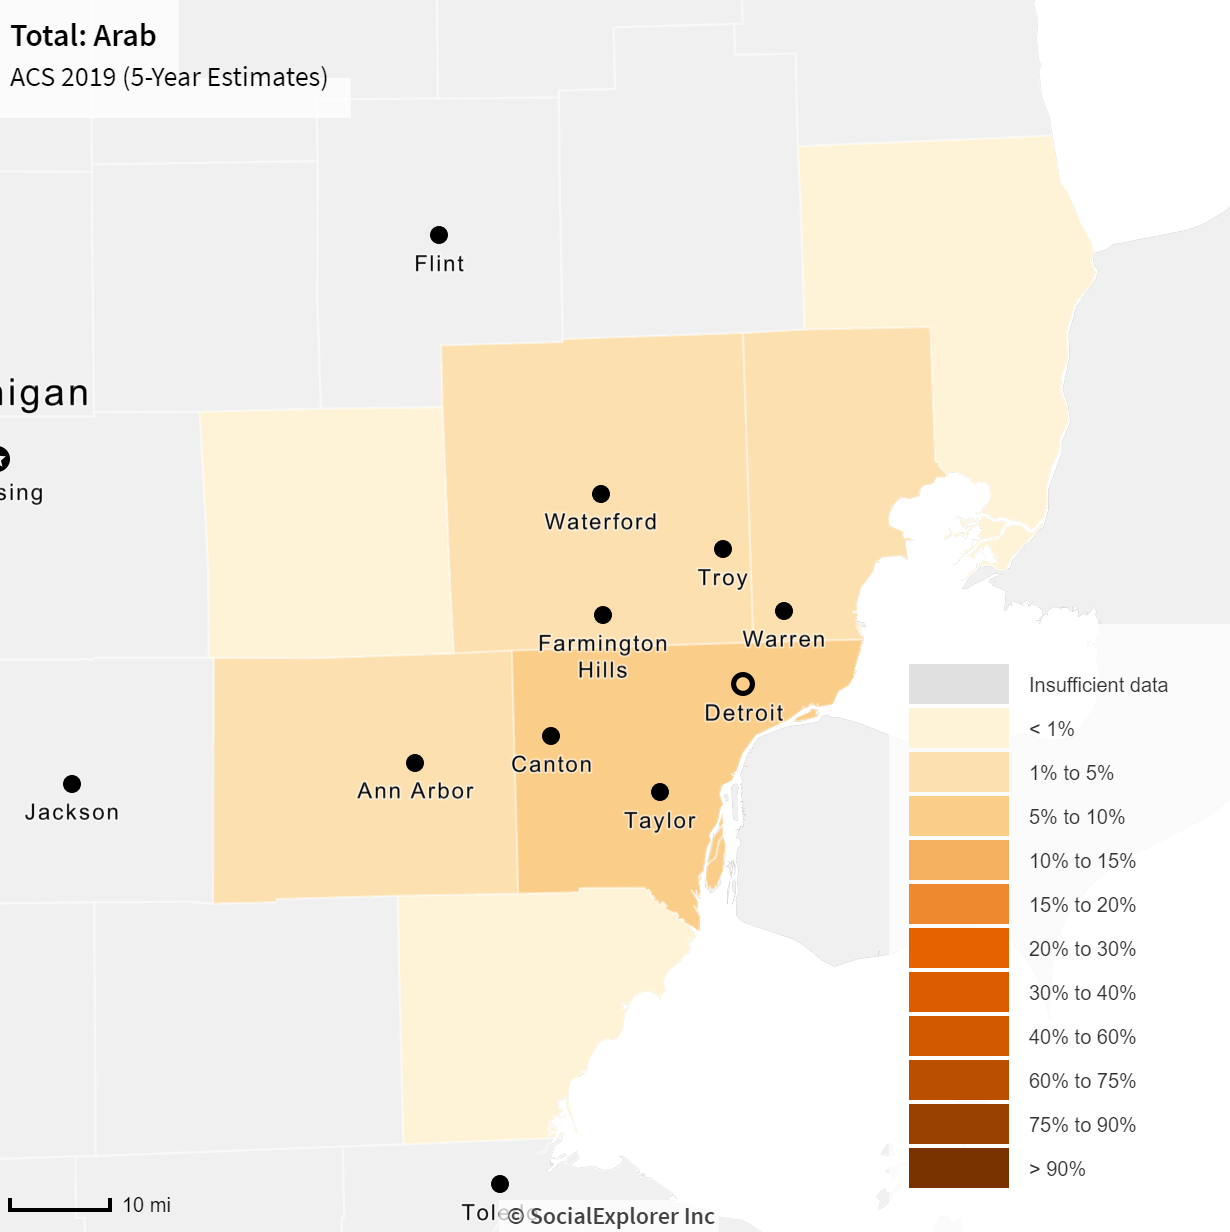
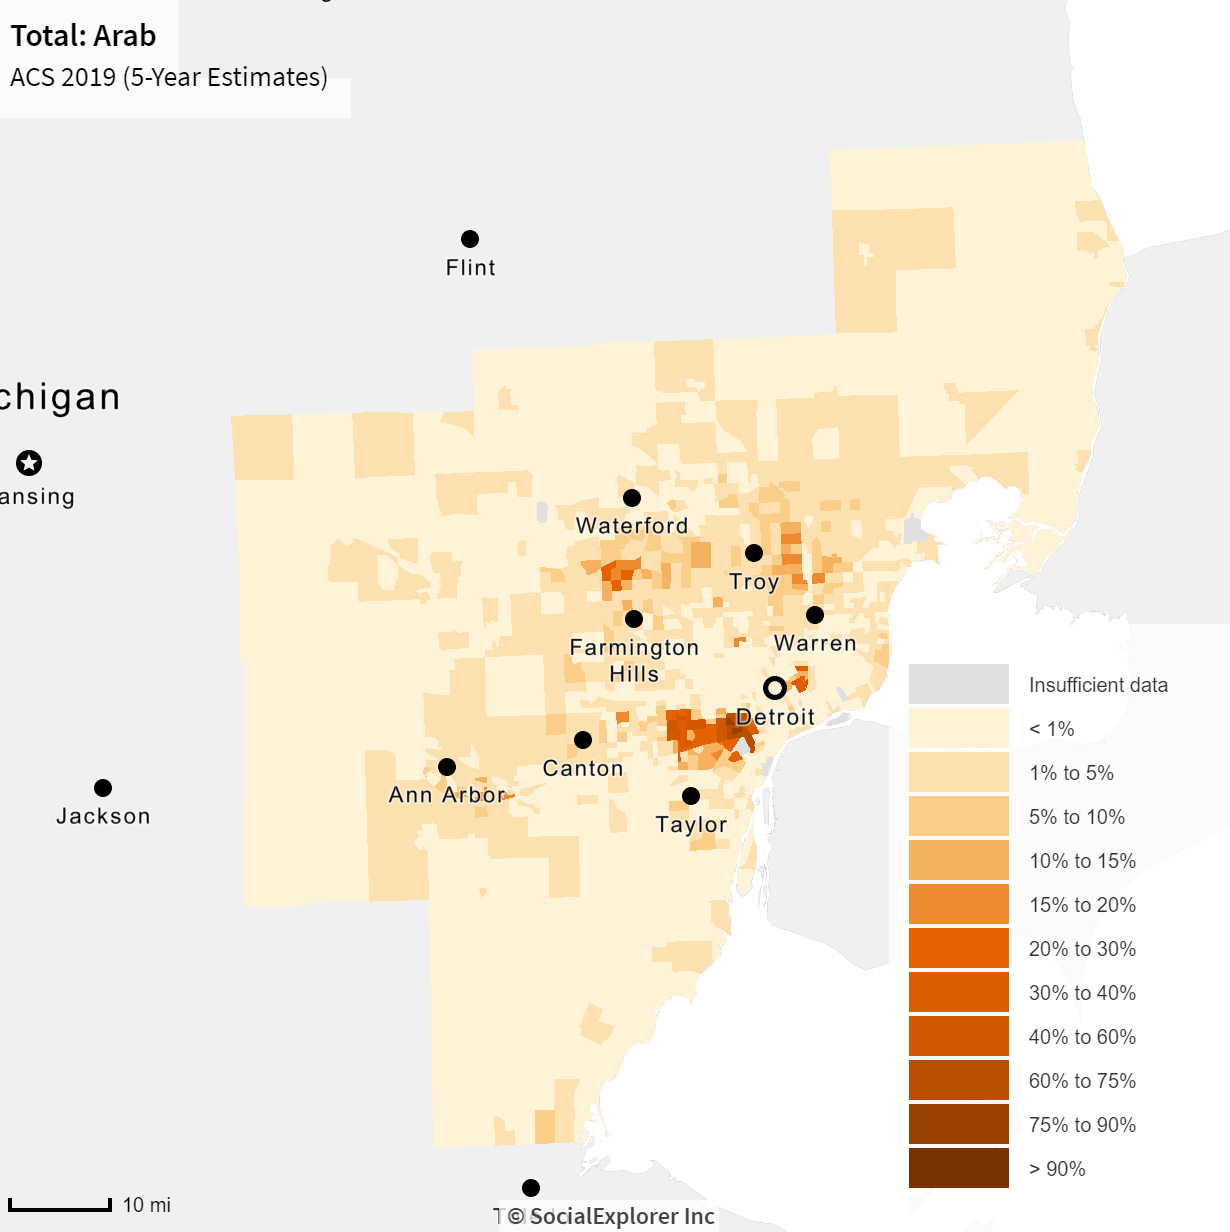
While the Irish are at the top of everyone’s minds this week, much of Michigan’s ancestry is comprised of those with German decent at 19 percent. Additionally, in Southeastern Michigan we have an enclave of those of Arab descent. While those with Arab roots make up 2 percent of Michigan’s population, in Wayne County they make up 6 percent of the population and in Macomb and Oakland counties they make up 3 percent of the populations. When examining the data at the Census Tract level we see that the Dearborn-Dearborn Heights area has between 14-80 percent of the population (depending on the tract) with Arab roots. Other areas with high Arab ancestral roots are Hamtramck (up to 39 percent) and West Bloomfield (up to 25 percent), Bloomfield (up to 13 percent) and Sterling Heights (up to 15 percent).
Understanding a region’s ancestry helps bring historical knowledge on who helped grow the region, a community and even a neighborhood and its culture. As we continue to evolve as a society many of us still try to cling to our ancestral roots, showcasing positive traditions of the past. With migration amongst cities, states and countries being fluid we must also make way for new traditions and take time to understand the cultures of all those around us.
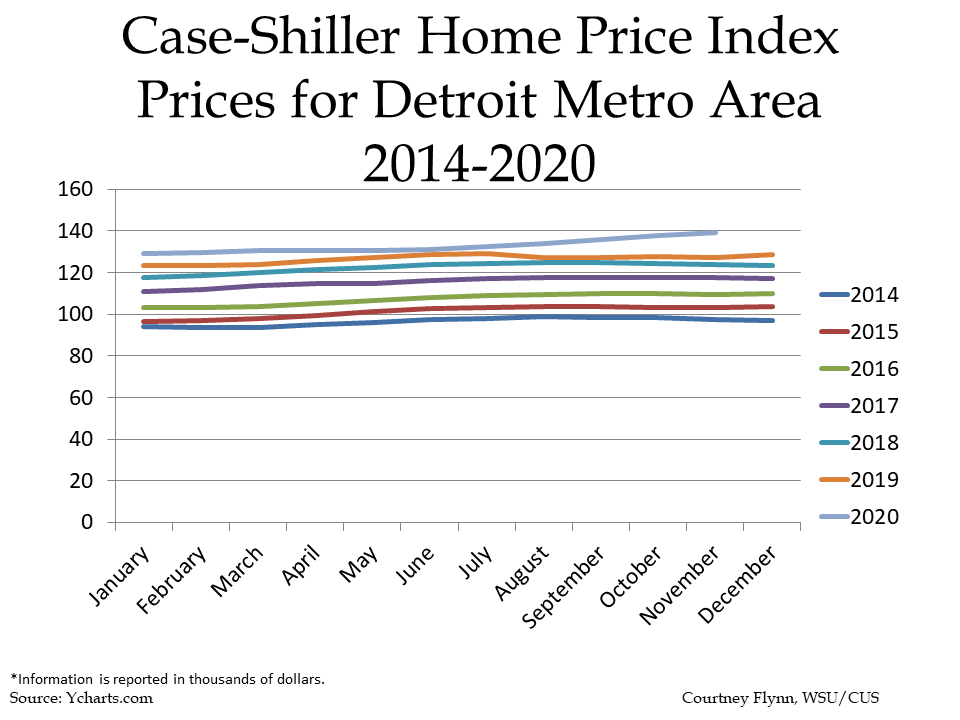
We are a year into the COVID pandemic, unemployment rates have peaked and then declined, but they are still substantially higher than a year ago. Average home prices have increased as demand for homes has increased. Broader consumption trends though, while they are faring better than nearly a year ago, have yet to fully recover to pre-pandemic levels. Below we show just how these various indicators have changed over the last year.
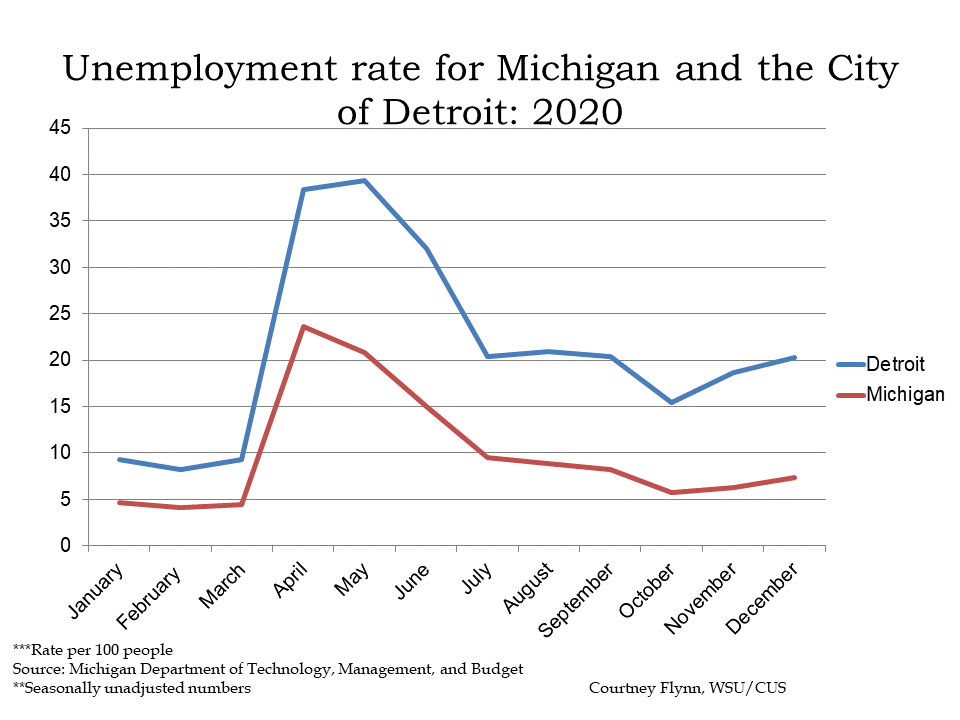
In December of 2020 the unemployment rates for the State of Michigan and for the City of Detroit continued to increase after declines following the initial unemployment spikes due to COVID-19. The State of Michigan reported an unemployment rate of 7.3 in December, a higher rate than what was reported in November, which was 6.3. For the City of Detroit, the unemployment rate for December of 2020 was 20.3, which is higher than the November rate of 18.7. The December unemployment data further highlights how the unemployment gap between the State and Detroit continues to grow wider as the COVID case numbers increased rapidly over the holidays.
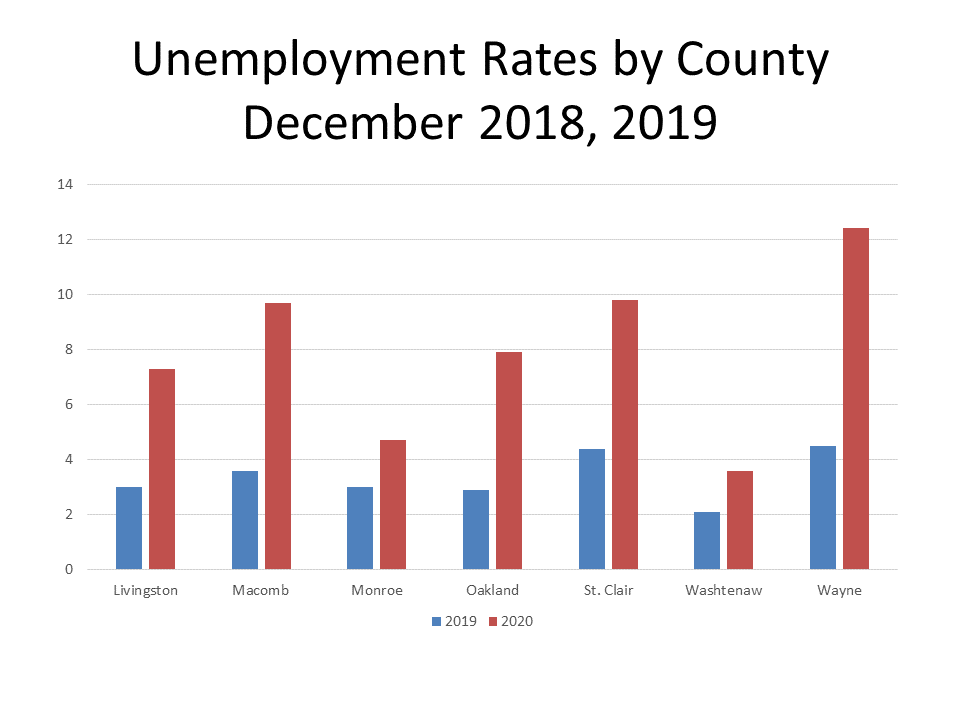
In line with what was reported above, COVID impacted unemployment rates at the county level in Michigan as well. In December of 2020 each county in Southeastern Michigan had a significantly higher unemployment rate than the year prior. According to data from the Michigan Department of Technology, Management and Budget, Wayne County experienced the largest increase at about 8 points. In December of 2020 Wayne County had an unemployment rate of 12.4 and in December of 2019 it was 4.5. Washtenaw County experienced the smallest increase at 1.5 points. In December of 2020 Washtenaw County had an unemployment rate of 3.6 and in December of 2019 it was 2.1. While there were overall unemployment increases, the differences in the unemployment percentages between each county is, at least in part, dependent on the type of jobs available in each county and the occupations of residents. For example, in Wayne County the top occupations are office and administrative support, production and sales and food service. In Washtenaw County the top occupations are office and administrative support, education instruction, health care practitioners and food service workers. Throughout much of the year some positions related to office and administrative support and food service have been considered non-essential or experienced higher layoff rates while those in health care and education have been at less risk of being unemployed.
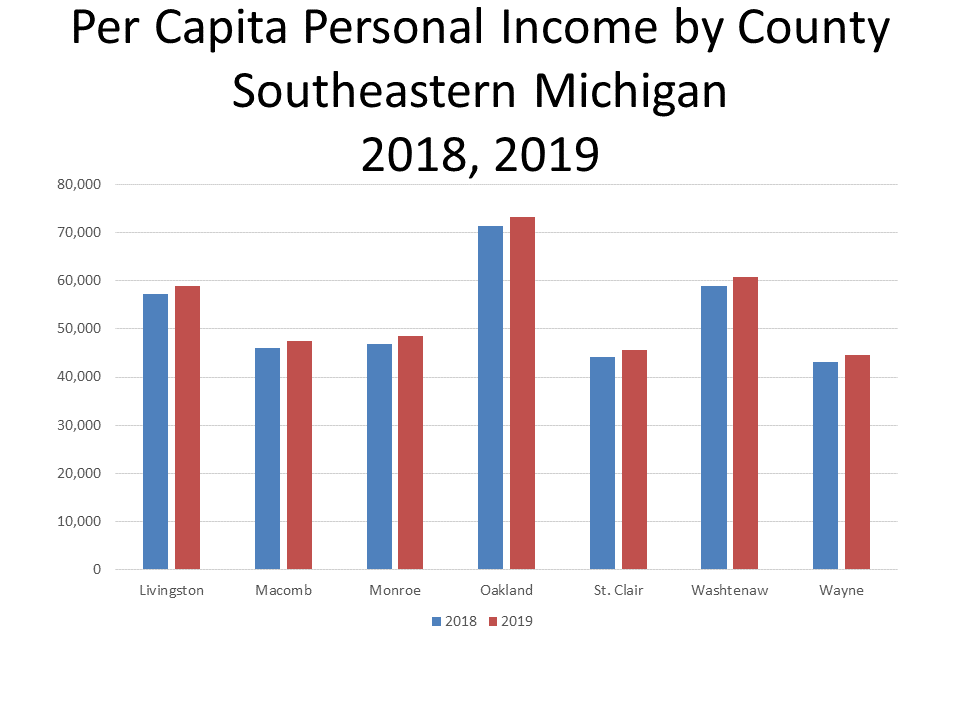
The Bureau of Economic Analysis recently released data on the per capita personal income by county for 2019, showing that overall incomes in Southeastern Michigan did grow between 2018 and 2019. In 2019 Oakland County had the highest per capita personal income at $72,271 but it had the lowest percent change between 2018 and 2019 at 2.7 percent. Wayne County had the lowest per capital personal income at $44,512 with the percent change from the year prior being 3.3 percent. St. Clair County had the lowest percent change in per capita income between 2018 and 2019 and 2.7 percent; its per capita personal income in 2019 was $45,662.
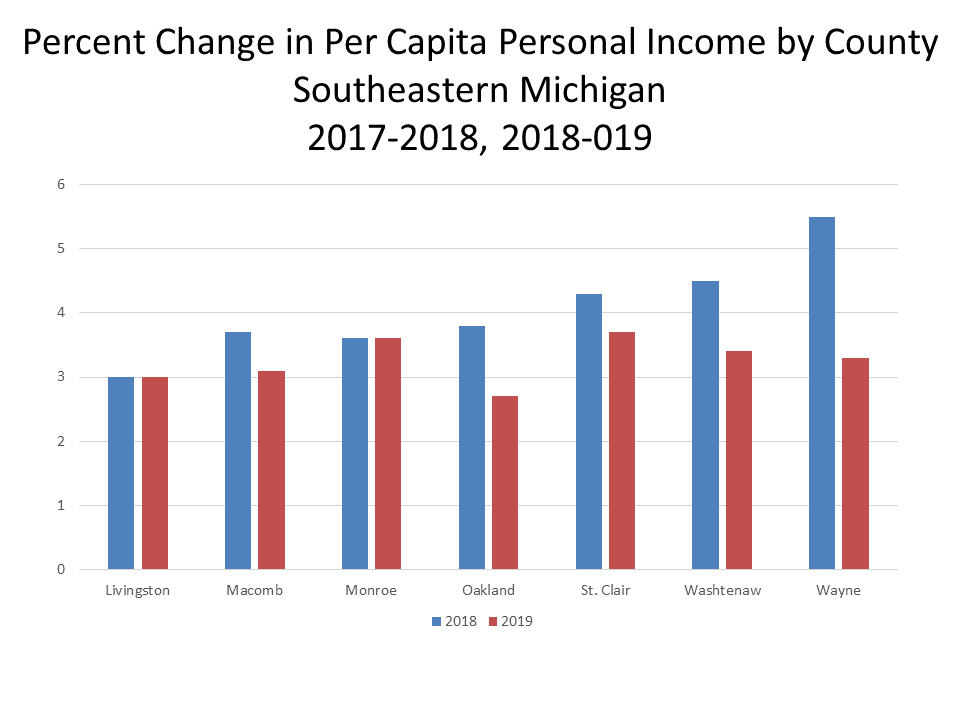
When examining personal income growth between 2017-18 and 2018-19 the percent change was lowest for the most recent year of data, as opposed to the growth from between 2017-18.
We have yet to know what the impact COVID will have on personal income for 2020, but the data below does show that growth was already beginning to slow down prior to the pandemic. That coupled with higher rates of unemployment, business closures and decreases in spending on goods and services may very well mean lower personal incomes for 2020.
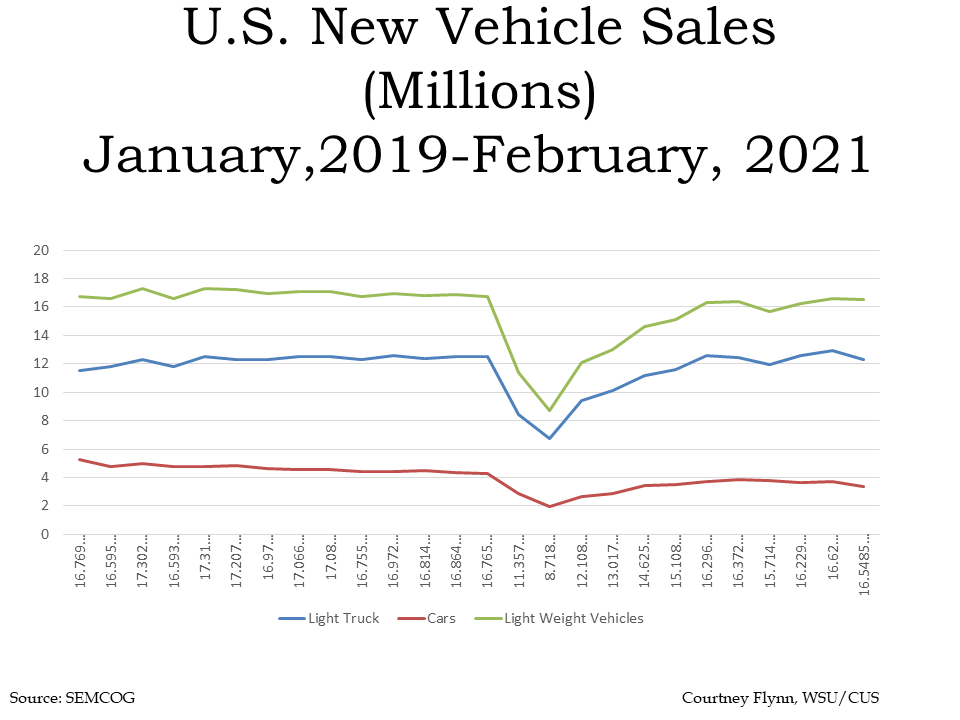
The automobile industry continues to be a driving force in Michigan’s economy and the latest data on vehicle sales show that the number of auto sales for lightweight vehicles has been steadily increasing in recent months while light truck and car sales slightly declined in February of 2021. However, compared to a year ago, sales still remain below what they were. In February of 2021 auto sales for: sales of light weight vehicles were 16.5 million, compared to 16.8 million the year prior; light truck sales were 12.3 million compared to 12.5 million in February of 2020; car sales were 3.4 million, compared to 4.2 million the year prior.
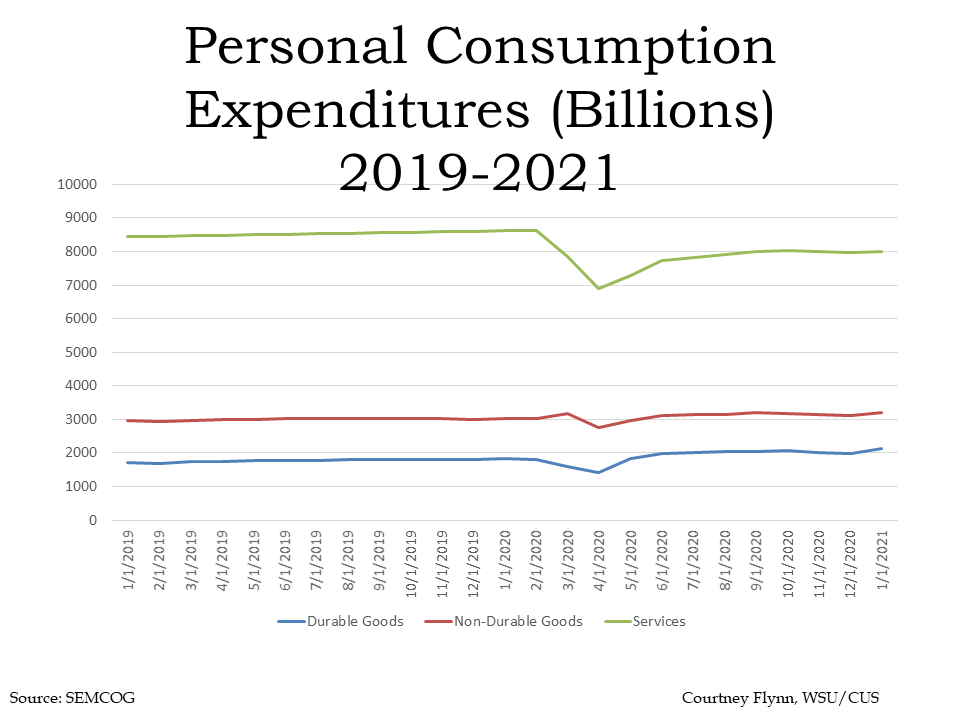
Below shows the consumption expenditures of goods in the U.S. between 2019 and 2021. According to the U.S. Bureau of Economic Analysis, durable goods have an average useful life of at least 3 years (e.g. motor vehicles) while nondurable goods have an average useful life of less than 3 years (e.g. food) and services are commodities that cannot be stored or inventoried and are consumed at the time of purchase (e.g., dining out). The chart below shows how services have yet to make it back to the pre-COVID consumption levels, but the consumption of durable and non-durable goods have risen. In January of 2021 $8,016 billion in services was consumed, $2,148 billion in goods was consumed and $3,206 billion in nondurable goods was consumed.
According to the Case-Shiller Home Price Index, the average price of single-family dwellings sold in Metro Detroit was $139,240 in November of 2020; this was $145 higher than the average family dwelling price in October. The November 2020 price was an increase of $11,770 from November of 2019 and $15,200 from November of 2018. So, just as unemployment rates remain higher than what they were a year ago so do average home prices. This is interesting though because with higher unemployment rates traditionally comes lower incomes and hesitation around the housing market. However, during the COVID-19 pandemic, as shown, the average price for a home has been increasing despite higher unemployment rates. Demand for existing homes has been up substantially across the nation over the last year
In 2019, before COVID, the average American spent 28 minutes commuting to, or from, their job; in Michigan that average was 25 minutes. However, once the pandemic hit many of us began working from home, which directly impacted mobility to and from workplaces and commute times, presumably. According to a Feb. 23, 2021 report from Google, mobility to places of work in the State of Michigan have declined by 29 percent. At a regional level in Southeastern Michigan mobility has declined even more than the state average since last March. According to the data, mobility declined by the following percentages for the seven counties in Southeastern Michigan from the pre-pandemic baseline:
Livingston County: 31 percent
Macomb County: 33 percent
Monroe County: 22 percent
Oakland: 41 percent
St Clair County: 15 percent
Washtenaw County: 49 percent
Wayne County: 35 percent
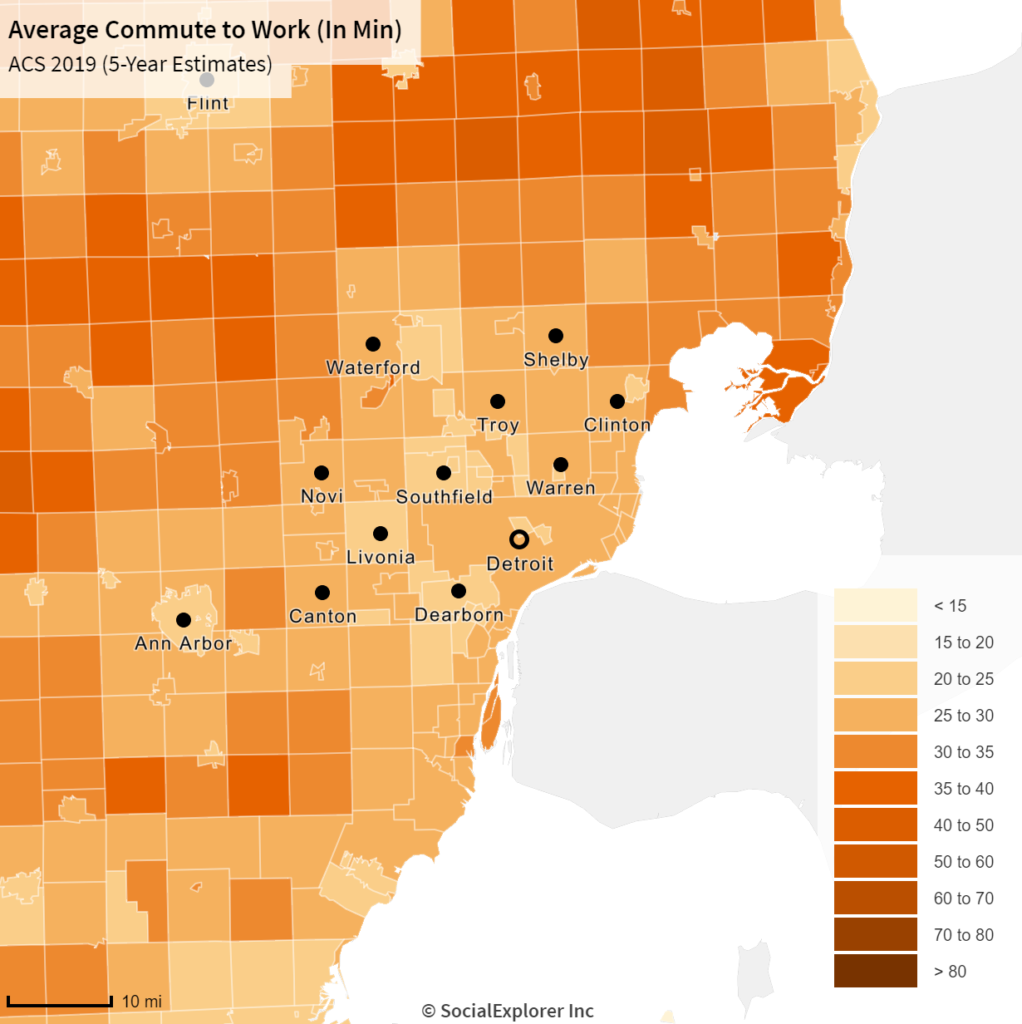
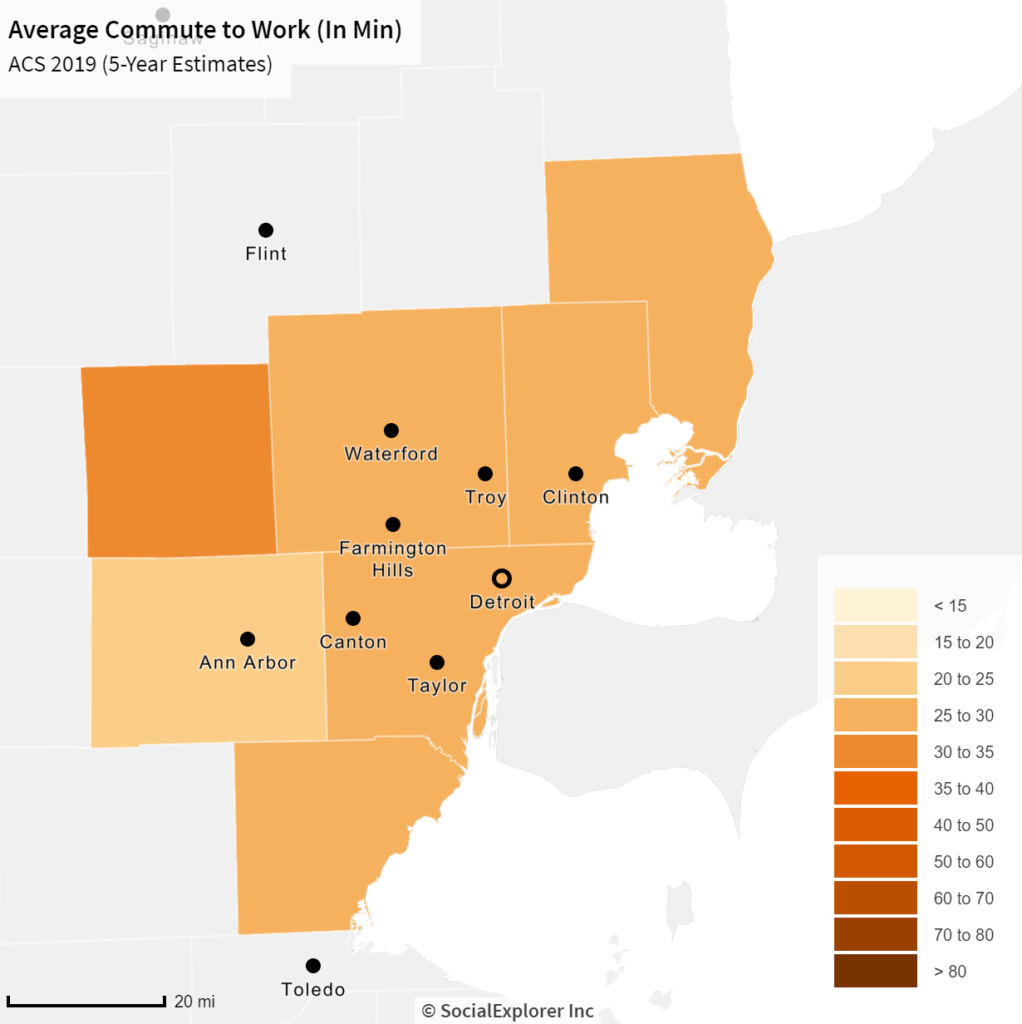
While mobility data differs from commute data, the fact that people are going to work less means commute times will also decline. Below are two maps showing the average work commute times in 2019 at the municipal and county levels.
In 2019, the City of Ann Arbor had the lowest average commute time at 20 minutes, according to the American Community Survey, and Clay Township had the highest average commute time at 37 minutes. At the county level, Washtenaw County (where Ann Arbor is located) had the lowest average commute time at 24 minutes and Livingston County had the highest average commute time at 33 minutes.
When the 2020 commute data is available it will be interesting to see just how many minutes the average commute time declined in Southeastern Michigan, and if that trend lasts for the long-term. Declined commute times and mobility to and from places of work means several things, including less automobile pollution and more time for individuals to participate in leisure activities, perform additional work, do chores or anything else that may be of interest to them.