Region’s child population higher than elderly population

The focus of this post is on the percent of children under the age of 18 in the seven-county region. In 2012, according to the American Community Survey, the average percent of children in the state of Michigan was 23.6 percent. This post shows that the percent of children across the region  is higher than the elderly population in the region. Three of the seven counties in Southeastern Michigan had a lower percentage of children than the state average.

Although children under the age of 18 made up 23.6 percent of the state’s population, there were only four counties in the region at or above this threshold. St. Clair was right at the state average, while three counties were above and three below the state average. The three counties with a higher percentage of children were Livingston (25.3%), Wayne (25.3%), and Monroe (24.0%). Washtenaw County had the lowest percent of children under the age 18 (20.7%).

In last week’s post on the elderly population, St. Clair (14.8%) and Macomb (14.4%) counties had the highest population of residents age 65 and above. Washtenaw County had the lowest elderly population at 10.6 percent.

The above map provides a closer look at how the child population is distributed across the region. Livingston County only has one community that has a lower percentage of children than the state average, however, there are few areas with 800 children or more (it should be noted Livingston County has a much lower population than Macomb, Oakland and Wayne counties). As the yellow dots show, there is a high concentration of children in the City of Detroit and the communities surrounding it, such as Warren, Southfield and Dearborn.

In Washtenaw County, the child population is concentrated in the Ann Arbor area. In Macomb County, which had the second lowest percentage of children in the region, the southern part of the county had a high number of children despite having a lower than state average percentage of children.

The above map provides a look at the child population in the City of Detroit. When comparing this map to the Detroit map in the previous post (link) about the elderly population, it can be seen there are several Census tracts where the elderly population is above the state average but the child population is below. Many of these Census tracts are northwest of Highland Park, around Palmer Park, and in the area between Highland Park and Belle Isle.

St. Clair, Macomb counties have highest percent of elderly population

As our population ages, there are many factors that will need to be considered.  As the Baby Boomers reach retirement age and beyond, there are many issues that will need to be discussed and addressed, from housing surpluses to medical care. In order to address these issues, however, we must first understand the size of the elderly population, ages 65 and older.

In this post, we will examine that population in the seven county region for the year 2012. All data was received from the American Community Survey.  According to this data, an average of 13.9% of all residents in the State of Michigan were age 65 and older.

As the above map shows, St. Clair (14.6%) and Macomb (14.4 %) counties have the highest percent of residents age 65 and older in the region. Washtenaw County, which is home to the University of Michigan, has the lowest percent of elderly in the region at, 10.3 percent. Reportedly, in the City of Detroit, 11.5 percent of the population is aged 65 or older.

This map shows that, overall, a majority of communities in the region had less residents aged 65 and older than the state average of 13.9%. The yellow dots depict concentrations where there are 200 or more residents are age 65 and older. While the City of Detroit is lower than the state average (11.54%),  the size of the population means that there are still a large number of residents within the city limits or nearby who are aging and may need additional services, such as transportation to health facilities and senior activity centers. There are about 20 communities outside of Wayne County, and southern Oakland and Macomb counties, where the percent of residents age 65 or older is above the state average, including areas near the Ohio border and along Lake St. Clair.

This map sheds additional light on Detroit’s elderly population. The yellow dots depict concentrations of 200 people aged 65 or above. While there are dozens of such areas with such a presence of the elderly population, there are four concentrated areas in the city where the elderly population resides, and comprises a higher proportion than the state average. These areas, colored in red, are located in clusters between the city’s border and Highland Park (which also has a significant elderly population), and on the near East side.


Middle school students also show slow progress in MEAP testing

Last week, we examined the MEAP scores for students in grades three through five in the intermediate school districts located within the seven-county region as well as the Detroit Public Schools. This week, we will examine the MEAP scores for students grades six through nine within the same region. As our earlier post showed, progress for students in grades three through five was slow. This week’s post, however, shows more promising results, with the exception of seventh-grade reading and sixth- and ninth-grade social studies.

In St. Clair County, the St. Clair Regional Education Service Agency (RESA)  experienced a decrease in MEAP math scores for sixth- and seventh-grade students from fall 2012 to fall 2013. For the sixth-graders, there was a 2.8 decrease in the percent of students proficient in math, and for the seventh-graders, it was a 0.2 percent decrease.

Overall in the region, the percent of students proficient in math increased the most among sixth-graders. The Oakland ISD had both the highest percent of sixth-graders proficient in math (55%) and the highest percent increase of sixth-graders proficient in math (7.3%). Washtenaw County had the highest percent of seventh- and eighth-graders proficient in math (53.7 and 53.9%, respectively) while Detroit Public Schools had the lowest percent proficient across all three grade levels (6th: 14.8%, 7th: 11.8%, 8th: 12.2%).

The eighth-grade map is currently not available; please check back soon. 

As can be seen by one of the maps above, seventh-graders across the seven-county region struggled to increase their reading proficiency as not one ISD or DPS experienced an increase in the percent of proficient students. The Monroe ISD experienced the largest decrease among seventh-graders from fall 2012 to fall 2013 at 4.9 percent. It was DPS, though, that had the lowest percent of students proficient in seventh grade reading, 29.1 percent. Even though there were decreases in proficiency across the region, some ISDs, like Livingston and Washtenaw, did have more than 70 percent of their students prove to be proficient on the test (74.2 and 70.9 percent, respectively).

Except for Wayne County and DPS, all the other ISDs in the region had more than 70 percent of their sixth- and eighth-graders test as proficient in reading, and post an increase from the prior year. For the sixth grade, the Livingston ISD had the highest percent of students proficient in reading (84.5%) while the Monroe ISD had the highest increase from the year prior (5.4%). For the eighth-graders, the Washtenaw ISD (82.8%) had the highest percent of students proficient in reading while the St. Clair RESA (8.3%) had the largest increase.

As the maps show, only one ISD and DPS posted an increase in the percent of students proficient in social studies from fall 2012 to fall 2013. For the sixth-graders, DPS had a 6 percent increase in the percent of students proficient in social studies. However, DPS still had the lowest percent of students proficient, 14.8 percent. The Livingston ISD (42.5%) had the highest percent of sixth-graders proficient in social studies and the Macomb ISD (4.5%) experienced the largest decrease.

For the ninth-grade social studies MEAP exam, only the Washtenaw ISD experienced an increase in the percent of students proficient (0.4 percent); it also had the highest percent of students proficient (43.4%). The Monroe ISD experienced the largest decrease from fall 2012 to fall 2013 (7.8%), though it should be noted that the specific numbers for DPS could not be reported, according to the Michigan Department of Education, because less than 10 percent of students in the ninth grade were proficient on their social studies MEAP exam.

All ISDs and DPS in the region showed an increase in the percent of students proficient on the eighth-grade science test. The St. Clair RESA had the highest percent increase from fall 2012 to fall 2013 (8.3%) and Washtenaw ISD had the highest percent of eighth-graders proficient (30.3%). DPS had fewer than 10 percent of its eight-graders test proficient on the science exam last fall.

Progress and problems with education scores for children in Southeast Michigan

Currently, the Michigan Legislature is considering moving the oversight of the Michigan Education Assessment Program (MEAP) testing from the Michigan Department of Education (MDE) to the Treasury Department through House Bill 5581 and Senate Bill 0945. This suggested move, as proposed by Rep. Bob Genetski (R-Saugatuck), is so a “more responsive” department can control the state’s performance testing mechanism. The lack of responsiveness Genetskialleges refers to the decision by MDE to cease using the MEAP test as the MDE’s standardized test. Rather, the MDE plans to implement the Smarter Balance Assessment, standardized tests based on the Common Core Standards. The math and language arts portions of the MEAP test were no longer supposed to be given after this past fall. The upcoming state school aid budget, however, could require schools to use MEAP tests to receive funding, if the bills pass. While the Senate bill passed, House Republicans have not passed their version as yet.

Despite this ongoing debate, the MEAP has recently indicated some progress. Here we  MEAP results from the 2013-14 school year.

In this post, we examine the MEAP results for third, fourth and fifth graders. Overall, these maps show there has been a decline in MEAP scores in at least one county at each grade level for each subject tested for, with one exception. The science scores for fifth-graders saw an increase across the seven county region this past school year. In each case we present the scores for the Intermediate School District in the county, which represents the aggregate scores for the students across the county. In addition, we present scores for Detroit Public Schools (DPS).

Slide03

Slide04

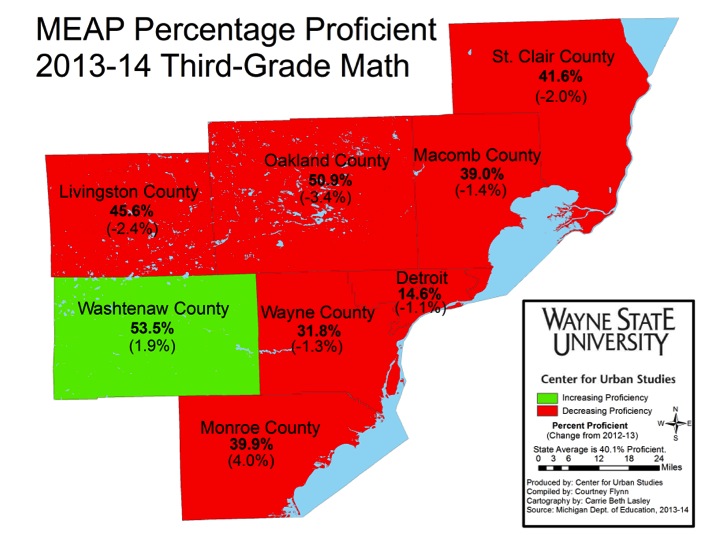
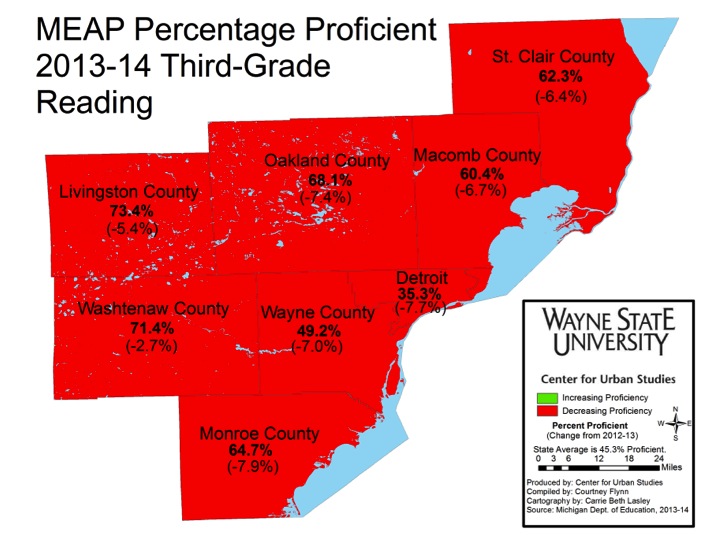
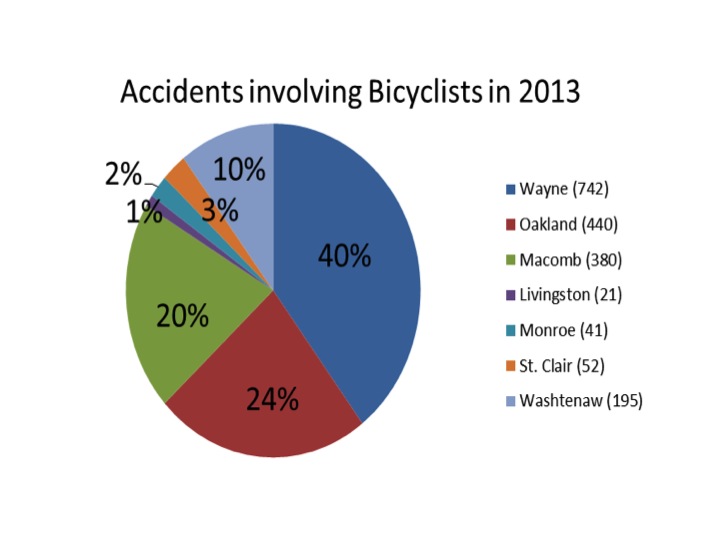
Of the three grades examined in this post, third-graders experienced the least growth in MEAP proficiency from the fall 2012 to fall 2013. In math, the Washtenaw Intermediate School District (ISD) was the only one in the region to experience growth (1.3 percent). In Monroe County, the Monroe ISD had the largest decline in the percent of students proficient in math from 2012 to 2013 (4 percent), but it was Wayne County’s Regional Education Service Agency (RESA) that had the lowest percent of students proficient in math (31 percent), of the counties. The Detroit Public Schools had the lowest percent of students proficient in third grade math (14.6 percent) and third grade reading (35.3 percent).

No county in the region had an increase in the percentage of students proficient in third grade reading between fall 2012 and fall 2013. Again, the public schools in Monroe County experienced the largest decrease in the percent proficient (7.9 percent) but Wayne RESA had the lowest percent of third-grade students proficient in reading (49.2 percent).

Slide06Slide07Slide08

There were four ISDs (Livingston, Oakland, Washtenaw and Wayne), along with Detroit Public Schools, that had a decrease in the percent of fourth-graders proficient in math.  Of those, Livingston ISD had the largest decrease (3.3 percent) but it also had the highest percent of students proficient in math (59.6 percent) in the region.

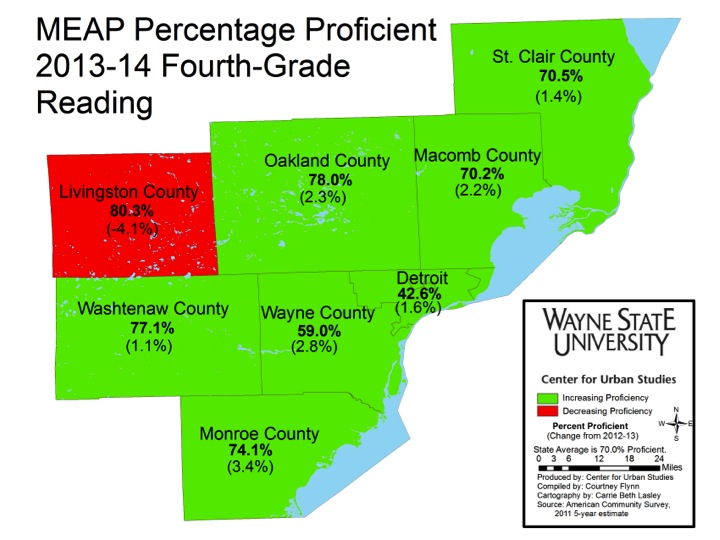
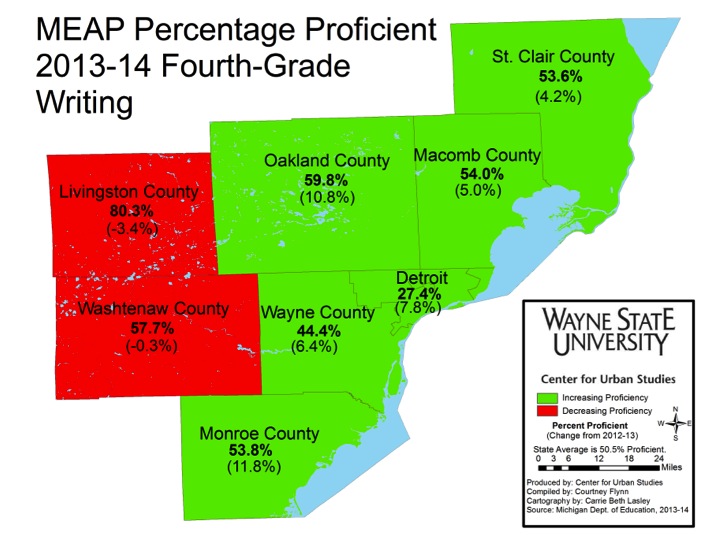
All intermediate school districts, and the public schools in the City of Detroit, experienced an increase in the percent proficient in reading, with the exception of the intermediate school district in Livingston County. Livingston ISD experienced a 4.1 percent decrease. Even with the decrease, the Livingston ISD had the region’s highest percentage of students proficient in reading (80.3%), as well as in math (59.6%) and writing (80.3%). The Monroe ISD had the largest percent increase of third-graders proficient in all three subjects.

Similar to the percent changes of students proficient in math, the Livingston ISD also had the largest decrease in fourth-graders proficient in science (3.3 percent) but the highest percent of students proficient in the subject (80.3 percent). In terms of overall percent increase, Monroe County had the largest (11.8 percent)

Slide10Slide11Slide12

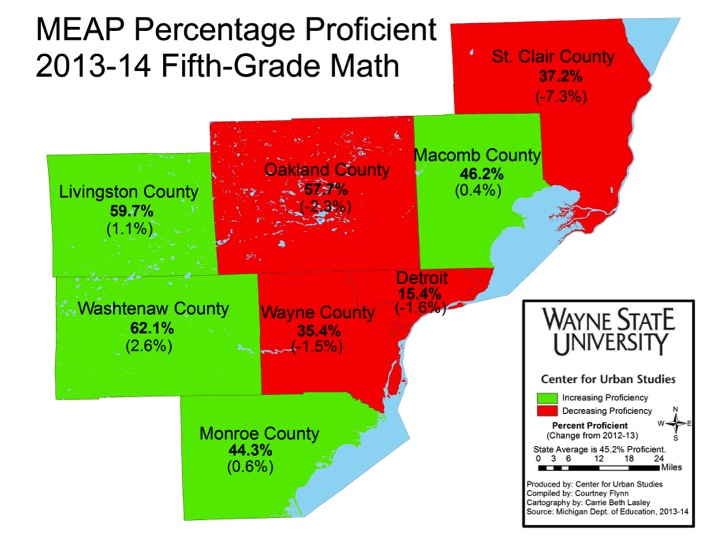
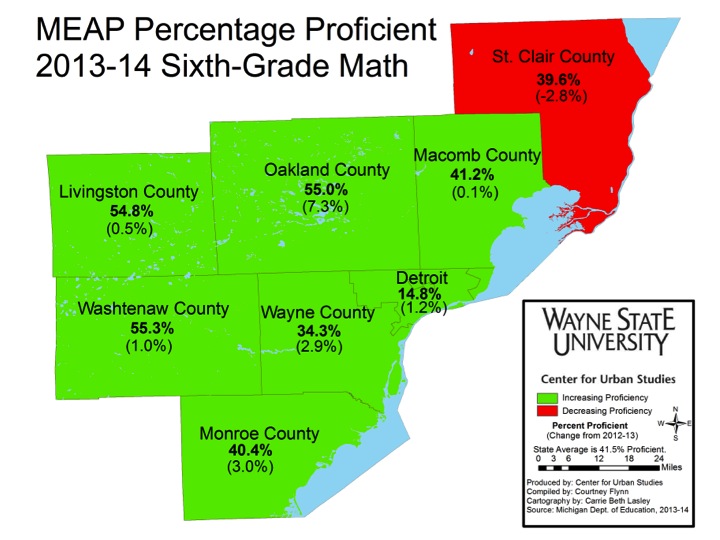
From fall 2012 to fall 2013, there was a decrease in the percent of students proficient in both math from fall 2012 to fall 2013  for the St. Clair RESA and DPS. St. Clair RESA had the largest decrease in students proficient from fall 2012 to fall 2013 (7.3 percent). Wayne and Oakland intermediate school districts, along with Detroit Public Schools also experienced a decrease.

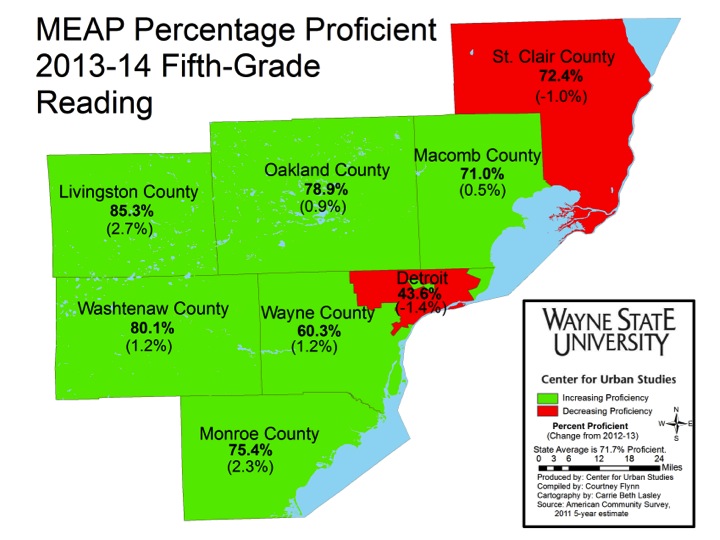
For reading, the St. Clair RESA experienced a 1 percent decrease, which was the largest decrease of the counties. The Detroit Public Schools experienced a 1.4 percent decrease in the percent of fifth-graders proficient in reading though.  Overall, Livingston ISD had the highest increase in the percent students proficient in reading (2.7 percent) and the highest percentage of students proficient (85.3 percent).

For fifth-grade students in the region, all intermediate school districts experienced an increase in the percent of students proficient in science; the intermediate school districts in St. Clair and Washtenaw counties had the largest percent increase (4.8 percent). The Washtenaw ISD also had the highest percent of students proficient in science (24.7 percent).

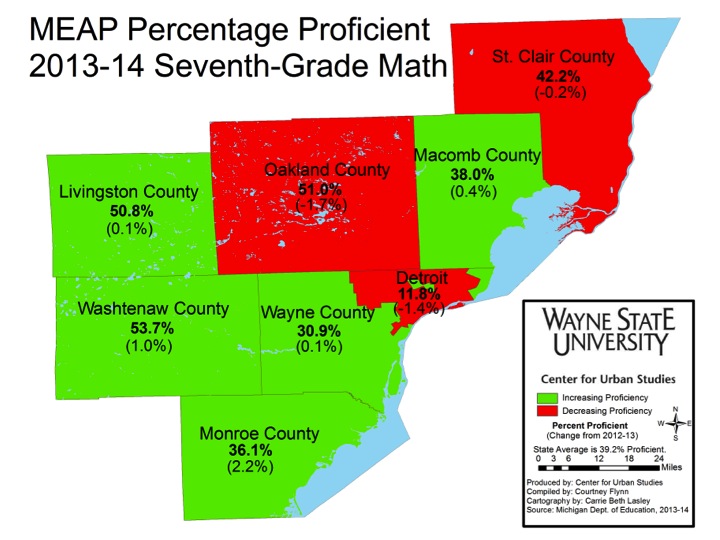
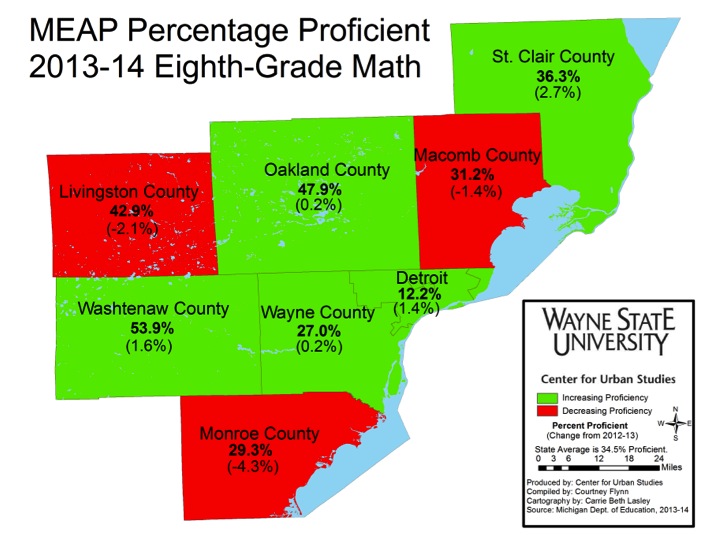
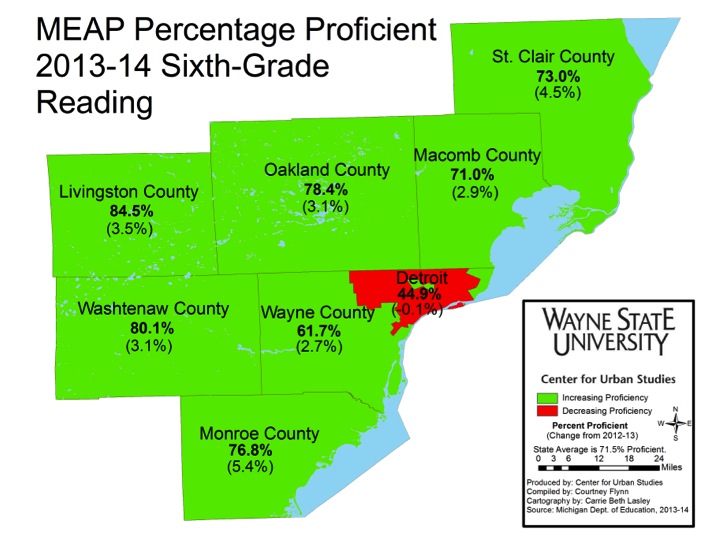
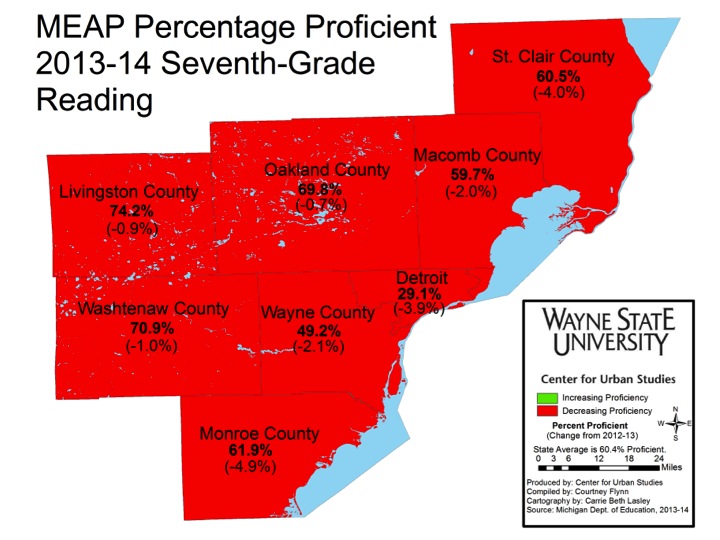
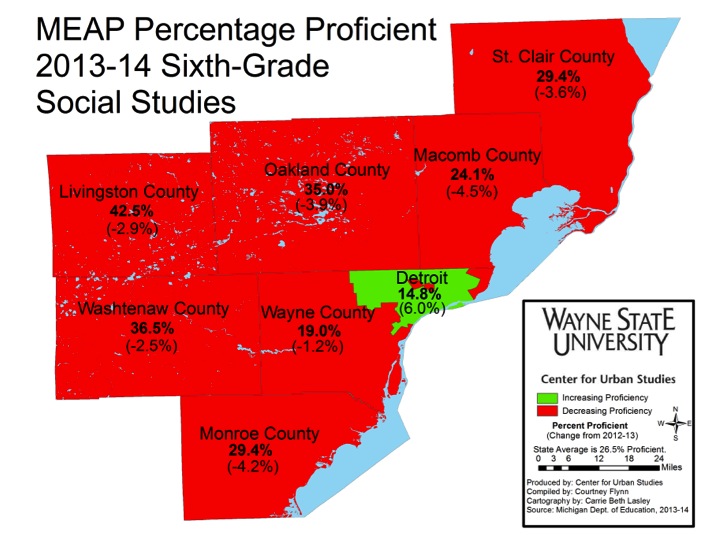
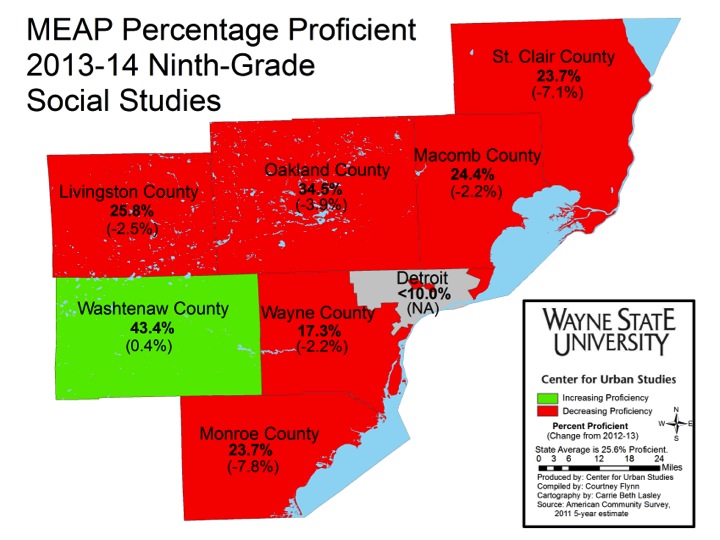
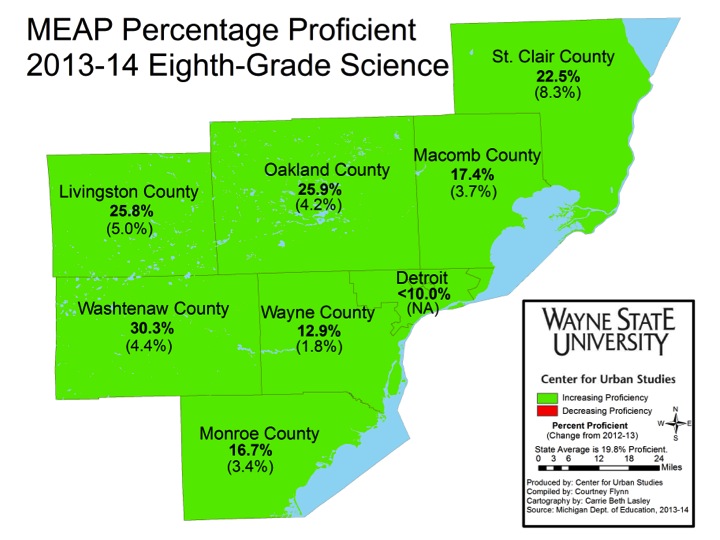
Next week we will examine the MEAP scores for sixth through ninth graders in the region.

Bike Accident Data Show Need for More Protection

In 2013, there were 1,871 traffic accidents reported to the police that involved a bicycle in the seven counties that comprise Southeast Michigan. Here, the locations of these accidents are overlaid with previously displayed data about bicycle ridership rates for commuting that was reported to the Census Bureau. There is some overlap  between high bicycle commuting and accidents, particularly in Royal Oak and Ann Arbor, but accidents are widely distributed across the populated areas of the metro area.

Slide3

More accidents (40 percent) were in Wayne County than in the Southeast Michigan suburban counties. Wayne County and Detroit have a larger number of bicyclists on the road than many of the other locations in the region. Nearly a third (33.1 percent) of the Wayne County accidents took place in Detroit. Ann Arbor, in Washtenaw County, also has a large biking community. It was the site of two thirds of the accidents in the county; overall these accidents were 10 percent of the region’s total. Oakland and Macomb counties had the majority of their accidents in the areas of their counties that were closest to Detroit, while Monroe, Livingston and St. Clair counties experienced most of their bicycle accidents in their larger communities.

Slide5


There was an increase in bicycle accidents when the weather was warmest. Just less than a third (31 percent) occurred in July and August combined. There was a decrease in accidents on weekends (average=211) vs. weekdays (average=290).

Our second map displays the same accident information, but does so by creating a “heat map” that displays the data by increasing the hue where there is a higher concentration of accidents. This map demonstrates that areas with a high number of cyclists, such as Ann Arbor and Midtown Detroit, have higher rates of accidents, which is shown in the yellow and red hues on the map. The map also highlights a second set of areas where there are a high number of accidents. It shows that some of the Suburban areas just outside Detroit are dangerous places for bikers to navigate safely – areas such as Ferndale and Eastpointe.

Slide7

The third map shows Detroit and its immediate vicinity, allowing us to look more closely at the pattern of accidents. With the addition of information about state-regulated roads, we can see that major thoroughfares create safety hazards for cyclists, and these corridors are particularly problematic in the suburbs. The corridors of Woodward Avenue, Mound Road, Gratiot Avenue, Grand River Avenue, Telegraph Road, 8 Mile Road , Ford Road, Michigan Avenue and Fort Street each have accident clusters just beyond the Detroit city limits. The same pattern of accidents along thoroughfares is evident in Detroit proper. Again, we see that areas that connect two biking communities provide high hazards. Woodward and Grand Boulevard, which connect high-biking areas of Highland Park and Hamtramck to high-biking Midtown provides one example, but there are other areas throughout the city and its near suburbs that follow this pattern. These patterns indicate a need for cycling infrastructure that connect locations to improve safety and increase cycling.

Slide9