Secondary Sources of Particle Pollution Affect Southeastern Michigan, Even After the Wildfire Smoke Clears

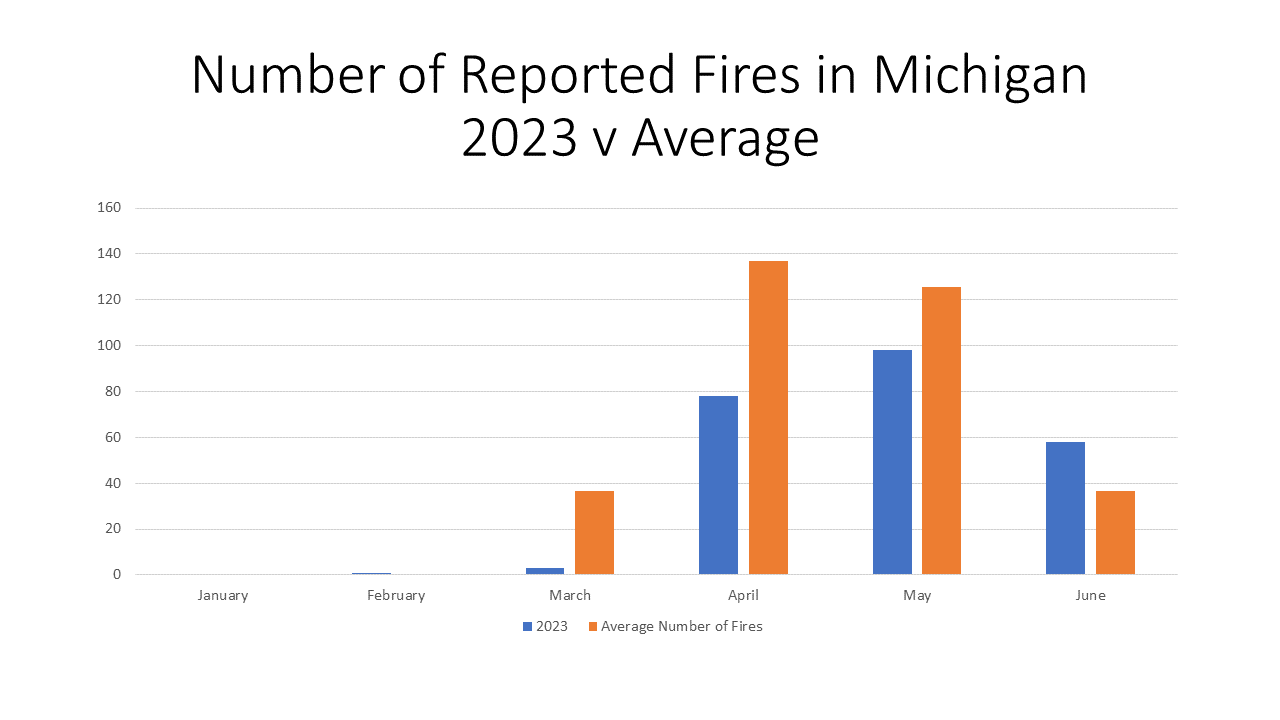
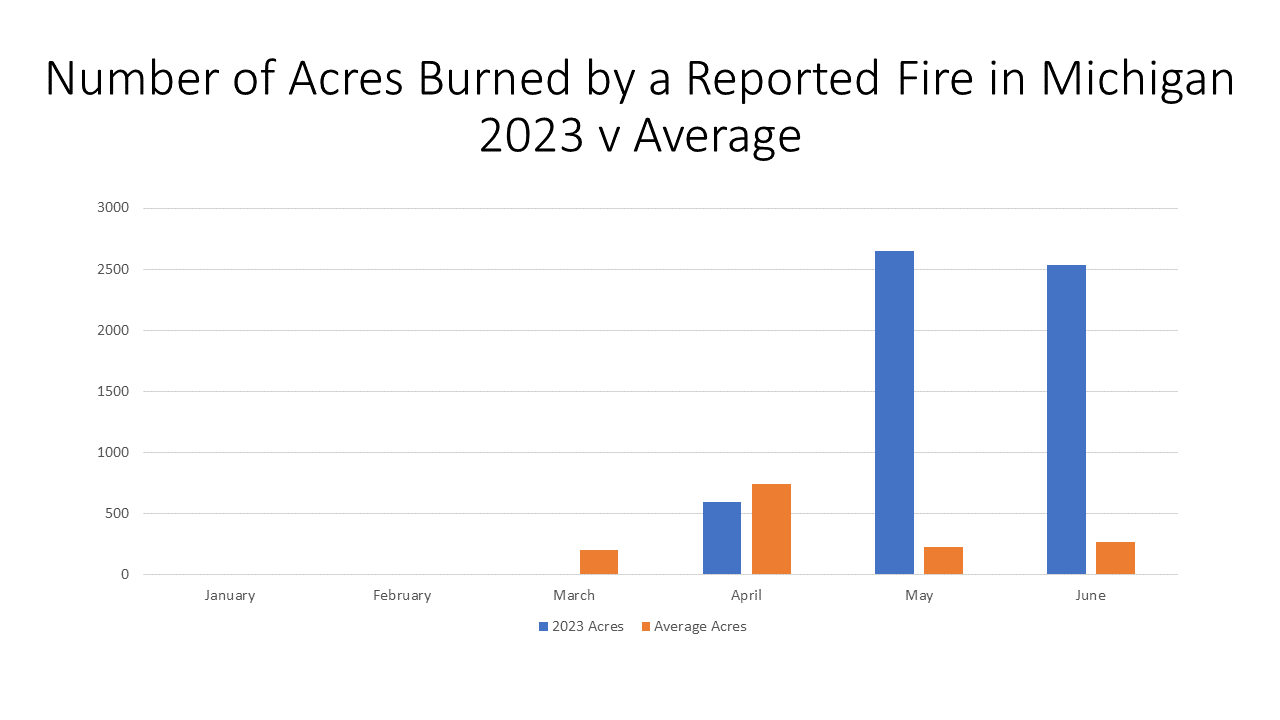
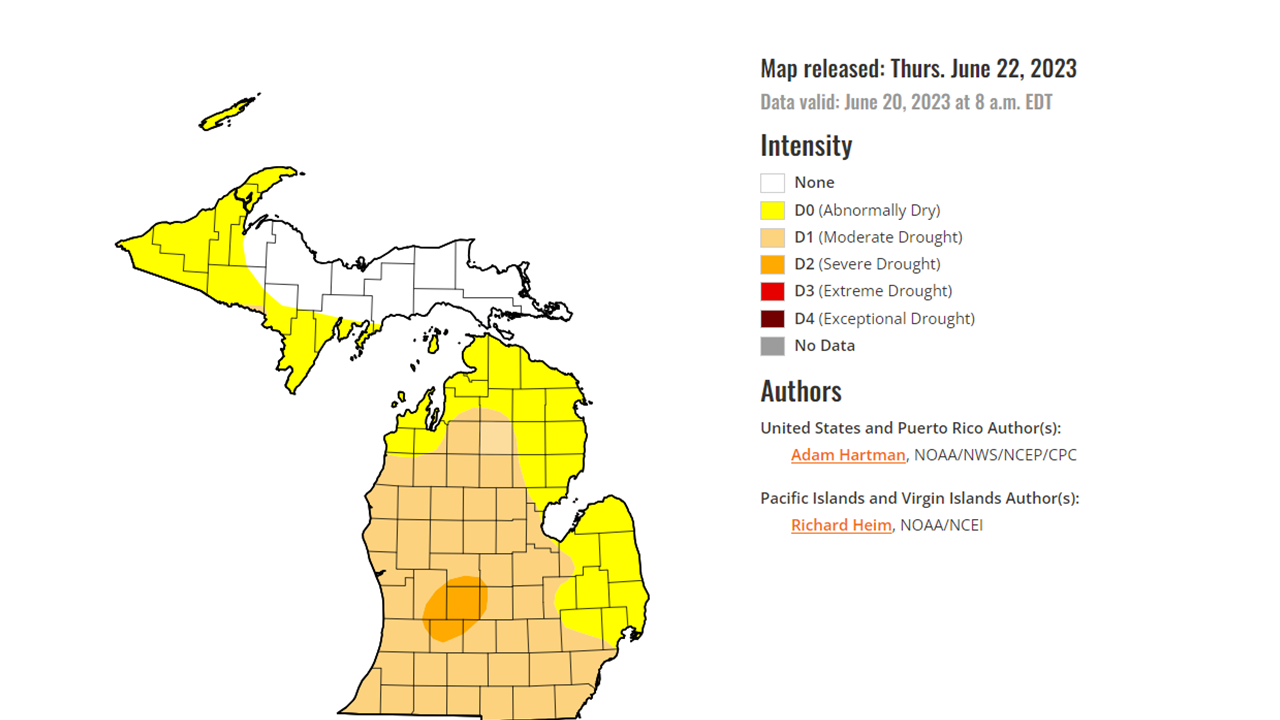
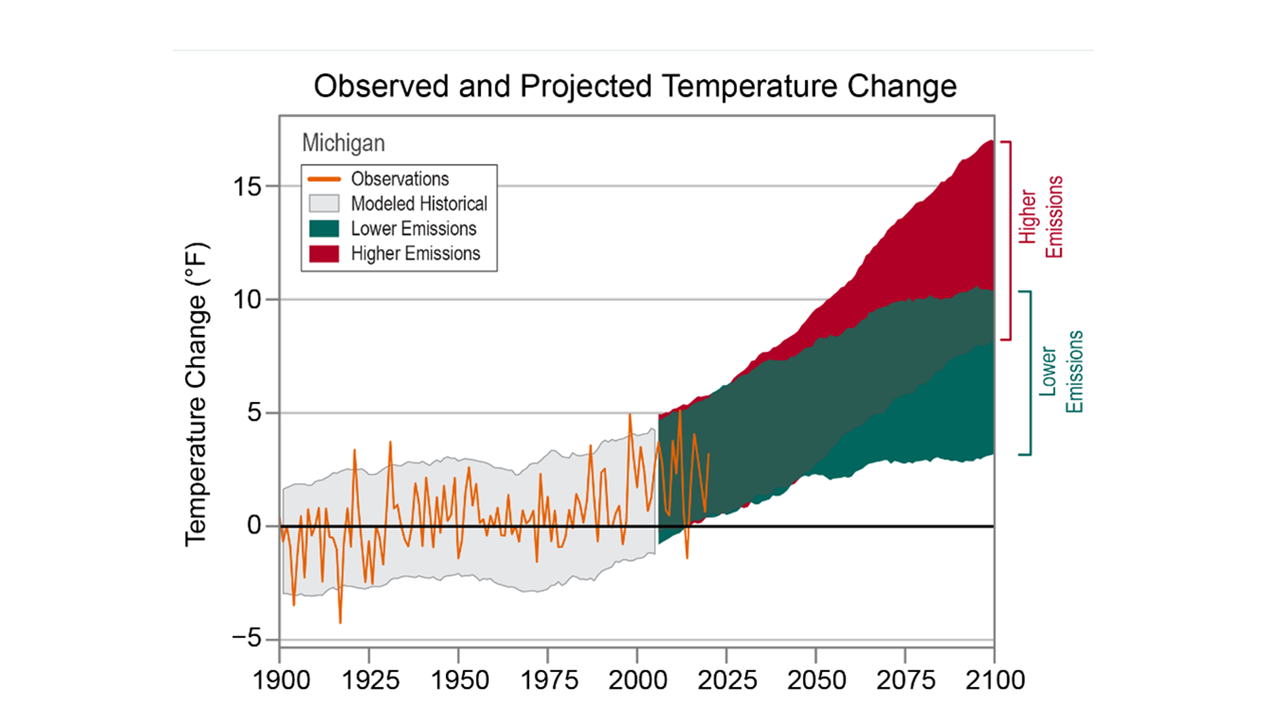
Michigan’s air quality has received a great amount of attention over the last several months. With wildfires still burning and winds bringing smoke into Southeastern Michigan, the region has had more than a dozen Ozone Action days. This increase in Ozone Action days has brought about increased attention to what poor air quality means for our health and what is causing the poor air quality. Smoke caused by increased temperatures and drought has caused wildfires in northern Michigan and Canada; the drought and increased temperatures are direct results of climate change. Climate change is caused by various factors, many of which are related to pollutants.

In this post we will further examine the air quality of Southeast Michigan and some of the factors behind it, particularly some of the region’s biggest polluters.

Of the seven counties in Southeast Michigan, three received an “F” grade for air quality from the American Lung Association in the 2023 State of the Air Report, and the other two that had enough information to be graded did not receive higher than a “C” grade.  These grades are based on the number of high ozone days in each county and the change in particle pollution from day-to-day and year-to-year.

Wayne, St. Clair and Macomb counties all received “F” grades for air quality in the 2023 State of the Air Report, with Wayne County have 11 “Orange Days” in 2022, St. Clair County having 10 and Macomb County having 16 “Orange Days.” According to the American Lung Association, when a county has an “Orange Day” that day is deemed “unhealthy for sensitive groups.” Additional colors in this ranking index include red for “unhealthy,” purple for “very unhealthy,” and maroon for “hazardous.” Benzie and Mason counties were the only two in Michigan to have red days.

Furthermore, according the American Lung Society’s State of the Air Report, the Detroit area was ranked the twelfth most polluted for year-round particle pollution.

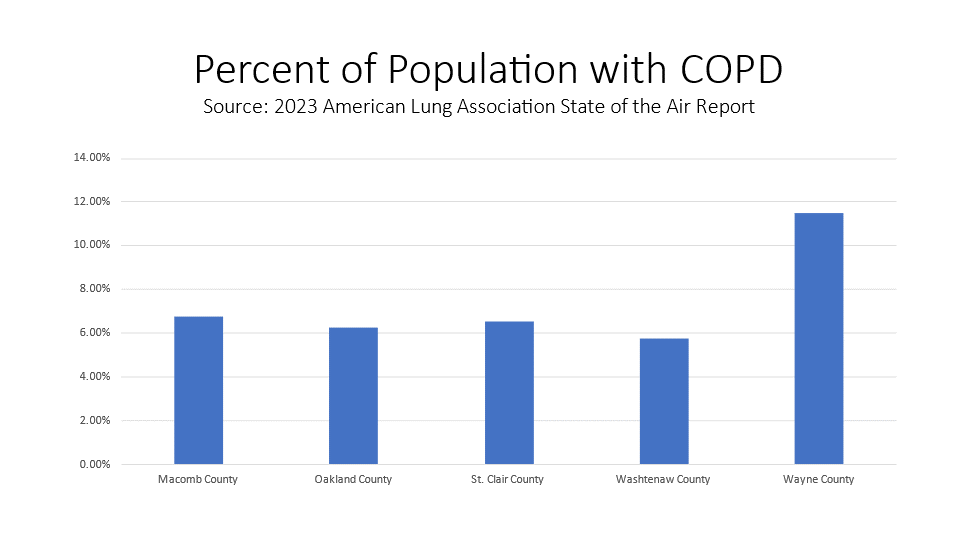
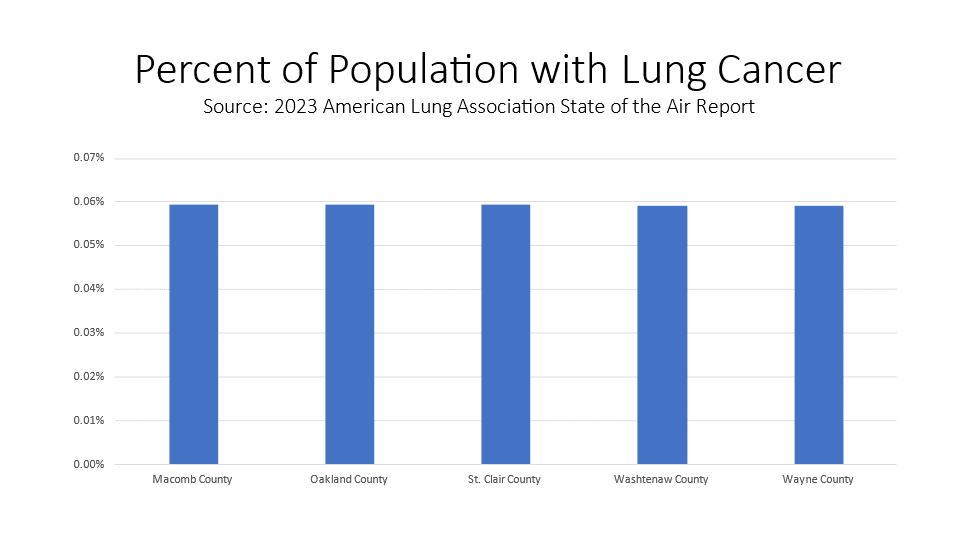
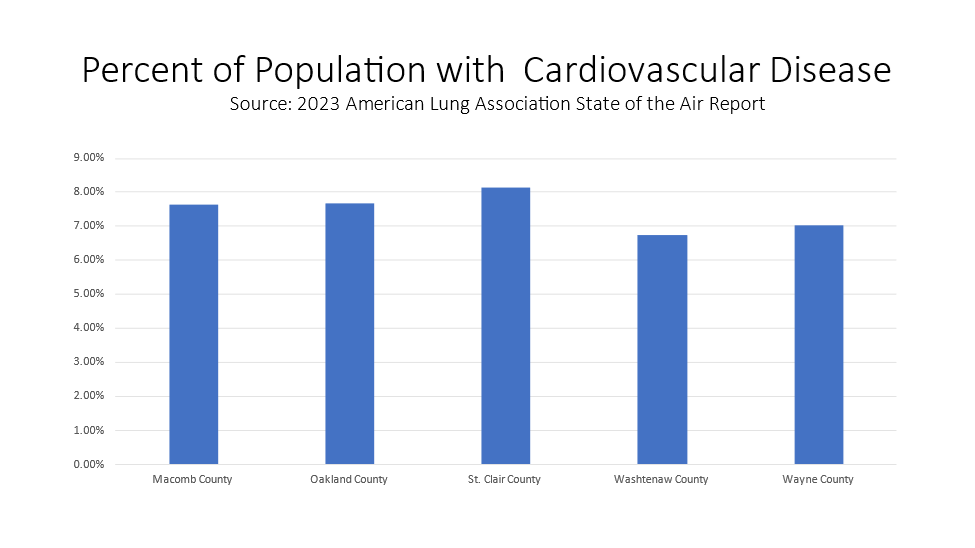
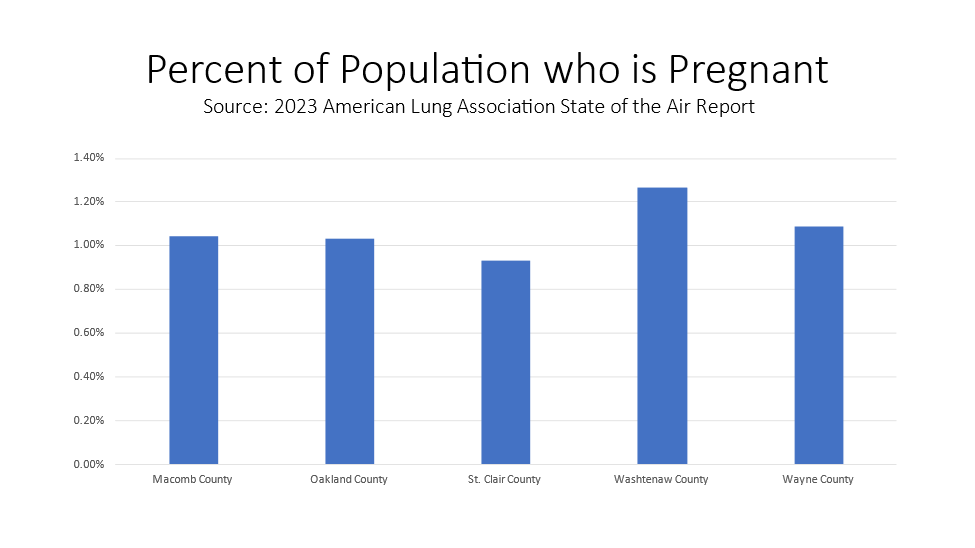
Particle pollution is of serious concern because it negatively impacts individuals’ health, causing respiratory and cardiovascular problems and even premature death. According to the Centers for Disease Control, there are two sources of particle pollution, primary and secondary sources. Primary sources cause particle pollution on their own; wood stoves and forest fires are primary sources. Secondary sources let off gases that can form particles. These sources include power plants, factories, construction sites, vehicles and coal fires.

In Southeast Michigan there are several secondary particle pollution sources that have a negative impact on the area’s air quality. According to climatetrace.org, a global non-profit organization that independently traces greenhouse gas emissions, some of the area’s highest emitters are an oil refinery, two steel plants, an airport and a powerplant. These emitters are:

Marathon Petroleum CO Detroit:

Ranked 378/80,188 Worldwide: for Carbon Dioxide emissions (CO2E)

Cleveland-Cliffs Dearborn Steel Plant

Ranked 296/80,188: for Carbon Dioxide emissions (CO2E)

Detroit Metropolitan Wayne County Airport

Ranked 917/80,188 for Carbon Dioxide emissions (CO2E)

Gerdau Monroe Steel Plant

Ranked 1,450/80,188 for Carbon Dioxide emissions (CO2E)

Monroe Michigan Power Plant (DTE)

Ranked 37/80,188 for Carbon Dioxide emissions (CO2E)

These rankings and the acknowledgement of these assets on the Climate Trace map use data from 2021.

Other secondary sources that contribute to particle pollutants in the Metro-Detroit are the highways, the Ambassador Bridge and, most recently, Stellantis manufacturing plants in Warren and Detroit. Over the last several months, Stellantis has been fined over $500,000 for violating emission standards, according to Crains Detroit. Now, instead of trying to cut back on the emissions, Stellantis has submitted applications to the Michigan Department of Environment, Great Lakes and Energy to raise emission levels of volatile organic compounds and particulate matter at the Warren Plant and to raise the amount of permitted particulate emissions at the Detroit Plant.

It remains unknown what the State of Michigan will do with Stellantis’ requests, but the State and the federal government both need to enforce stricter emission standards, both the benefit of the environment and the population. Higher accountability standards are needed, as are means to produce power and products in ways that do not create greenhouse gases.


Various Populations At-Risk By Continued Poor Air Quality in Michigan

Ozone action season is upon us here in Southeast Michigan; it began March 1 and continues through the end of September. Ozone Action Days are declared when hot temperatures are expected to combine with pollution, creating high amounts of ground-level ozone. Ground level ozone, especially in excess, can cause a human health threat, particularly to vulnerable population. These vulnerable populations include children, those 65 years of age or older, those with asthma, COPD, cardiovascular disease, lung cancer and those who are pregnant.

In 2022 in Southeast Michigan there were five Ozone Action Days, according to the Southeast Michigan Council of Governments, or days when the public is asked to do less strenuous activities and to reduce the ways in which they may contribute to air pollution. While we were certainly hoping for zero Ozone Action Days in 2023, we have already had 14, due in large part to the smoke that has drifted to Southeast Michigan from the Canadian and Northern Michigan wildfires. The most recent Ozone Action Day in Southeast Michigan was declared on July 5, 2023 and the first of the season was declared on April 15, 2023.

With nearly triple the number of Ozone Action Days in 2023 compared to 2022, concerns of air quality remain a constant worry throughout Michigan, as does the population’s health, particularly our most vulnerable populations’. Each year the American Lung Association releases a State of the Air Report that examines air quality at the county, state and national levels and how it impacts certain populations. For the 2023 State of the Air Report, The American Lung Association had data on the vulnerable populations of Macomb, Oakland, St. Clair, Washtenaw and Wayne counties.

As the data shows, children (those under the age of 18) are the category with the highest percentage of individuals at risk. Of the five counties with such data available from the American Lung Association, between 18 and 24 percent of the populations are children, with Wayne County having the highest percentage and Washtenaw County having the lowest percent. The category of those 65 years of age or above had the second highest percentage of individuals at risk, with between 15 (Washtenaw County) and 19 percent (St. Clair County) of the population being at risk of health complications from high ground ozone levels.

Of the diseases/conditions that can contribute to health problems during Ozone Action Days, adult asthma was the most common among the counties in Southeast Michigan (between 9-10 percent of the populations in the counties had adult asthma). Of the child population in the region, each of the five counties discussed in this post had 7 percent of that population with childhood asthma.

For COPD, less than 7 percent of the populations in Macomb, Oakland, St. Clair, Washtenaw and Wayne counties had the disease, except for Wayne County where the American Lung Association reported 11.5 percent of the population had COPD.  Heart disease, lung cancer and being pregnant also cause increased health risks during high ozone days, and of those three categories heart disease had the highest percentage of individuals who could be impacted.

While we can’t control how and when wildfire smoke will drift through our region there are actions we can take to help lower the amount of particles in the air, in general, and especially during Ozone Action Days.

According to the Southeast Michigan Council of Governments, to help lower the amount of ground level ozone in the air we can:

  • Delay mowing your lawn until evening or the next day. Exhaust from a lawn mower and other gas-powered lawn and garden equipment help form ozone.
  • Drive less, telecommute, bike, or walk. This helps reduce traffic congestion and air pollution.
  • Avoid refueling vehicles during daylight hours. Fumes released at the gas pump contribute to ozone formation.
  • Delay or combine errands. This will reduce traffic congestion and air pollution.
  • Reduce electricity use.

With wildfires still burning in Canada, temperatures continuing to rise and air pollution still occurring in Southeast Michigan, it is likely the number of Ozone Action Days in Southeast Michigan will rise from 13. For some of our most vulnerable populations, summer days may be spent inside more often than expected, now and in the future. As noted in our previous post, the wildfires causing our most recent Ozone Action Days are related to climate change, which is creating hotter and dryer seasons.

And, while wildfires are impacting our air quality, so is pollution, which also is a driving factor in climate change. Two of the vulnerable populations we did not discuss in this post are those in poverty and certain minorities. We will further examine how these populations are impacted by not only air quality, but also pollution, in future posts as we have a larger conversation on environmental racism.

Michigan Air Quality Remains Poor, State at Risk of Increased Fires

As of 10 p.m. on Monday June 26, some places in Michigan had Air Quality Index (AQI) levels above 150, a level that is serious for even healthy people and can be dangerous for people with serious health conditions, according to PurpleAir.com. This website tracks hyperlocal quality throughout the country on a daily basis; to view current information click here.

The poor air quality in Michigan, currently, is a result of massive fires in Canada, particularly Quebec, with smoke drifting down into Michigan.

But Michigan is also facing a substantial increase in wildfires of its own. And it could get worse.

The average number of fires per year in Michigan is 337, according the Michigan DNR, and halfway through 2023 the state is on pace to exceed that average with 238 fires having already been reported. According to the Michigan Department of Natural Resources there have been 205 total fires in Michigan’s lower peninsula in 2023, as of June 26, 2023, and 33 in the upper peninsula.

There are several reasons for fires, which include everything from lightening (279 since 2006) to fireworks (53 since 2006) to debris burning (1553 since 2006) and more. But one common factor amongst many fires is a dry environment that allows sparks to turn into flames and flames, in some cases, into raging fires. As of June 26 of this year, 2,532 acres of land had been burned by fires in Michigan; the average number of acres burned by fires in Michigan in June is 270. The Wilderness Fire Trail in Crawford County, which was started by a bonfire, burned more than 2,000 acres of land in June, according to the Associated Press. This wildfire contributed to the above average number of acres burned by fire in 2023. Michigan wildfires also drew attention in May, with more than three dozen being reported, according to Bridge Magazine. The cause? Drier than usual weather. According to the National Integrated Drought Information System, May of 2023 was the ninth-driest May in Michigan since the federal government began keeping records in 1895.

With summer just beginning, we are nowhere near being out of fire season. According to the US Drought Monitor, created by the University of Nebraska-Lincoln, much of Michigan is at least abnormally dry, as of June 22, 2023. The western portion of the Upper Peninsula and about a third of the Lower Peninsula (the thumb and the top of the “mitten”) have been deemed “abnormally dry,” and nearly all the remaining portion of the “mitten” (including Wayne County) have been deemed “moderately dry.” There is also an area in mid-Michigan that has been deemed to be in a severe drought; the eastern portion of the Lower Peninsula has no drought conditions.

With drier conditions being a factor in increased fires across the state of Michigan, we must also touch on what is behind the drier conditions. Climate change, driven by increased emissions, pollution and more, can be dubbed as the main culprit behind increased drought conditions in certain areas (and increased drought in other areas, but that is for another day).

In Michigan, average temperatures have already risen 2.5 degrees, with summers being hotter and heatwaves being stronger. Fast forward to 2100, summers in Isle Royale National Park, for example, are expected to be 11 degrees hotter, according to statesatrisk.org.

The chart below shows just how Michigan’s annual daily temperatures have changed since 1900 and how they are expected to change up to 2100, depending on the amount of emissions we continue to pump into the environment (Southeast Michigan has several high emission emitters, as will be discussed in detail in a future post). The observed data is through 2020 and shows that Michigan’s average temperature has increased by nearly 3 degrees (Fahrenheit) over time. According to the data set from The Cooperative Institute for Satellite Earth System Studies and the National Oceanic and Atmospheric Administration (NOAA), even with lower emissions temperatures are expected to increase in Michigan by a minimum of 3 degrees through 2100. That number could increase to at least 12 degrees though if the emissions we produce increase.

With climate change having a direct impact on our environment, it is also having a direct impact on our lives. We know drought can be catastrophic to crops, our food systems and the economy and we know fires cause destruction. It should also be known that fires also have a direct impact on air quality, which affects the lives of all of us.

Next week we will dig into how Michigan’s air quality ranks and how the fires in Michigan, and beyond, have making it much worse in recent weeks.

Southeast Michigan’s Poor Air Quality a Result of Climate Change

Air quality in Southeast Michigan has been notably poor in recent weeks, with three Ozone Action Days occurring in June thus far. According to the Southeast Michigan Council of Governments, Ozone Action season began on May 1 in Southeast Michigan. This year is the 30th year of the voluntary program that helps keep Southeast Michigan’s air clean. In 2022, there were five Ozone Action days.

As we’ve discussed in previous posts, clean air is vital to healthy populations, and in Southeast Michigan clean air has been hard to come in recent weeks. The Canadian wildfires have been the easy culprit to blame for the poor air quality, the real root of the problem goes much deeper….climate change.

Wayne State University Center for Urban Studies Director Lyke Thompson further dives into what is causing poor quality in Southeast Michigan in this recent opinion piece published by the Detroit Free Press.

Deer Numbers in Michigan Continue to Grow

Deer season is open in Michigan once again, and this year it is estimated that there are more deer and fewer hunters. According to the Michigan Department of Natural Resources there are about 2 million deer in Michigan currently (2022), and 10 years ago the deer population was estimated to be about 300,000. And, as the number of deer have increased the number of deer hunting licenses in Michigan have decreased, yet the number off deer-vehicle crashes have increased.

Beginning with hunting license data, the number of hunting licenses issued in the State of Michigan has been declining for several years, at least. According to the Michigan Department of Natural Resources, there were 732,163 hunting licenses issued in 2017 and by 2021 that number declined to 641,588. For 2022, 460,436 hunting licenses has been issued as of Oct. 31, 2022.

According to a 2021 MLive article, two reasons for the decline in hunting is that both access and time is dwindling. In other words, people are growing too busy to spend time to hunt and hunting locations are declining for some too.

So, with the decline in deer hunters there has been an increase in Michigan’s deer population and an in deer-vehicle traffic accidents. In 2021, there were 52,218 deer-vehicle traffic accidents, with the greatest number of accidents happening in November, according to Michigan Traffic Crash Facts. In general, there were more crashes in the winter months when the days are shorter and when rutting season (essentially mating season occurs). Since 2011, 2019 was when there was the greatest number of deer-vehicle accidents at 55,531.

Furthermore, in 2021, of the seven counties in Southeastern Michigan, Oakland County had the highest number of accidents at 1,853. It should be noted, Oakland County also has a higher population than all the other counties except Wayne County. However, Wayne County reported 511 deer-vehicle accidents in 2021. Wayne County also has more densely populated areas.

Not only have deer-vehicle traffic crashes increased overtime, but an increase in deer populations can also damage an ecosystem as the deer can decimate certain plant species (for food), including those in residents’ yards. Concentrated deer populations are also more suspectable to disease. So, the increased visibility of deer, along with the issues they can bring, has brough about outcries from local communities for area leaders to find a fix. In Southfield, voters approved an advisory measure to reduce the city’s deer herd by human, lethal manners. This advisory deer culling measure received 62 percent of the vote in the Nov. 8, 2022 election. Other communities that have taken action to reduce its population include Ann Arbor and Grosse Ile.

The Southeast Michigan Council of Governments also has taken interest in the region’s growing deer population and its impact on residents, traffic and land management. It recently created a survey asking area how communities several questions regarding their experiences with deer in their communities and what their concerns about deer are. The survey is now closed, but SEMCOG leaders are hoping its results will help lead to additional solutions to the area deer problem.

Michigan’s Potential Future with Nuclear Energy

The consumption and production of nuclear energy is not new in Michigan. In fact, according to the most recent data from Energy Information Administration, Michigan produced more nuclear energy in 2020 than any other kind of energy. At that time, Michigan had three functioning nuclear power plants- Fermi 2, Cook and Palisades. In May of 2022 though the Palisades Nuclear Power Plant, which is located on the west side of the state, ceased operations.

Now, however, Palisades’ operations might re-start. Several lawmakers in Michigan want the nuclear plant to re-open, both for energy and economic purposes. On Sept. 9, 2022 Gov. Gretchen Whitmer sent a letter to the US Department of Energy supporting the new owner of Palisades Power Plant’s (Holtec International) federal grant application to the Civil Nuclear Credit program. This program was established to save “premature” retirements of nuclear reactors due to financial hardships. While Michigan lawmakers, such as Gov. Whitmer, believe the nuclear plant is eligible for the program there are several groups, including the Michigan Sierra Club and Michigan Wildlife Conservancy that believe otherwise.

When the Palisades Nuclear Power Plant closed on May 20, 2022 it closed 11 days early because of the performance of a “control rod drive seal,” according to a press release from the Governor’s Office. It was on May 20 that its fuel supply ran out and the power purchase agreement with Consumers Energy expired. The environmental groups say that the plant isn’t eligible for the federal grant program.

Opponents say ineligibility stems from the fact the plant is in fact retired now, according to the Holland Sentinel, and the program is intended for plants that are still operating. According to the Nuclear Regulatory Commission, it has never received a request to return a nuclear plant to the grid after it has been permanently defueled. If Palisades becomes the first this could mean the 600 jobs lost when the plant closed could be brought back.

Proponents say economic development is a factor to consider when seeking to  re-open the plant as well as the amount of energy produced and consumed. They argue its long-term effects on Michigan and beyond should also be considered.

Data is not yet available to determine how the closure has impacted the state’s energy production and consumption for 2022, but according to the Governor’s Office more than 800 megawatts of nuclear energy was produced by the Palisades plant on an annual basis. And, as the charts below show, the amount of nuclear energy produced in Michigan is equal to the amount consumed.

According to the Energy Information Administration, in 2021, coal provided the largest share of Michigan’s electricity net generation (32%), followed by nuclear energy (30%) and then natural gas-fired power (27%). The data in BTUs was not available for 2021, but the charts below show that in 2021 316.7 trillion BTUs of nuclear energy was both produced and consumed in Michigan.

In the last 20 plus years the amount of nuclear energy produces, and consumed, has grown slightly (except for a production dip in 2009). In 2000, 196.9 trillion BTUs of nuclear energy was produced and consumed in Michigan, and by 2020 that number increased to 316.7 trillion BTUs. It will decline substantially now with the closing of Palisades, a loss of roughly 800 megawatts.

While the reasoning behind the closure of Palisades Nuclear Plant was based on business reasons, its reopening offers the possibility of a non-carbon-based source of electricity. Michigan has a heavy reliance on carbon-based energy.  The goal is for the state to be carbon neutral by 2050, have all coal plants closed by 2035 and to use at least 50 percent of renewable energy for consumption by 2030, according to the MiClimate Plan. Nuclear energy is not renewable, but it is a non-carbon-based source of energy. It’s advocate, the Office of Nuclear Energy, argues:
•It does not produce emissions (nuclear energy produces energy through fission);
•It utilizes a relatively small footprint to produce energy than others sources (more than 3 million solar panels are needed to produce the same amount of power as a typical commercial reactor or more than 430 wind turbines, according to the Office of Nuclear Energy);
•Nuclear fuel is dense so it produces minimal waste.
Opponents support the decommissioning of plants, including Palisades. Their reasoning considers first, the radioactive waste that remains on-site. The waste can remain on site for decades and the storage and removal of the waste is a concern because of potential spills, groundwater contamination and more.
In addition, the risk of an accident at a nuclear plant also causes grave concern for those in the plant and the surroundings of the nuclear power plant, including long-term radioactive pollution of the area—just look at Chernobyl. Recent  threats to Ukrainian nuclear plants raise the specter of new ways that nuclear disasters could occur.  Other concerns are that the mining of uranium is controversial, nuclear plants can be viewed as national security threats, and these plants cost an exorbitant amount to build.
With the pros and cons to nuclear energy fairly well known, now the federal government, the new Palisades’ Nuclear Power Plant owner and the State of Michigan must decide whether redeveloping Michigan’s nuclear energy supply is worthwhile.

Michigan’s Energy Consumption Declined in 2020

In 2020, Michigan’s primary energy consumption was 2,610.6 trillion British Thermal Units (BTU), the lowest it has been since 1984 when it was at 2,597.4 trillion. This total consumption number is based on all categories of energy, including (but not limited to) coal, petroleum, natural gas and renewable energy sources. Between 1984 and 1999 energy consumption in Michigan continued to regularly increase; in 1999 Michigan’s total energy consumption was 3,227.4 trillion BTU. Since then, Michigan’s energy consumption decreased to 2,610.6 trillion BTU in 2020. In 2020 Michigan ranked 10th in total energy consumption out of the 50 states and the District of Columbia (this includes residential, commercial, industrial and transportation).

The decrease can be linked to several factors including, Michigan’s population decrease, the commercial sector becoming more energy savvy, the implementation and use of Utility Waste Reduction Programs and an overall awareness on energy consumption and its environmental and financial impacts. 

However, while energy consumption is declining in Michigan, energy use is still a key factor in everyday life. The chart below highlights some of the key energy sources consumed in Michigan in 2020.

**The data provided in this post is from the to the U.S. Energy Information Administration (EIA) and can be found here.***

In the State of Michigan, petroleum is the most highly consumed form of energy, according EIA.  In 2020, 1,010.9 trillion (BTU)s of petroleum were consumed in the State of Michigan with natural gas being the second highest consumed energy source at 1,003.4 trillion BTUs. For context, , petroleum represents the use of motor gasoline, distillate fuel oil, residual fuel and jet fuel and natural gas is used for heating, electricity and industrial use. One of the largest energy sources produced in Michigan is natural gas.

Coal was the third largest type of energy consumed in Michigan in 2020 at 334.4 trillion BTUs. Although coal is the third largest type of energy consumed in Michigan, coal fired-power plants provide the largest share of the electricity generated in Michigan. However, Michigan has no active coal mines, most of the coal consumed in the state is brought in by rail from the west.

Renewable energy consumption in Michigan is not even half of the consumption of petroleum, natural gas or coal, but there are continuous strides to utilize it as a reliable energy source. Biomass, all together, was the largest consumed renewable energy source in Michigan at 157.7 trillion BTUs in 2020. Biomass includes organic matter such as wood or crop waste. Wind energy is the second largest consumed renewable energy source in Michigan at 59.1 trillion BTUs.

While petroleum has long been an energy source that has been heavily consumed in Michigan, there has been shifts in its consumption numbers, along with the consumption of other energy sources. The charts below show how energy source consumption habits have changed in Michigan between 2000 and 2020.
Some key takeaways include:

Petroleum: There has been an overall increase of usage since 2012, when it was reported that 787.2 trillion BTUs were consumed. Prior to 2012, use of petroleum remained steady between 2000 and 2005. Consumption then began to drop to the 2012 low point. This pattern of decline, then resurgence, is one that follows economic activity related to the Great Recession. We will likely see a decline in consumption for 2021, and even 2022, in reflection of the pandemic and its economic impacts.
Natural Gas: Consumption of natural gas hit a low point in 2009 at 750.8 trillion BTUs. Since then though, consumption steadily increased through 2019. In 2020 there was a slight decrease, with consumption dropping from 1,055 trillion BTUs in 2019 to 1,003.5 trillion BTUs in 2020.
Biomass: Consumption of biomass as an energy source steadily increased between 2002 and 2018. In 2002 81 trillion BTUs of biomass was consumed and by 2018 that number increased to 175.7 trillion BTUs. Since 2018 consumption has been slowly declining. A decrease in consumption of wood and waste and fuel ethanol were the largest contributors to that decline.
Geothermal: The consumption of geothermal as an energy source steadily increased from 2000 to 2011, (from 1.2 trillion BTUs to 5.1 trillion BTUs) and has since leveled off, with 5.2 trillion BTUs being consumed each year between 2012 and 2020.
Wind: Consumption of wind power energy in Michigan truly took off in 2009 and has only increased since then, with the 2020 consumption number being 59.1 trillion BTUs.
Solar and hydroelectric: Solar and hydroelectric are the lowest consumed renewable energy sources in Michigan. According to the EIA, 3.2 trillion BTUs of solar energy was consumed in Michigan in 2020; this is an increase from the 0.2 trillion BTUs consumed in 2000. This was also the highest amount consumed to date.
Consumption of hydroelectric energy has been erratic, with consumption of this energy source fairly consistently increasing since 2012.

While fossil fuels are still a large part of Michigan’s energy consumption, the data shows there is a shift, albeit somewhat slow, toward renewable energy. In 2008 Michigan enacted a renewable energy standard that required the state retail electricity providers, such as DTE, to generate at least 10 percent of their energy sources from renewable energy; that requirement increased to 12.5 percent to be met in both 2019 and 2020 and 15 percent in 2020.

Even with renewable energy policies in place, the data presented here indicates that carbon dioxide producing fossil fuels are likely to continue to dominate energy consumption for many decades. Policy makers must take stronger, more immediate approaches to address the dangers of climate change, which directly impacts our environment, economy and children.

Parks Need Priority in Funding to be Sustained

While park land is plentiful in Southeastern Michigan, its upkeep and protection is something necessary to keep it accessible to the public. As noted in our last post, park land throughout Michigan, and Southeastern Michigan, is made accessible through government entities, non-profits and/or private organizations. The funding of park lands and public spaces by non-profit and private organizations is at the will of the organizations’ board members and owners. However, funding and protecting park land through government entities is often more complex.

Government owned and operated parks throughout Michigan are funded primarily through tax dollars, but user fees, grants and donations also aid in their funding. At the state level, according to the Michigan Department of Natural Resources (MDNR), about 97 percent of funding for parks operations and maintenance is generated by user fees and royalty revenues. According to the MDNR, the breakdown is as follows:

  • 51%: Camping and lodging reservation fees
  • 26%: Recreation Passport sales
  • 15%: State-owned, oil, gas and mineral royalty revenues – which feed the Michigan State Parks Endowment Fund – (15%)
  • 5%: Concessions, shelter reservations and miscellaneous sources

Michigan’s General Fund tax dollars provide the remaining three percent of state parks funding.

At the County level, funding differs from one county to the next. For example, in Wayne County there is a millage (0.2459 mills) that funds county parks and distributes money to local communities for their parks. This millage means that the County’s general fund is not expected to make room for parks funding, but if those elected to represent Wayne County residents chose to do so in the general fund they can. Instead, through this additional millage that was voted on by the people (in 2016 and renewed in 2020) there is a dedicated funding source for a guaranteed amount of time. Through a parks millage, funding is dedicated to the creation, operation and/or upkeep of a park. When parks are funded through just the general fund the amount of money allocated to the parks, the programs and/or upkeep can vastly differ from year-to-year depending on the priorities of the elected bodies.

By simply putting a parks millage on the ballot, Wayne County showed that park improvements were a priority of theirs, and with 76 percent of voters supporting the 2020 ballot initiative this also showed that Wayne County residents also view parks as a priority.

In addition to Wayne County having a millage that helps support its parks and recreation opportunities so does Oakland, Washtenaw and St. Clair counties. In Southeastern Michigan, Monroe, Macomb and Livingston counties do not have additional funding mechanisms to support their parks.

Despite Monroe, Macomb and Livingston counties not having county-wide millages to help fund parks, there are cities in Livingston and Macomb counties that have millages to help support their parks.

For example, in Livingston County the Howell Area Parks and Recreation is supported by a 0.75 millage. This millage not only created the recreation agency that services Genoa, Marion, Oceola and Howell townships it also finances the parks and services the residents of these townships use and rely on.

In Macomb County, the cities of Roseville and Eastpointe created a joint recreation authority through a 1 mill tax levy that was originally approved by voters 2011. This millage allows the authority to operate, offer services (which produce revenue, also allowing the authority to operate) and maintain and update facilities and parks. Municipalities such as Washington and Macomb townships also have millages (one for each township, they do not have a joint authority) that support their parks and their recreation opportunities.

So, while tax dollars are a primary source of funding for our parks, and the opportunities they provide, the commitment to their allocation varies. Additionally, commitment to the funding of public parks comes from other sources as well. For example, there are the revenues generated from their use (fee structures differ from one park to the next, one program to the next and one municipality to the next), donations offered from various people and groups and grants that municipalities receive.

The grants that municipalities can apply for to support their parks are rather plentiful; the MDNR, the Southeastern Michigan Council of Governments, Ralph C. Wilson Jr. Foundation are just some of many organizations that allocate grand fund to support parks and recreation opportunities. However, grants are often a one-time allocation of funds and cannot be relied on to ensure a park, its staffing, its programs and more will continue from one year to the next.

To ensure the park land, and the programs associated with it, we all benefit from remains accessible and useable we must create dedicated funding mechanisms. Millages are one source, but must be approved by voters. And, while general fund dollars flow into a municipality on an annual basis, the allocation of those funds differs annually.

Park Land is Plentiful in Southeastern Michigan

In Southeastern Michigan there are more than 2,300 parks which are owned and operated by either the federal government, State of Michigan, a local municipality, the Huron Clinton Metroparks Authority or a private entity. The footprint of these parks covers more than 214,000 acres and much of these parks are concentrated in the more heavily populated areas of Southeastern Michigan, such as Wayne, Oakland and Macomb counties. For example, in the City of Detroit there are 359 total parks, which range in size, type (passive, active, trails, etc.) and ownership (city, state, private).  Parks are viewed as an essential service because they increase economic value, provide health and environmental benefits and create an aspect of community, allowing for greater socialization. Furthermore, understanding how accessible parks and recreation amenities are can help communities prioritize improvements that serve more people.

In Southeastern Michigan 1,847 of the parks in the region, or 80 percent, are owned and operated by local municipalities. For example, of the 359 parks in Detroit about 350 are owned and operated by the City itself, the others are owned and operated by the Michigan Department of Natural Resources or private entities. Private entities in the region own and operate the second highest number of parks in the region, followed by counties. The way in which counties prioritize parks in the region varies greatly. For example, in Macomb County there are only two county parks—Freedom Hill, which serves as an entertainment center, and the Macomb Orchard Trail, which is a 26 mile long multiuse path that is overseen by a board comprised of a county representative and one person from each community that also pays into the system. In Oakland County there are 13 parks and in Washtenaw County there are well over 20 different parks, many of which are nature preserves.

Public parks are largely funded by public monies and each municipality’s priorities are reflected in how their dollars are spent. So, in the case of Washtenaw and Oakland counties, for example, we see that the counties themselves place a higher priority on access to parks. The emphasis on parks and recreation opportunities in communities can not only be seen by how the general fund dollars are allocated to such amenities, but also by if there are additional taxes voted on by residents to further increase parks and recreation amenities and access to them.

While funding allocations to parks differ from one county, and community, to the next, we do know that access to parks in the region is easily attainable for most. As noted, majority of the parks are concentrated in more heavily populated areas, but according to the Southeastern Michigan Council of Government’s (SEMCOG) 2019 Parks and Recreation Master Plan, parks and recreation opportunities are accessible within a 10-minute drive for nearly every household in the region. Additionally, according to the study, a 10-minute bike ride provides access to parks for 89 percent of households in the region. The study does show that for 42 percent of households in the region access to parks within 10 minutes of walking or use public transportation is not attaintable, posing a barrier of access to those who may not have a reliable use of their transportation. The lack of a strong public transportation system in the region does prove to be problematic for those who want/need reliable access to parks, especially the region’s largest parks. Since larger parks are located in less populated areas those without reliable transportation of their own, who may rely on public transportation, will have greater difficulty in reaching the larger parks. SEMCOG’s Access to Core Services report state that 7 percent of all households and 13 percent of transit-dependent households are within a 30-minute transit trip to a park greater than 200 acres in size.

The maps below highlight where parks are located in the region.

As noted, parks are viewed as an essential amenity within a community. However, funding to maintain and improve parks and recreation amenities is also vital to ensure such access. While we know majority of the region can access parks and recreation opportunities currently, we will further look into some of the funding structures that allow for such access in a later post and evaluate their long-term viability. We will also look deeper into the access of parks as it relates to the socioeconomic makeups of communities in Southeastern Michigan.

Flooding Grows More Common in Southeastern Michigan

Flooding in Southeastern Michigan continues to grow more common as weather patterns shift. In the summer of 2021 alone there have been at least three major flooding events, leaving hundreds of people with waterlogged basements, furniture and more. While the amount of rain certainly has an impact on the frequency of flooding, so does aging water infrastructure and various other household and neighborhood factors.

According to the June 2021 report “Household Flooding in Detroit” by Healthy Urban Waters, in partnership with the Wayne State Center for Urban Studies and others, 43 percent of 4,667 Detroit households surveyed between 2012-2020 reported household flooding. Furthermore, in an online Detroit Office of Sustainability survey published in 2018, 13 percent of those survey reported they experienced flooding very often; 23 percent reported they experienced flooding somewhat often and 32 percent reported they experienced it occasionally. Additionally, a cross-sectional study published in 2016 of 164 homes in Detroit’s Warrendale neighborhood indicated that 64 percent of homes experienced at least one flooding event in during that, with many experiencing three or four events, according to the report.

While we have the data on Detroit flooding, recent anecdotal tales tell us how cities throughout Southeastern Michigan—the Grosse Pointes, Dearborn and more—also continue to be affected by the surge of rain during storm events. Old infrastructure certainly impacts how a rain event affects a community, but so do other factors, such as the age of a home and if it is a rental versus being an owner-occupied unit.

According to the “Household Flooding in Detroit” study, Detroit renters were 1.7 times more likely to report household flooding than homeowners. In a different study, the 2021 Detroit Citizen Survey, individuals were provided a list of home problems and asked to identify which ones apply to their house or apartment. There were 570 respondents to this question and of those a total of 1,111 problems were recorded; four of the five top problems (mentioned by 83% of householders) concerned water in the home (from plumbing to flooding).

The first map above shows the hot and cold spots of flooding in Detroit using the Getis-Ord Gi* statistic. Red dots represent “hot” spots of statistically significant clusters of homes that have experienced flooding. Purple dots represent clusters of homes that have not report flooding. The map reflects responses from a sample of 4,667 Detroit households who participated in the Center for Urban Studies’ Home Safety Assessment survey between 2012 and 2020. Among these households, 2,546 (42.75%) reported household flooding. As shown in the first map, the “hot” spots for household flooding in the City are located in clusters in the north end of the City, in the Jefferson Chalmers area near the river and Grosse Pointe Park, the East Village/Indian Village areas and in the Warrendale/Rosedale Park/Michigan Marin areas. Also note, some of these “hot” spot flooding areas in Detroit border other areas that have experienced flooding during recent rain storms, such as Dearborn and Grosse Pointe Park.

The second map shows 2015 data of the percent of renters, by Census tract, in Detroit. Those Census tracts with “hot” flooding spots also have at least 30 percent of the population renting and data shows that neighborhoods with a larger proportion of renters (compared to owners) and homes built before 1939 are more likely to experience household flooding. According to the Census Bureau, about 33 percent of the City’s housing stock was built before 1939.

The flooding study also found that primarily Black communities were found to be at high risk for household flooding; according to the Census Bureau, 78 percent of Detroit’s population is Black.

So, while we know that flooding affects some communities in Southeastern Michigan more than others and that the risk for the region will only increase as the effects of climate change grow, there actions that can be taken to mitigate flood damage. Updating water and sewer infrastructure to increase its reliability is a high, yet expensive, priority to help decrease the risk of in-home flood events for communities at-large. Investment in green infrastructure, such as rain gardens, is another option as is identifying parts of communities most prone to flooding and further investigating the specifics behind it. But again, these require time and money and municipalities regularly struggle to maintain their infrastructure, let alone allow for major upgrades.

Infrastructure investment is necessary, but so are larger actions to help slow the affects of climate change.