Detroit’s Outer Most Neighborhoods Have Lowest Percentage of Long-Term Homeowners

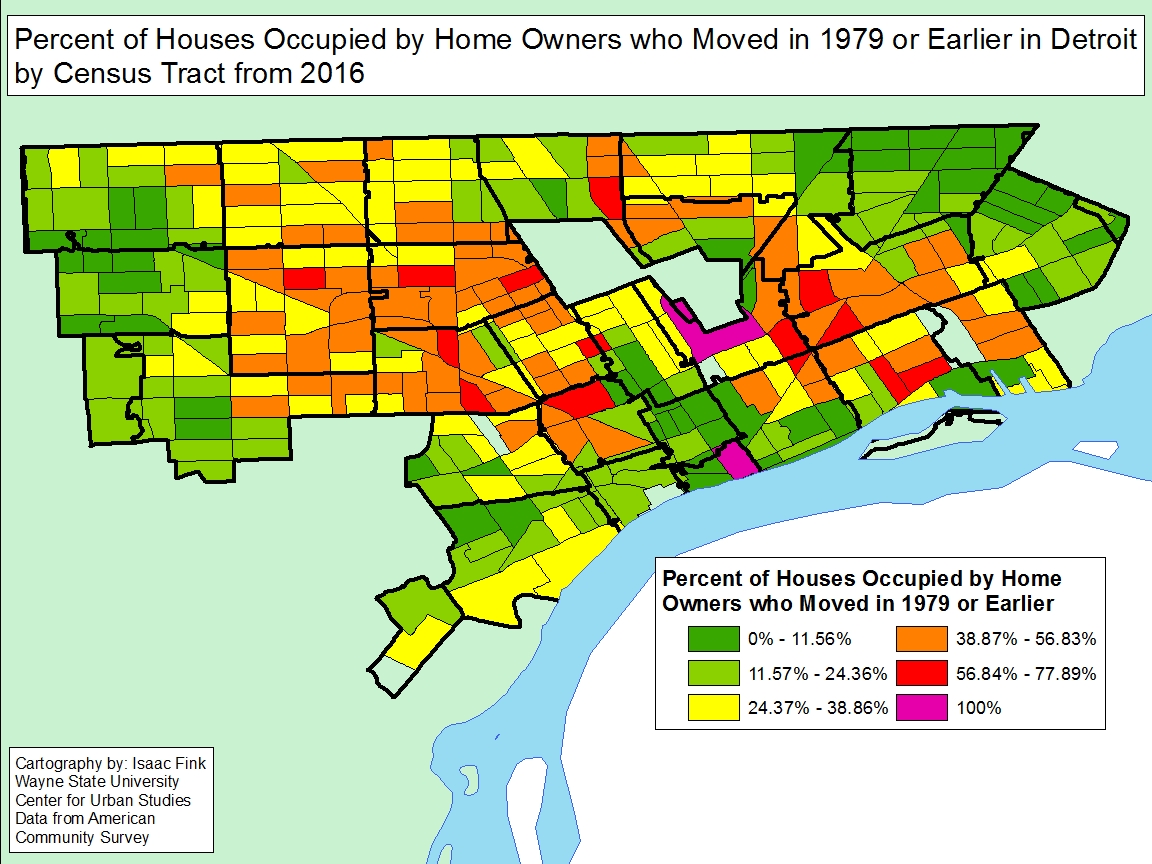
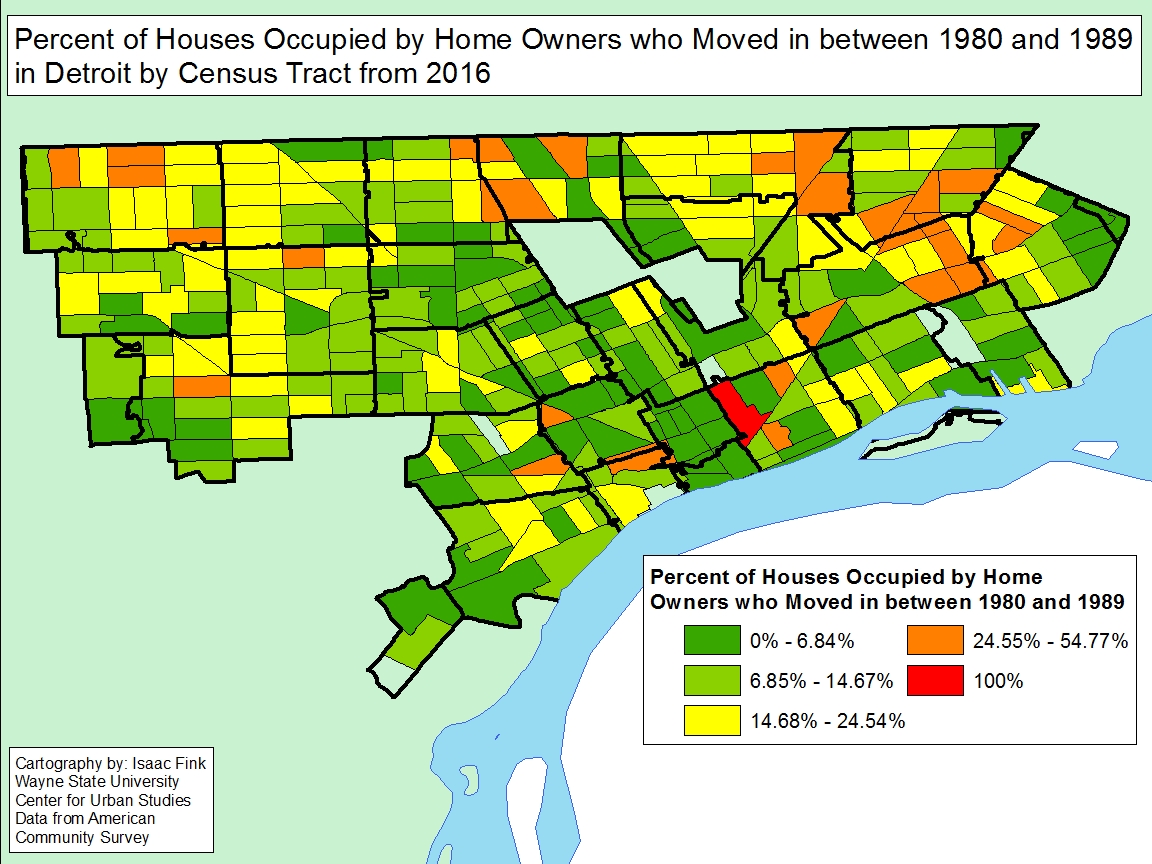
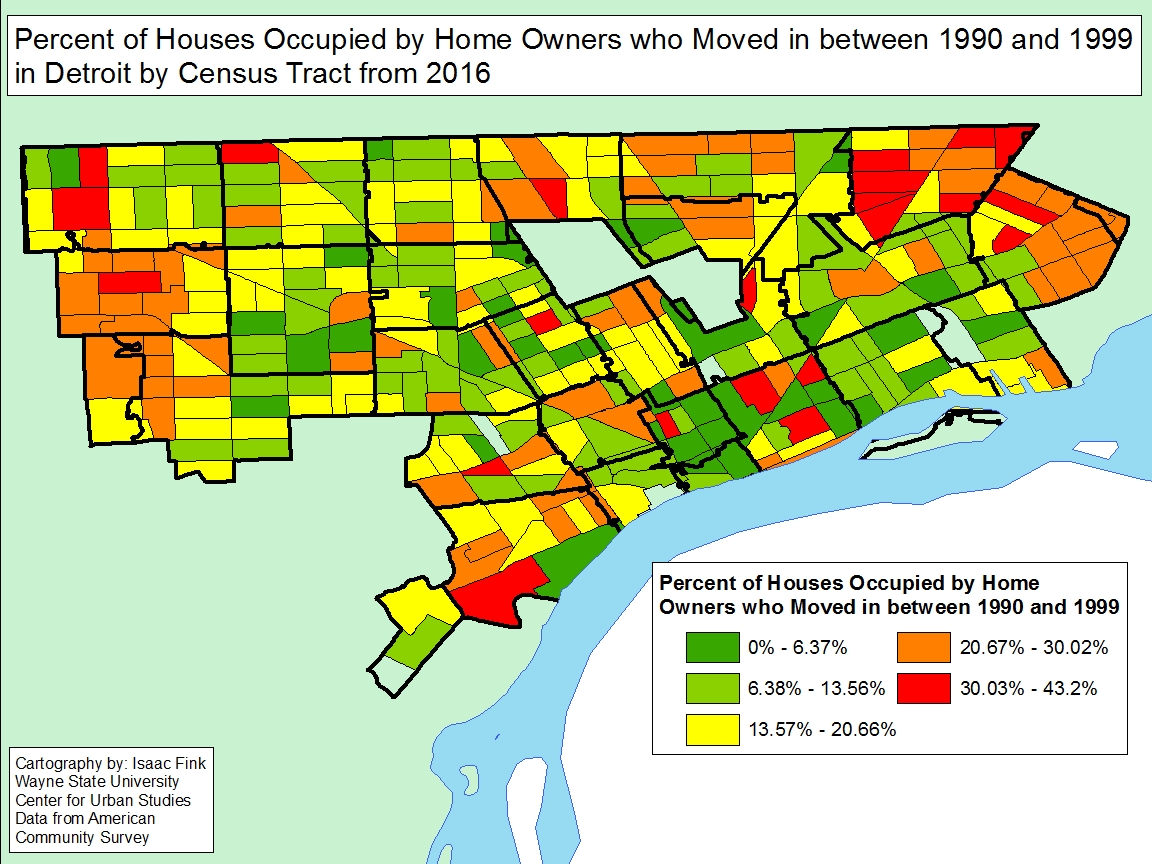
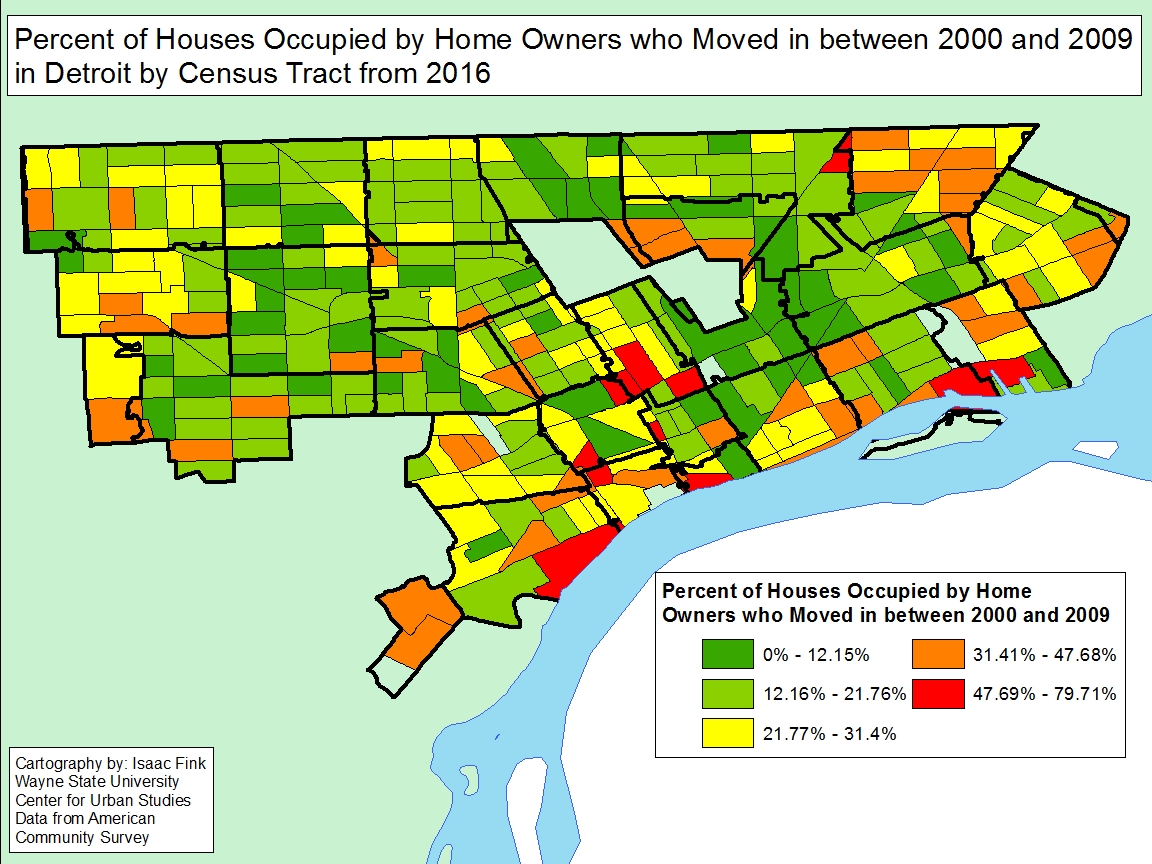
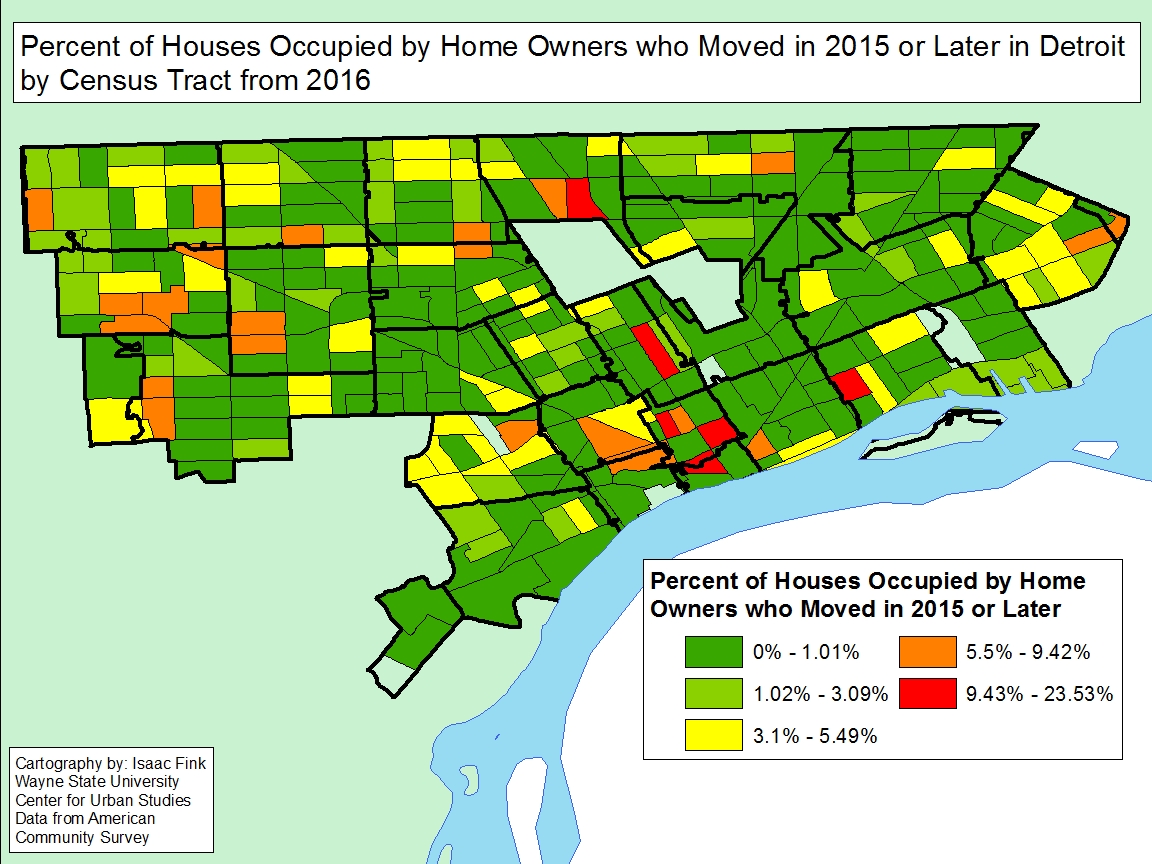
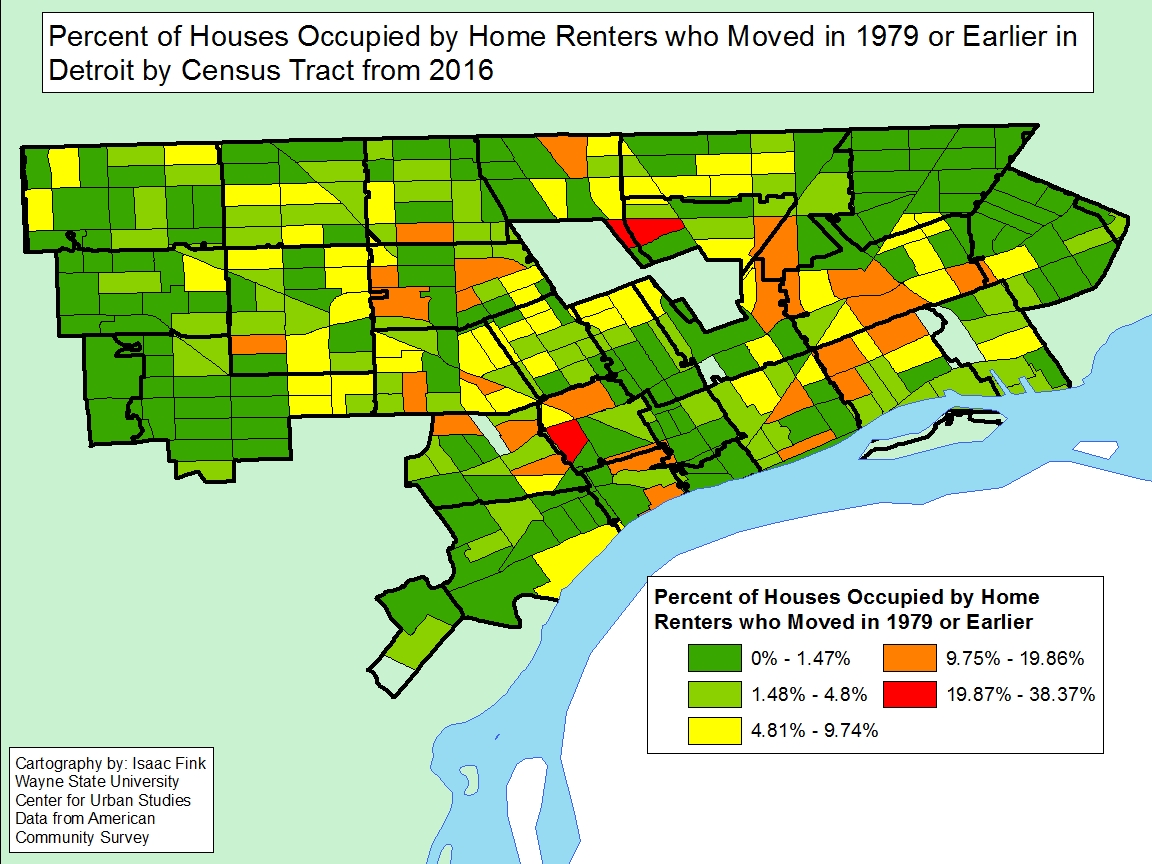
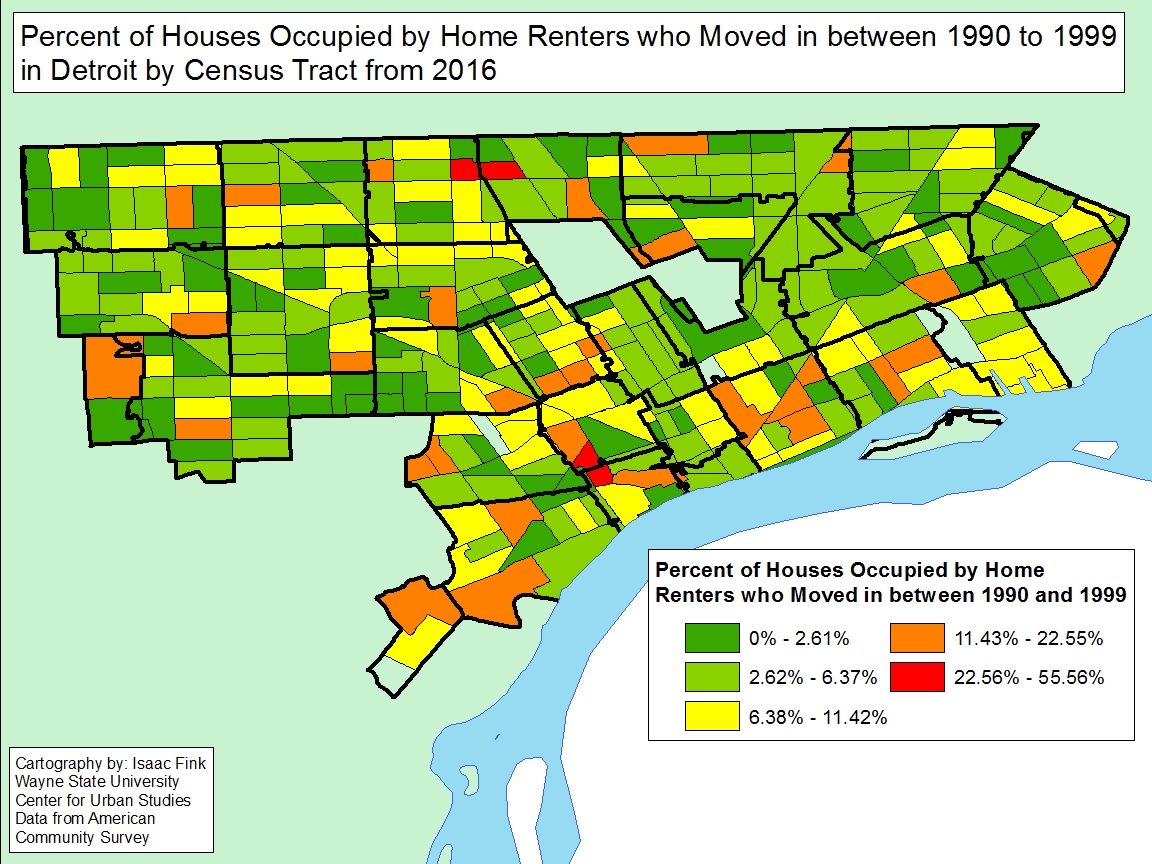
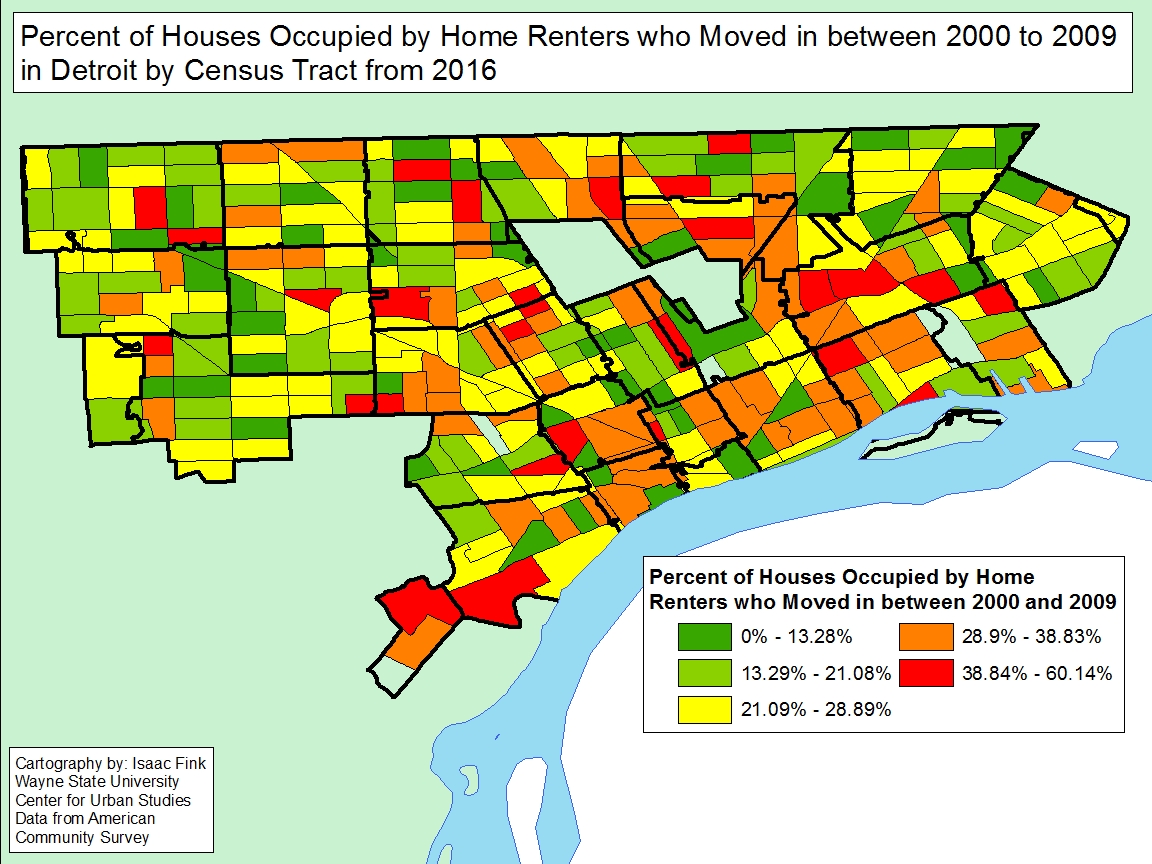
Of the about 600 Census Tracts in the City of Detroit about 75 of them have more than 40 percent of the residents who have owned their home since 1979 or earlier, according to the most recent data from U.S. Census Bureau. These Census Tracts are primarily located just west of Highland Park, but not in the City’s most westward neighborhoods. There are also several Census Tracts with a high percentage of long-term homeowners just east of Hamtramck. Again though, these neighborhoods don’t extend to the most eastern parts of the City. Homeownership in the Census tracts along the City’s borders primarily peaked between 1990 and 1999, with between 20 and 43 percent of the homeowners in those Census tracts having owned their homes since that decade. Between 2000 and 2009 there was about a handful of Census tracts where between about 50 and 80 percent of homeowners moved in during that decade. One of those Census tracts is located in Southwest Detroit right along the Detroit River. There is also about a handful of Census tracts with 10-25 percent of homeowners having just purchased their home since 2015. The Census Tracts are located in the Corktown, Midtown, North End, Palmer Park and West Village areas, all areas experiencing improvement in housing quality and investment.

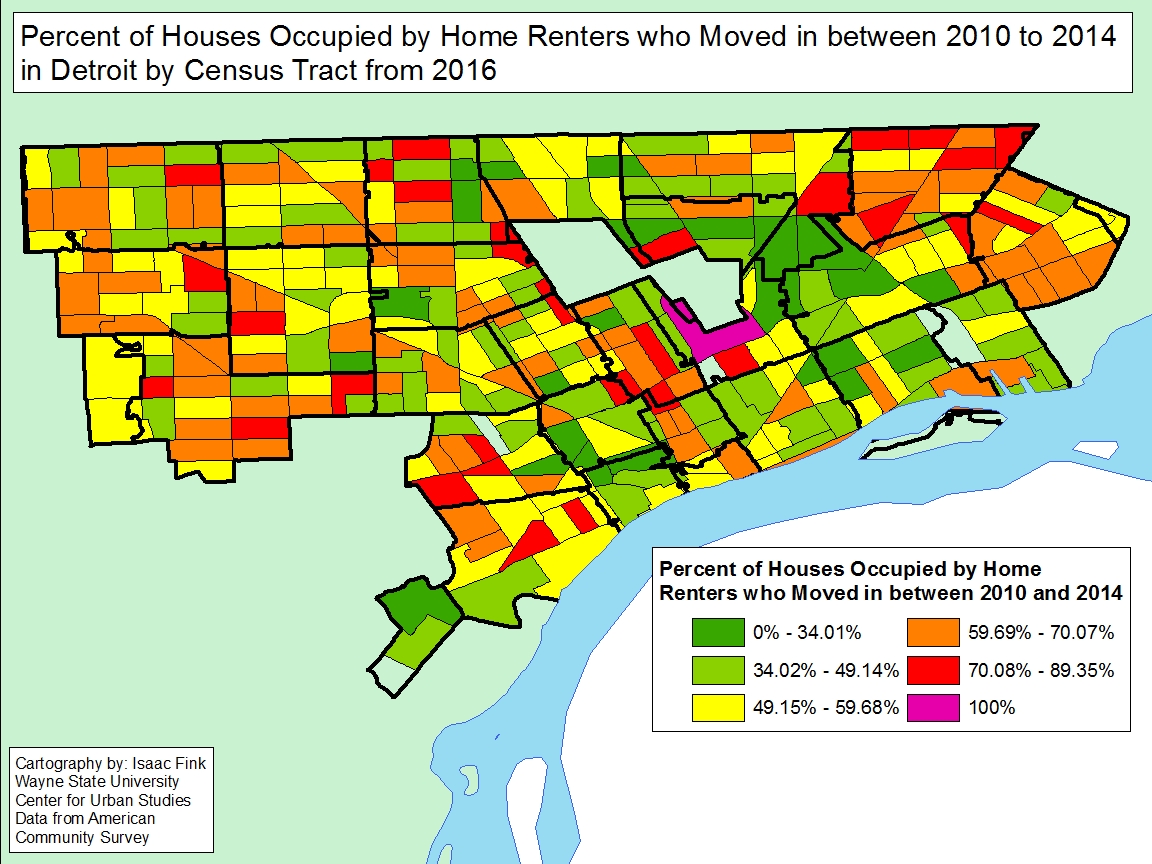
There are large areas of Detroit’s outer neighborhoods where large shares of the renters have moved in since 2010. Detroit’s most eastern and western neighborhoods have among the highest percentage of renters who moved into those areas between 2010 and 2014. The City Airport/Kettering neighborhood areas have majority of renters residing in those areas since the early 2000s. The “Poletown” neighborhood just south of Hamtramck has the highest percentage of recent home renters between 2010 and 2014. Higher percentage of recent renters can arguably be attributed to three trends, the first being the increase of people moving into Detroit’s re-developing neighborhoods (Downtown, Midtown, New Center, the West Village-in these areas between 60-90 percent of renters have been there since 2010). The second trend may be the movement of lower income individuals due to evictions and/or inability to afford long-term housing options. The third trend, frequently mentioned by property inspectors and others, is families forced by eviction to become renters of the homes they formerly owned. There are only two Census Tracts in Detroit where more than 20 percent of residents have been renting since 1979 or earlier, one is located just north of Hamtramck, and the other is located near the Woodbridge area. In the vast majority of City Census Tracts it is rare to find substantial percentages of renters remaining in one spot for longer than 35 plus years.

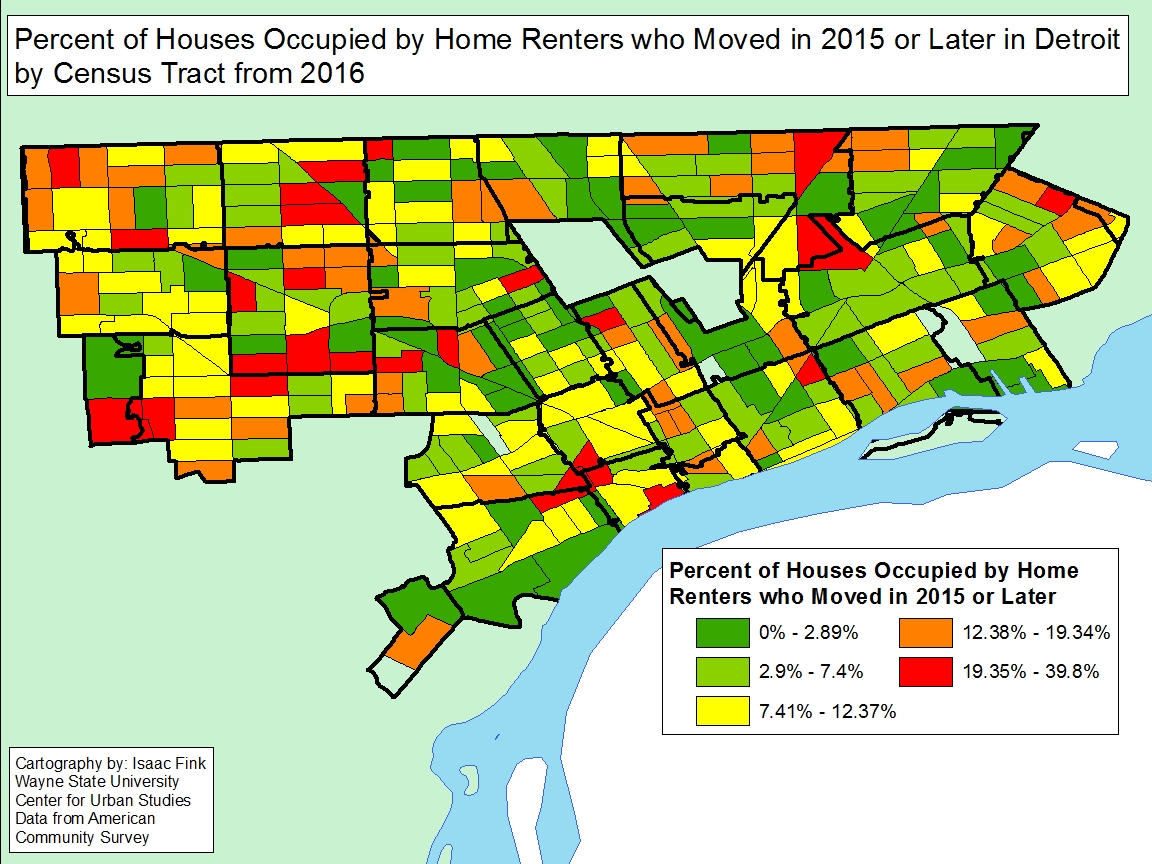
Overall, the data in this post shows that City’s outermost neighborhoods have the lowest percentage of long-term homeowners, and instead higher percentages of recent renters. Next week we will look at how income plays a role in homeowner and rental markets in Detroit.


Number of Robots Increasing, But Not Unemployment Rates

The data we’ve presented on robots in Michigan are clear. Their numbers are increasing. And the interpretation of those numbers by some economists are also clear. A recent Detroit Free Press article, on a Brookings study says that M.I.T and Boston University researchers currently estimate that the addition of one robot per 1,000 workers leads to the unemployment of up to six workers. So, unemployment might be going up as robots increase? But no.

While the number of industrial robots in use has increased throughout the State of Michigan between 2010 and 2015 the unemployment rates for the affected Metropolitan Statistical Area’s (MSA) have not. For example, in the Battle Creek MSA the Brookings Institute Analysis of International Federation of Robotics Data found there were about 17 industrial robots per 1,000 workers in 2015, this equated to a total of about 840 industrial robots in use in the Battle Creek area in 2015. Also, in 2015 the unemployment rate for the Battle Creek MSA was 5.1 and in 2010 the unemployment rate for that area was 11.7. A substantial decrease.

In the Detroit Metropolitan area, the number of industrial robots in use has nearly tripled since from 5,752 in 2010 to 15,115 in 2015. If each robot is worth more than one job as the economist projects, then that would mean a lot of unemployed people. But the unemployment rate fell from 13.9 in 2010 to 5.9 in 2015. According to the Michigan Department of Management, Technology and Budget none of the State’s 14
MSA’s experienced an increase in the unemployment rates between 2010 and 2015. So, more robots, but a decrease in unemployment? Well, maybe, but some might say we’re mixing up a macro trend—the overall
expansion of the economy since the 2008 recession—with a more micro process—the increase in the number of robots, which would not have so large an effect as to decrease overall unemployment. There still might be an effect, but at a lower level. And it might be consistent with recent findings from University of
Michigan economists who are indicating that the expansion has brought back only about 73 percent of the jobs lost in the recession.

Where are the other 27 percent? Robots and offshore, perhaps?


Industrial Robot Use Concentrated in Michigan, Auto Industry

The number of industrial robots used throughout Michigan increased by 14,785 between 2010 and 2015, according to the Brookings Analysis of International Federation of Robotics Data. In 2015 there were about 24,000 industrial robots in being used, according to the data set, an increase from the about 10,000 being used in 2010. According to the Brookings data set, the auto industry utilized the highest number of industrial robots at a total of about 233,000 throughout the U.S. in 2015. With Michigan being the automotive capital of the country it should come as no surprise that the state had the highest concentration of industrial robots in 2015. According to the data set, 12 percent of the industrial robots in use in 2015 were concentrated in Michigan; 8.7 percent of the nation’s total of industrial robots were concentrated in Ohio in 2015 and 8.3 percent were concentrated in Indiana.

When examining the data at the local level, it shows that the Detroit-Warren-Dearborn Metropolitan area had the highest number of industrial robots in both 2010 and 2015. In 2010 there were 5,753 industrial robots being utilized in the Detroit-Warren-Dearborn Metropolitan area and in 2015 that number increased to 15,115. Followed by the Detroit Metropolitan area, the Grand Rapids Metropolitan area had the second highest number of industrial robots being utilized in the state, according the data set. In 2010, there were 1,091 industrial robots being used and by 2015 that number increased to 3,102.

While the Detroit Metropolitan area had the highest number of industrial robots, it was the Battle Creek Metropolitan area that had the highest number of robots per 1,000 workers in 2015. According to the data, the Battle Creek Metropolitan area had about 17 robots per 1,000 workers while the Detroit Metropolitan area had 8.5 industrial robots per 1,000 workers. The Jackson Metropolitan area had 8.8 industrial robots per 1,000 workers in 2015, according to the data set.

Next week we will explore how industrial robots correlate to unemployment rates in Michigan.

Detroit Has Highest Number of Confirmed Hepatitis A Cases from Outbreak

A Hepatitis A outbreak has been ravaging through Southeastern Michigan since August of 2016, according to information from the Michigan Department of Health and Human Services. The Michigan Department of Health and Human Services has data on the number of confirmed cases of Hepatitis A from Aug. 1, 2016 to Feb. 20, 2018; this data is broken down at the county level, with the City of Detroit also being included. A closer look at draft summary data from the Michigan Department of Health and Human Services shows that the number of confirmed outbreak related cases really started to increase in July of 2017.

The Hepatitis A disease is a liver infection that is spread person-to-person. An individual can contract Hepatitis A from contaminated food or drink of from contact with an infected individual. Since the outbreak struck the Metro-Detroit area there have been numerous news stories related to individuals infected with Hepatitis A working at different restaurants. Attention to these situations has been part of the public outreach process not only to inform individuals about potential contamination if they ate at a restaurant with a confirmed Hepatitis A case, but to also raise awareness about the regional outbreak to all citizens.


The Michigan Department of Health and Human Services states that there is no common source of food, beverage or drug identified as the potential source of infection. The Department also states that transmission appears to be through illicit drug use with direct person-to-person contact; those with a history of drug use, incarceration, transient housing and/or homelessness appear to be at the highest risk.

According to the data, Macomb County has had the highest number of confirmed cases since Aug. 1, 2016 at 211. The City of Detroit came in second with a total of 161 confirmed Hepatitis A cases between Aug. 1, 2016 and Feb. 20, 2018. In Wayne County there were 132 confirmed cases. Throughout the state there have been 760 confirmed Hepatitis A cases since Aug. 1, 2016, 615 of which have resulted in hospitalization and 25 of which have resulted in death. The number of confirmed cases in Macomb County makes up 28 percent of the total confirmed cases in Michigan and the number of confirmed cases in Detroit makes up 21 percent. The only other county in the state to have more than 100 confirmed Hepatitis A cases since Aug. 1, 2016 was Oakland County; according to the data there was 103 confirmed cases.


In addition to the data highlighting how the Hepatitis A outbreak is concentrated in the tri-county region, the data also shows that the median age of those infected with Hepatitis A since Aug. 1, 2016 is 41 and 35 percent of those with a confirmed case of Hepatitis A are female.