Most Detroit residents employed in health care, educational services, and social assistance industries

This post is an extension of last week’s (link here), in that we are showing which industries draw the most about of Detroit residents, ages 16 and older, for employment. Here  we examine the types of jobs by percentage of the working population in the City of Detroit in 2011, according to the five-year American Community Survey. To learn more about the specific occupations included in the different industries described  in this post please click here.

In reviewing the maps, a pattern similar to the region is reflected. The structure of the local economy is based around health care, educational services, social assistance, manufacturing, arts, entertainment, and food service industries.

According to the map, in the health care, educational services, and social assistance industries there were about 20 Census tracts that had 41 percent or more of the population employed in these services. There were also about 75 Census tracts where between 30 and 40 percent of the population was employed in these industries in 2011.The other top industries in which Detroit residents were employed in for the year 2011 were the arts, entertainment and recreation, accommodation, and food service industries. There were about 40 Census tracts in the city were 20 percent or more of the residents were employed in these industries. Manufacturing also had a large employment draw in the city; there were about 35 Census tracts within Detroit where 20 percent or more of the 16 years and older population was employed in the manufacturing industry.

Agriculture was the industry with the least amount of Detroit residents employed in it. All but five of the Census tracts had 5 percent or less of the population employed in the industry. The information and construction industries also had low draws. There was a pocket in southwest Detroit though where there was about 15 Census tracts in 2011 with 15 percent or more of the population employed in construction.

Health services, manufacturing dominate area

Manufacturing, health, social services and education  were the predominant industry occupations in Southeastern Michigan and the tri-county area in 2011, according to the five-year American Community Survey. The agriculture, forestry, hunting and fishing industries had the smallest proportion of people employed in the area for same time period.

In this post, we examine the types of jobs by percentage of the working population in Southeastern Michigan and the tri-county area and the City of Detroit as a whole. To learn more about the specific occupations included in the different industries described  in this post please click here.

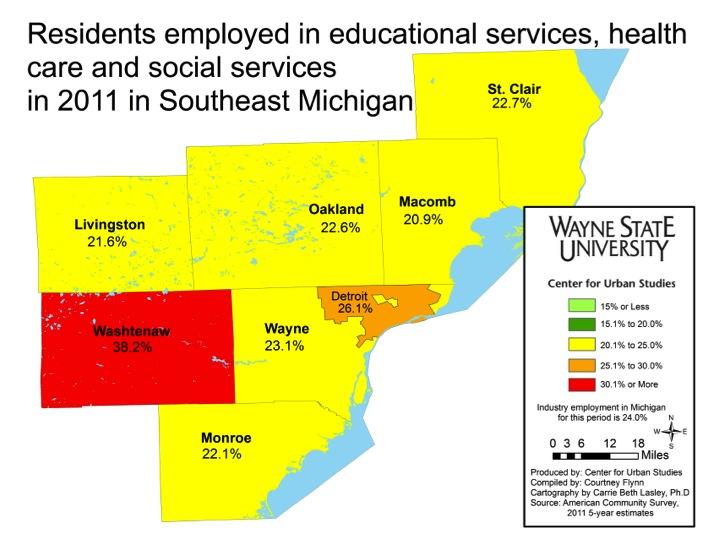
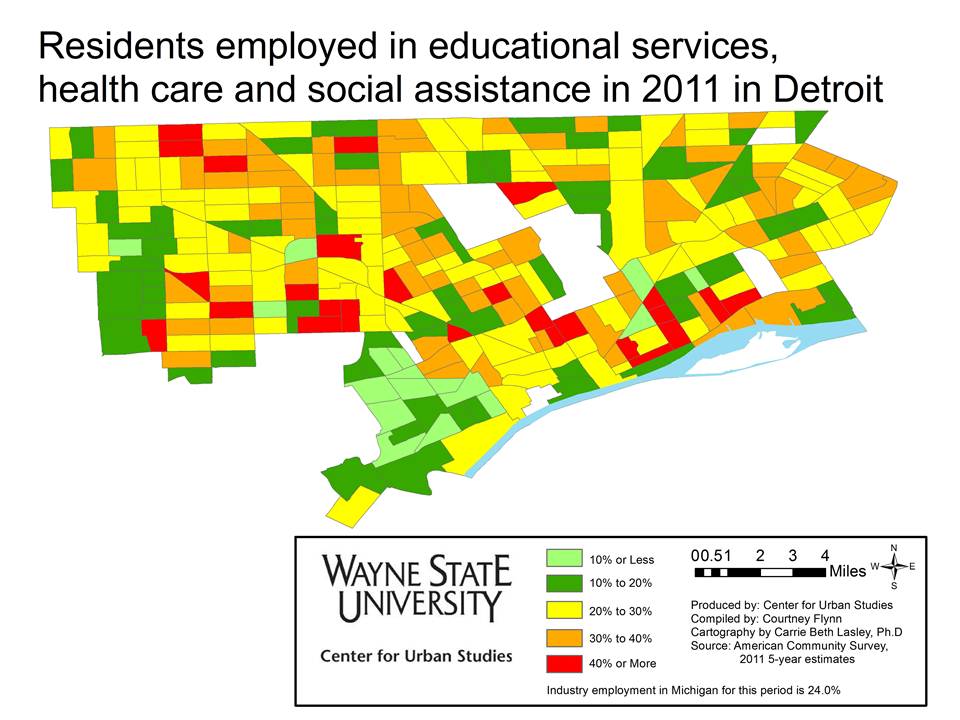
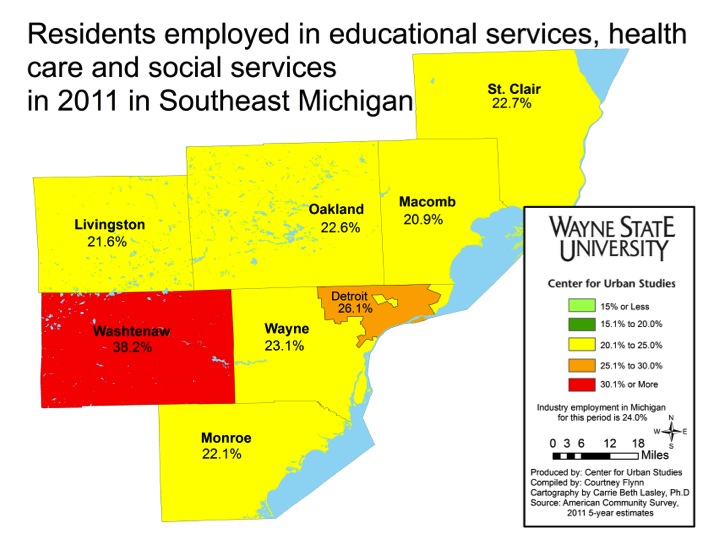
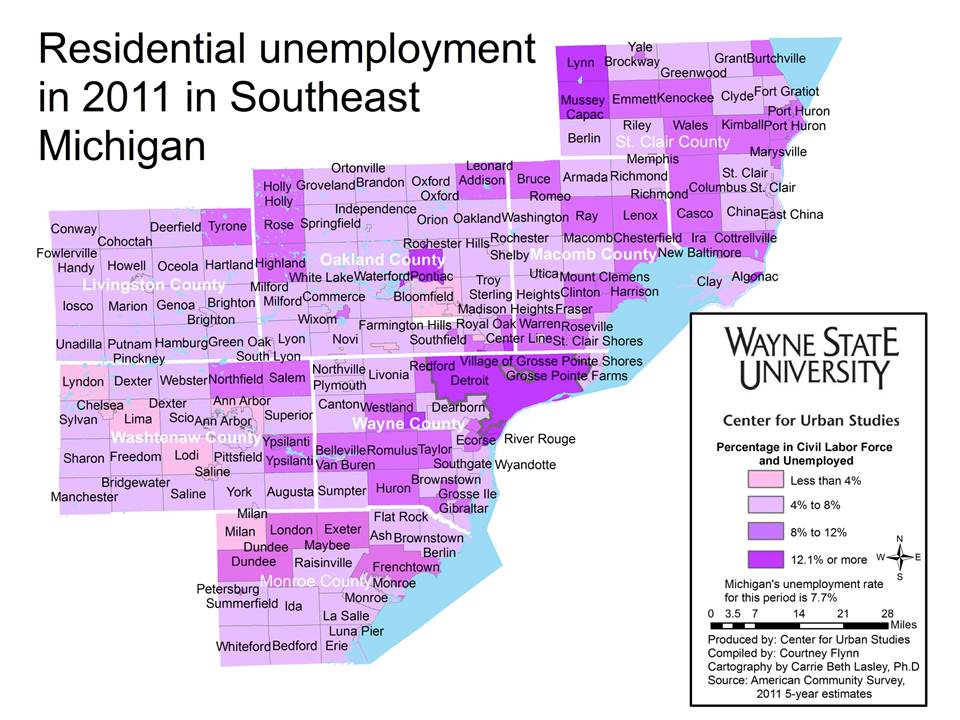
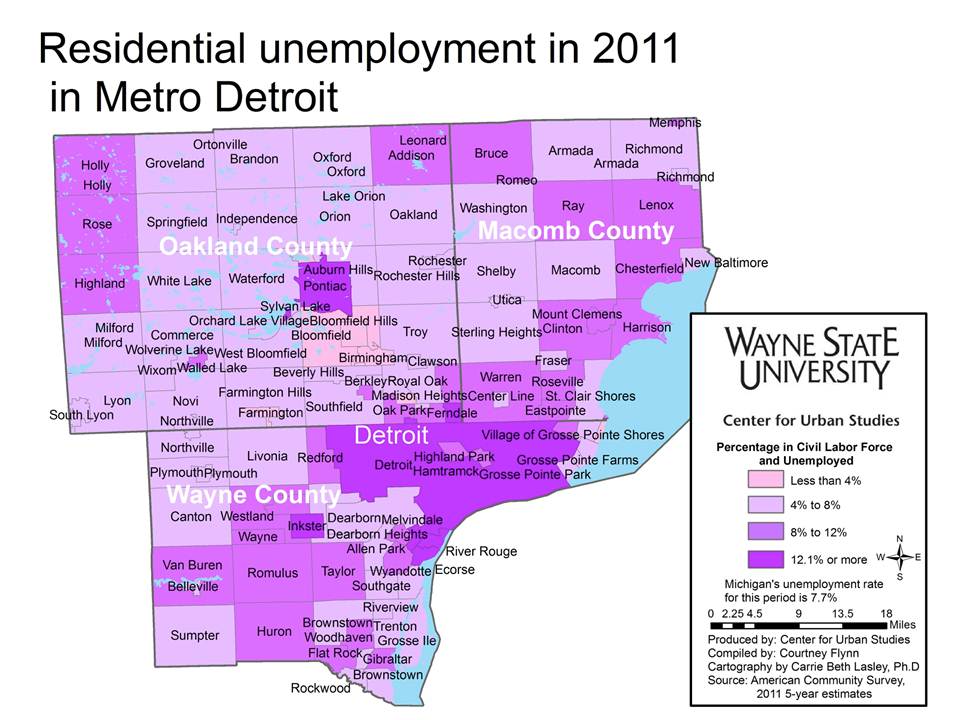
Washtenaw County had the largest percentage of residents employed in educational services, health care and/or social services. Of the employable population over the age 16, 38.2 percent were employed in such fields. This may be due to the fact that Ann Arbor, in Washtenaw County, is home to the University of Michigan and University of Michigan Hospital, St. Joseph Mercy Hospital and a VA Health Care Center. Detroit, which will be further explored in our next post, had 26.1 percent of its residents employed in these industries. Wayne State University is located in Detroit, as is the Detroit Medical Center, Henry Ford Hospital, and a VA Health Care Center.

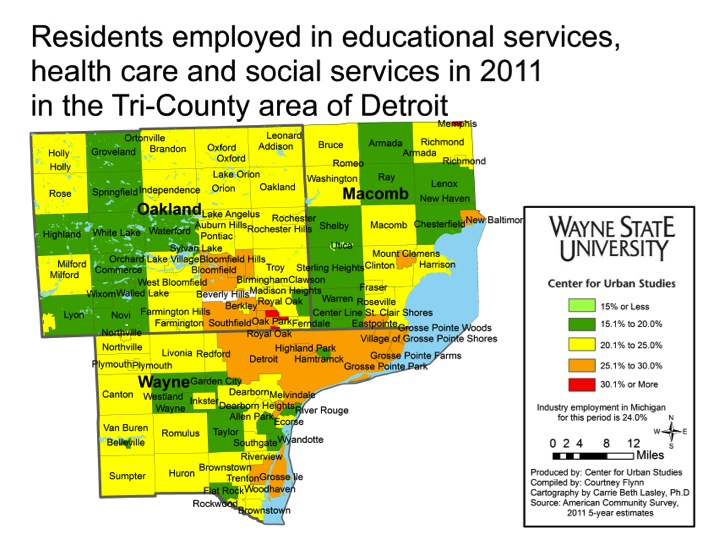
Macomb County had the fewest number of residents employed in these industries, at 20.9 percent, however, the cities of New Baltimore, Eastpointe, and Mount Clemens had between 25.1 and 30 percent of its residents employed in these industries..

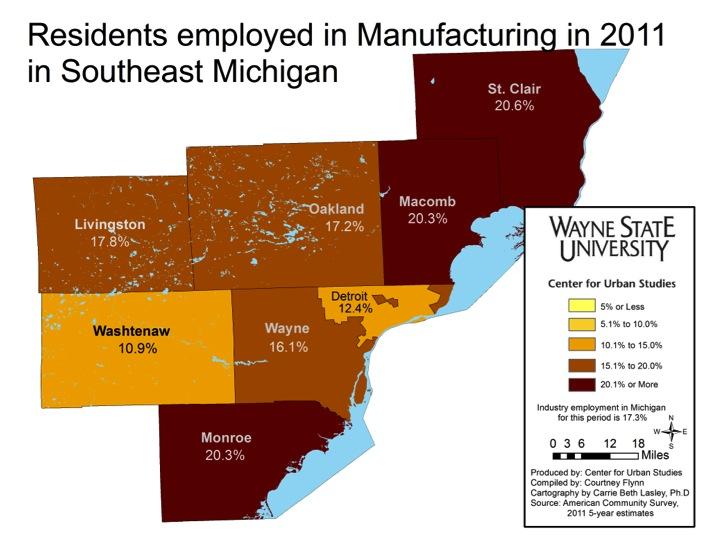
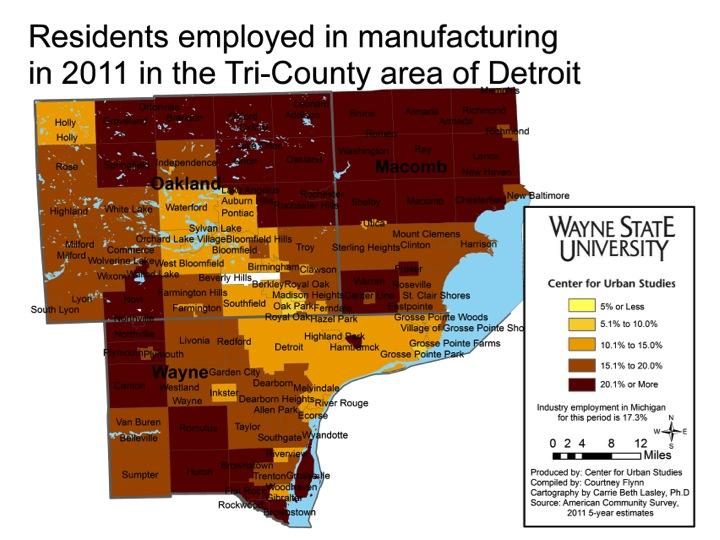
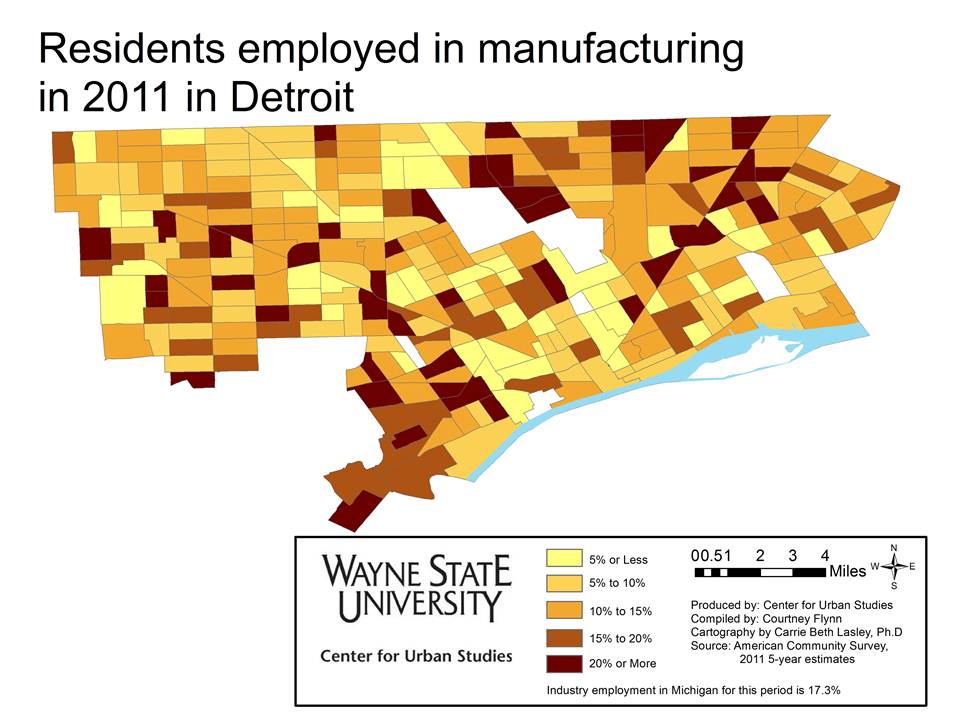
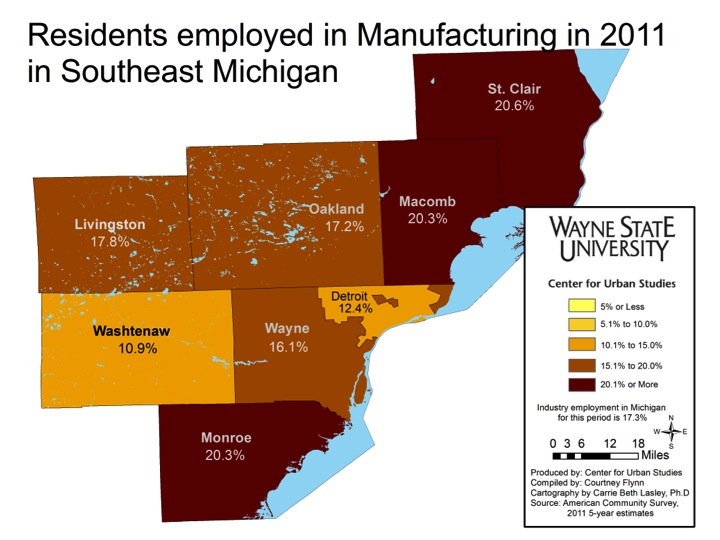
Of the seven counties in Southeastern Michigan, Wayne had the fewest percent of residents employed in the manufacturing industry, at 16.1 percent. St. Clair County had the most at 20.6 percent and Macomb and Monroe counties came in at a close second with 20.3 percent.

There was no municipality in the tri-county area where fewer than 5 percent of the residents were employed in manufacturing.

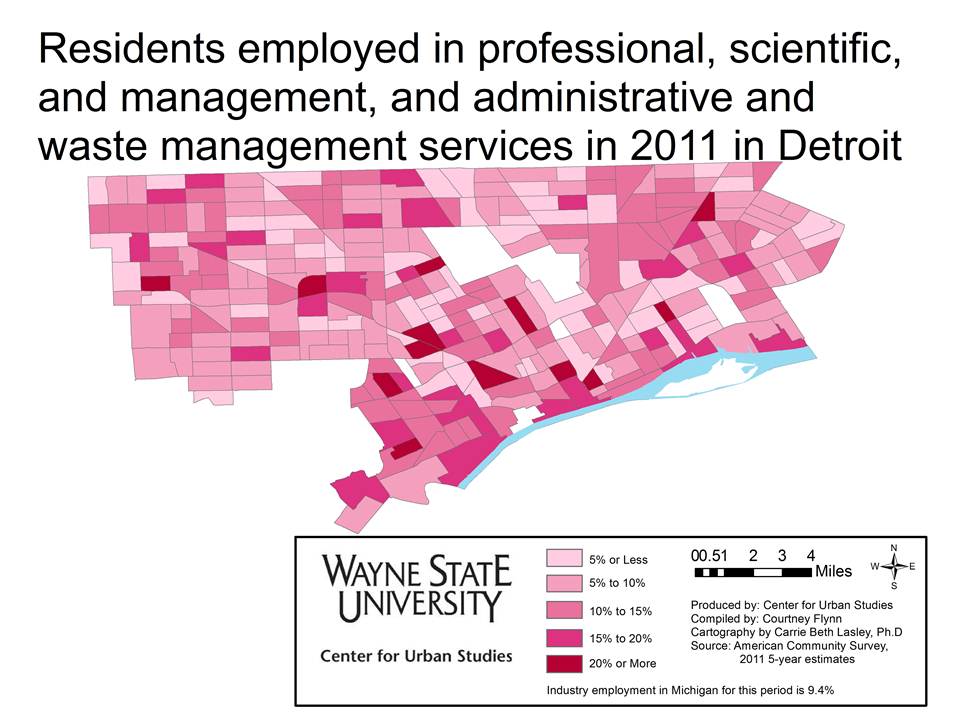
In the tri-county area, Oakland County, along with northwestern Wayne County, had several municipalities where more than 12 percent of the population was employed in professional, scientific, management, administration and waste services industries. Much of Macomb County had between 9.1 and 12 percent of the residents employed in one of those fields.

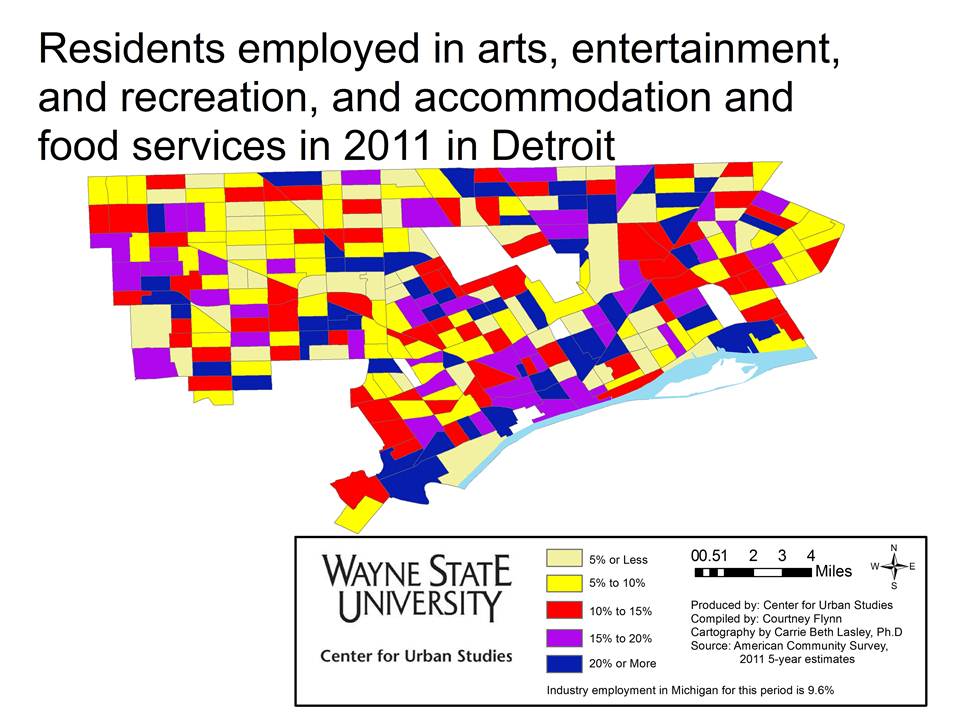
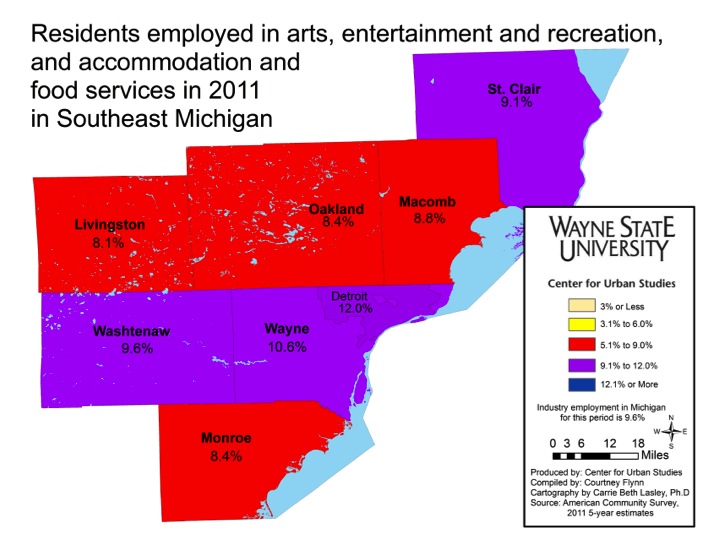
For the arts, entertainment and recreation, and accommodation and food services industries, the highest percent of the population employed across Southeastern Michigan is in the City of Detroit at 12 percent in 2011. Wayne County is the county in the region with the highest percent of its population employed in such occupations, and Livingston County has the fewest at 8.1 percent.

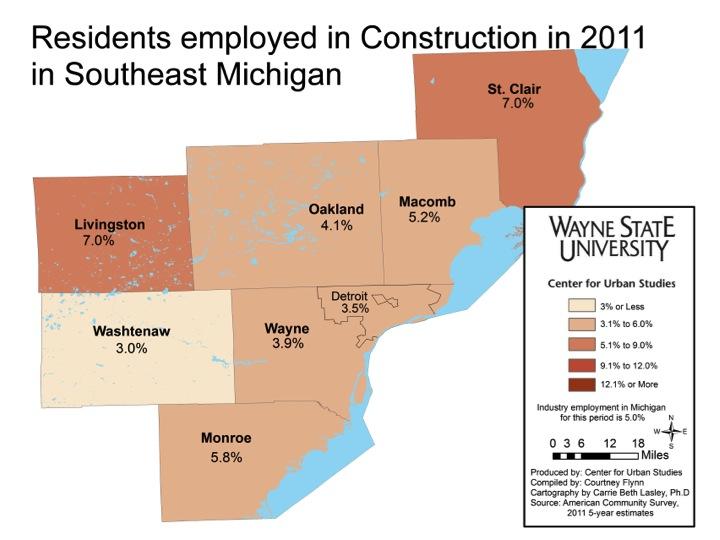
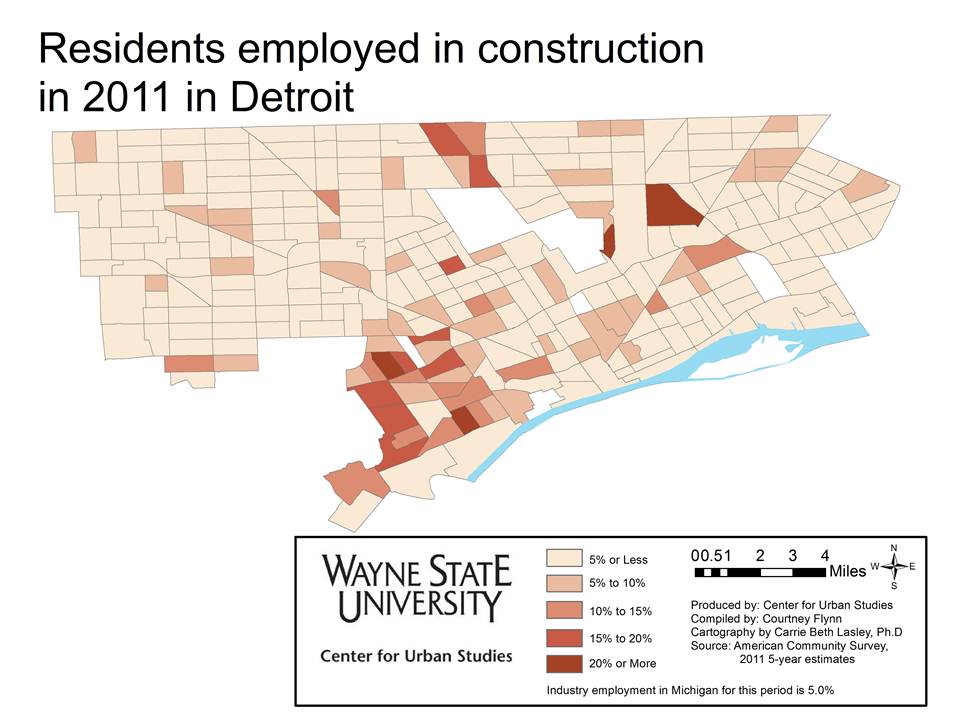
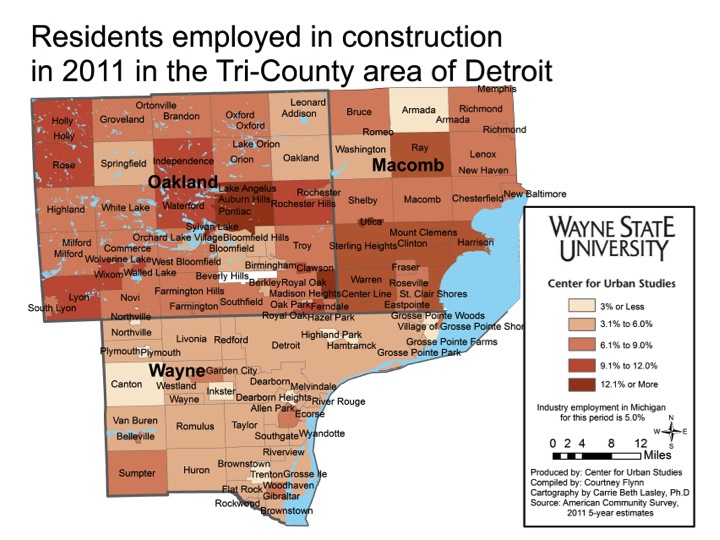
St. Clair and Livingston counties had the highest percentage of residents employed in construction in 2011, at 7.0 percent each. However, the cities of Auburn Hills and Pontiac in Oakland County had more than 12.1 percent of their population employed in the field.

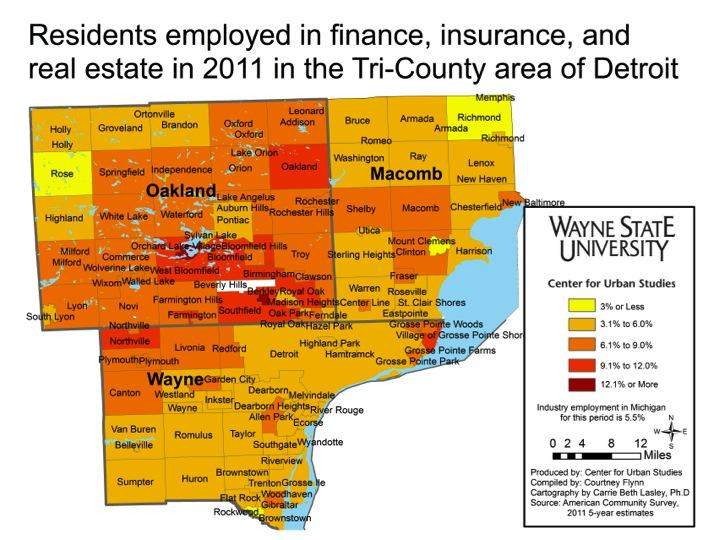
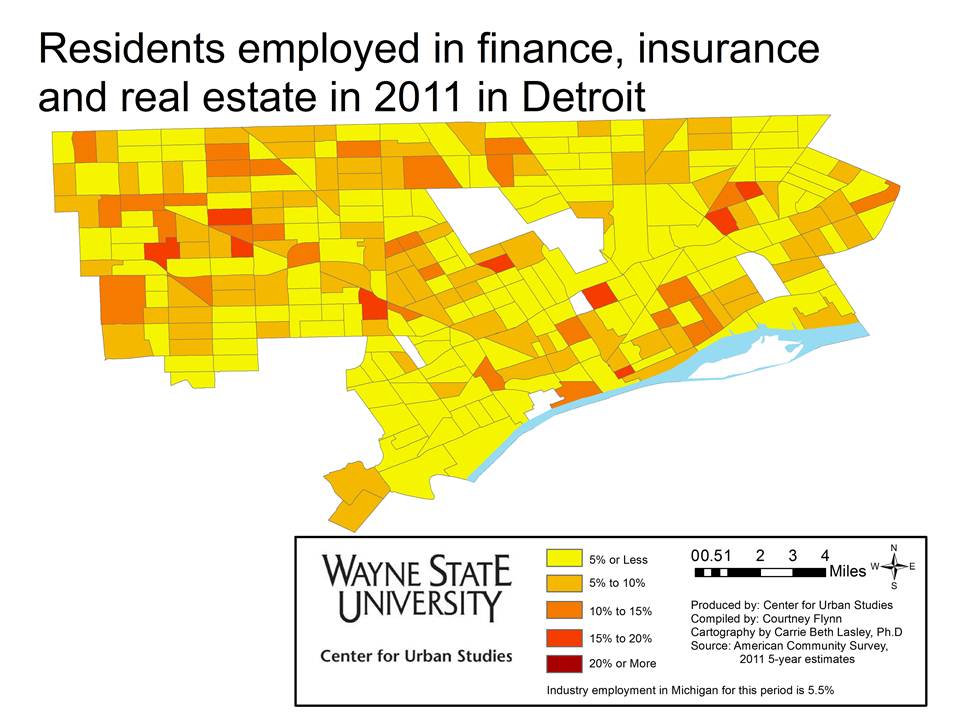
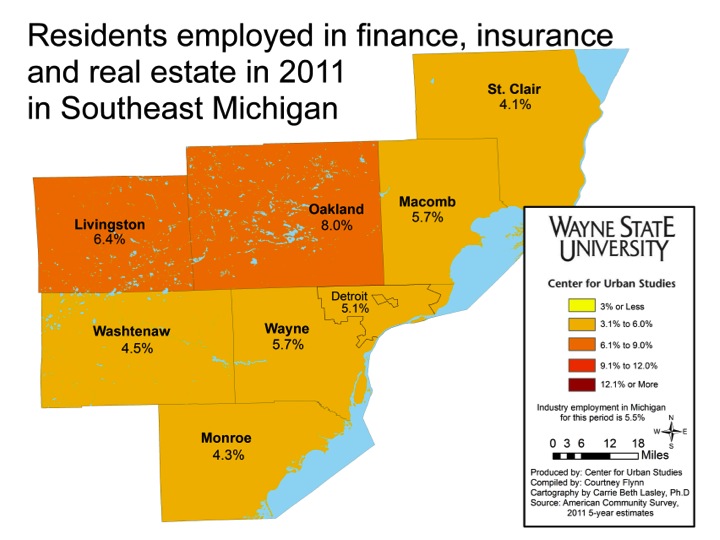
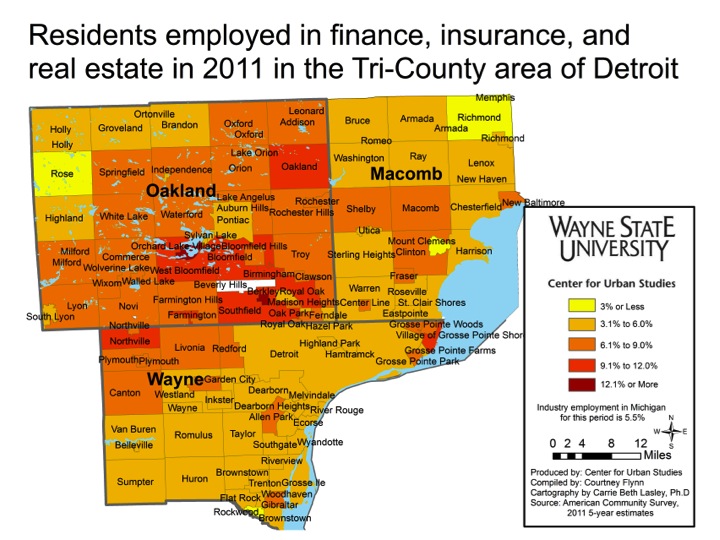
Finance, insurance, real estate, (FIRE) was a more common industry for residents from Oakland County at 8 percent; Livingston County came in second at 6.1 percent. There were two municipalities in Oakland County where 12.1 or more of the population was employed in one of those fields – Orchard Lake and Lathrup Village.

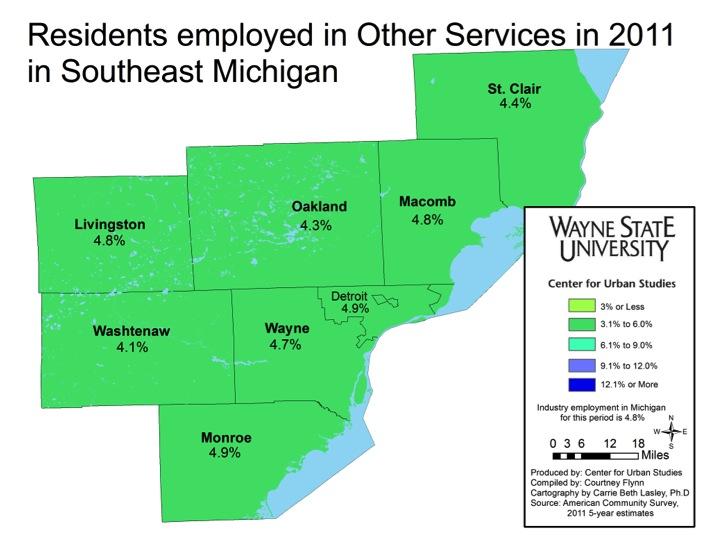
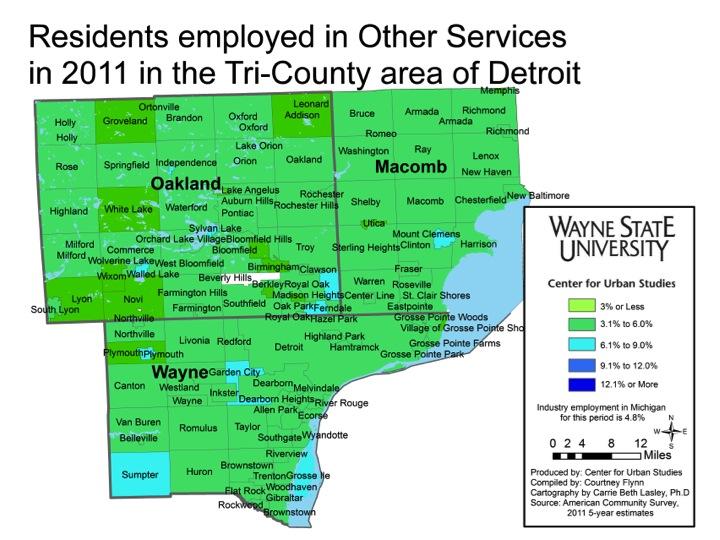
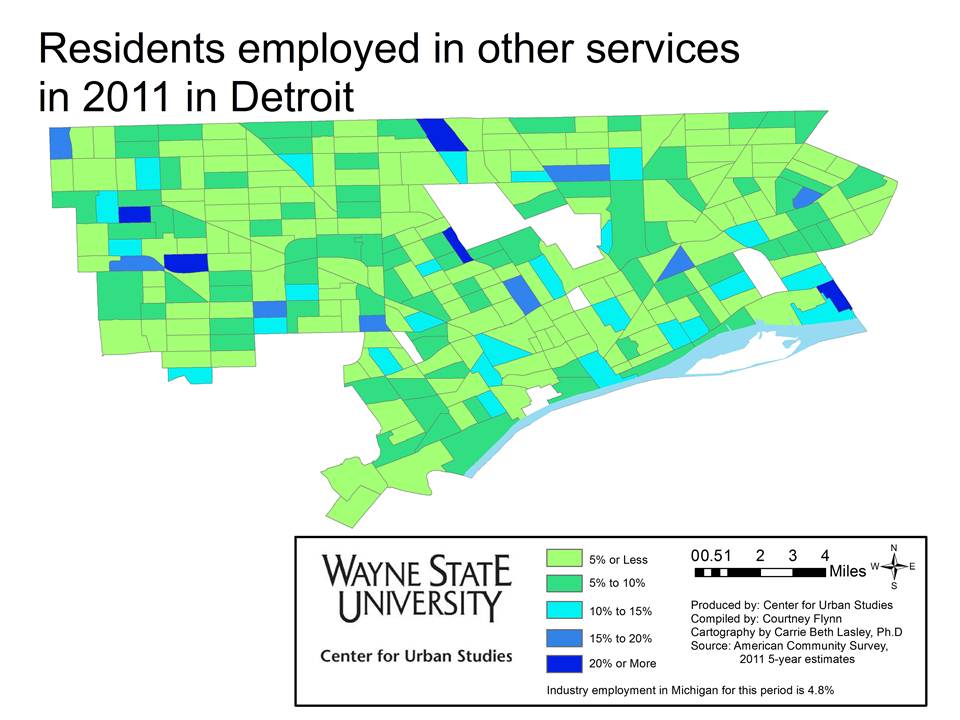
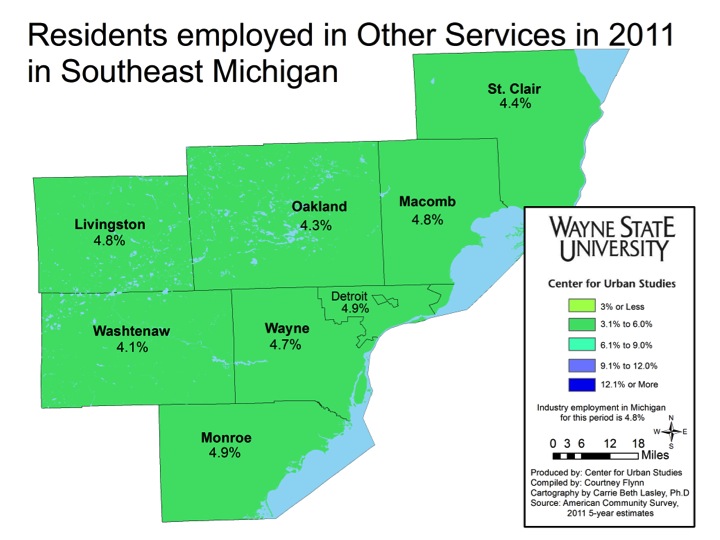
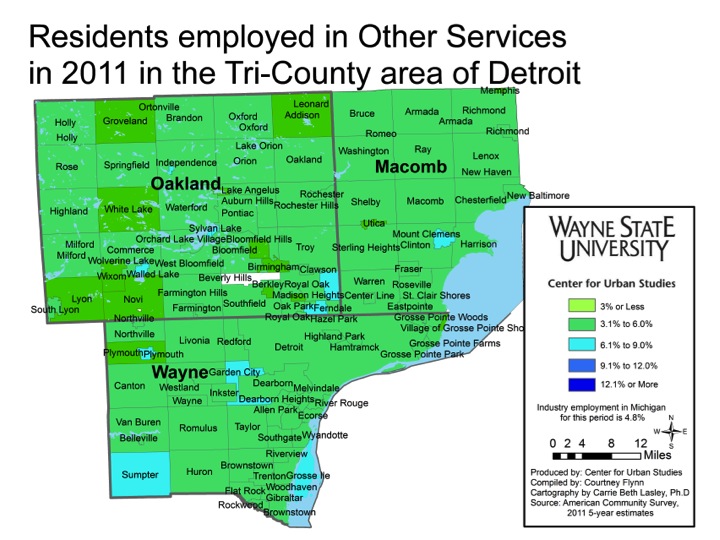
The percent of residents across the seven-county region employed in other services, which includes such jobs as mechanics, repairmen, launders and veterinary services fields, is distributed fairly evenly, ranging from 4.1 to 4.9 percent. Sumpter Township, Garden City, Grosse Ile, Dearborn Heights, Ferndale, Clawson, and Mount Clemens were all municipalities where between 6.1 and 9 percent of the populations were employed in the other services.

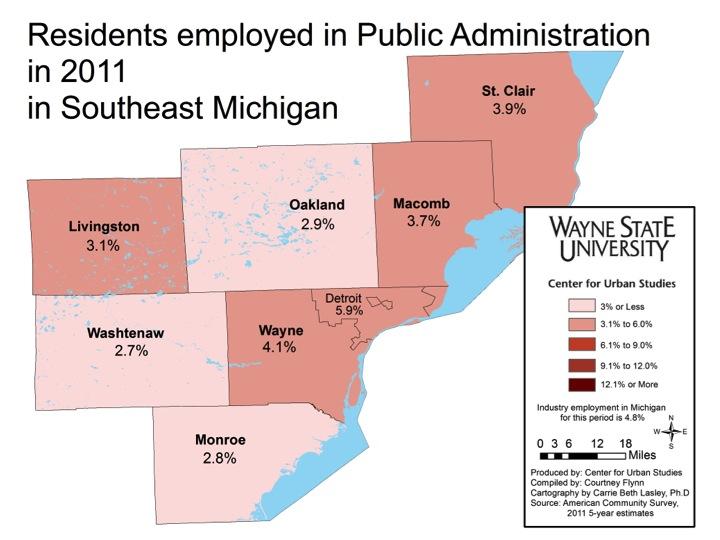
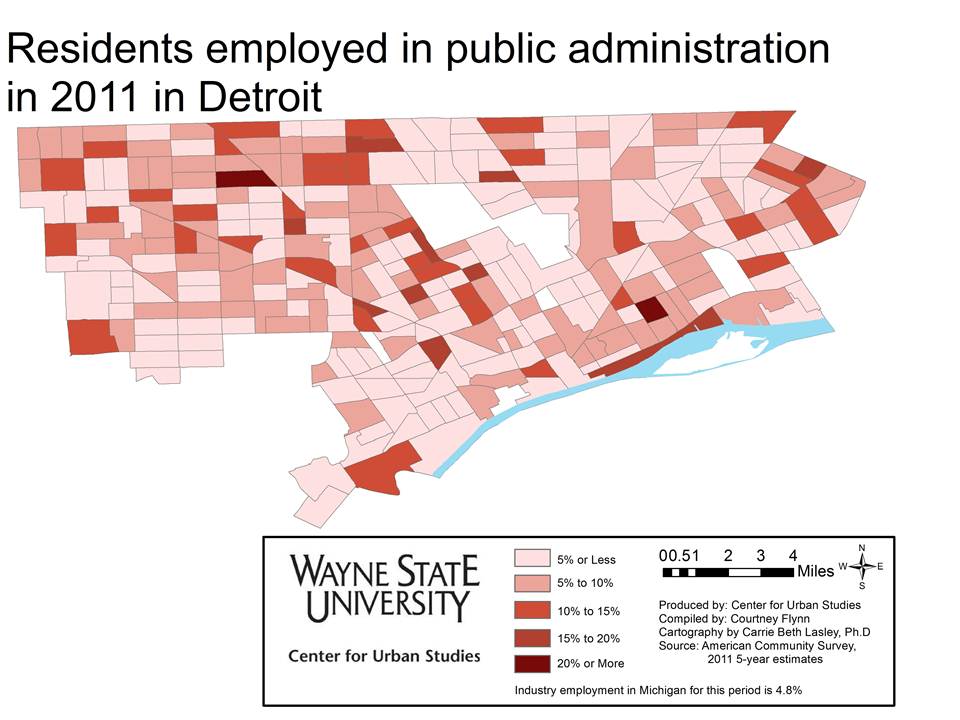
The City of Detroit had the highest population employed in Public Administration at 5.9 percent. Of all the counties in Southeastern Michigan, Wayne County had the highest number of employed at 4.1 percent.

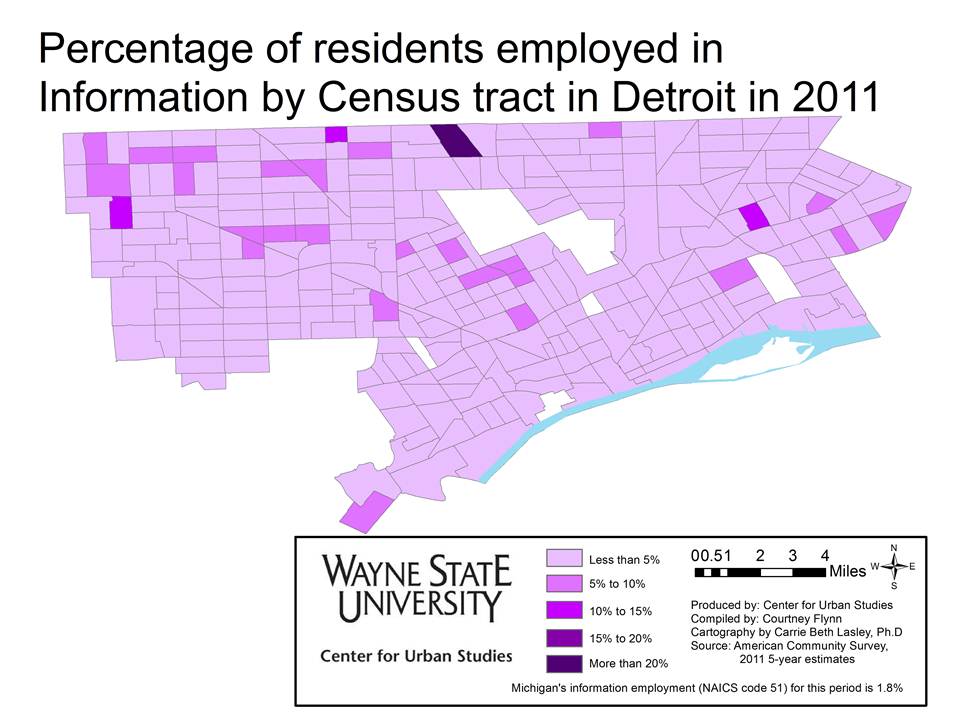
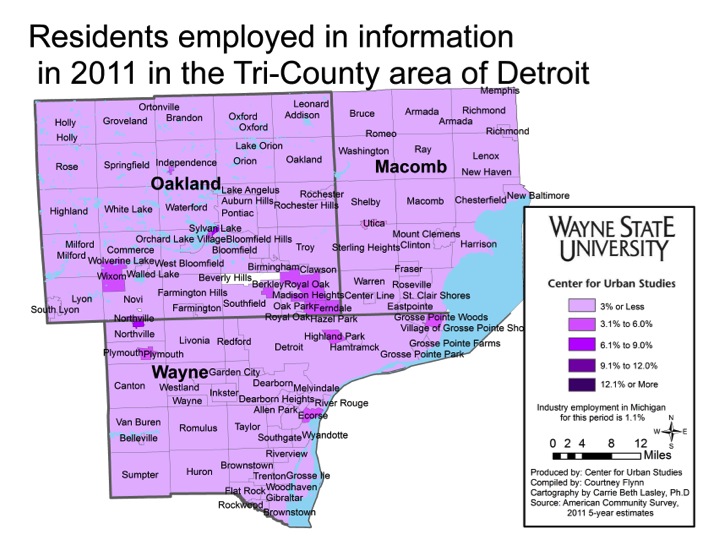
Although information services is described to be a growing field, less than 3 percent of the populations that makeup Macomb, Oakland, and Wayne counties are employed in this industry. The exceptions are residents in Royal Oak (3.1), Wixom (3.1),the cities of Highland Park (3.2), Hazel Park (3.2), Clarkston (3.3), Keego Harbor (3.5), Ferndale (3.7), Plymouth (3.8), Ecorse (4.0), Grosse Pointe Woods (4.3), Huntington Woods (4.3), Pleasant Ridge (4.6) Lathrup Village (5.7), Northville at (6.4) percent and Sylvan Lake at (6.9) that are employed in the field.

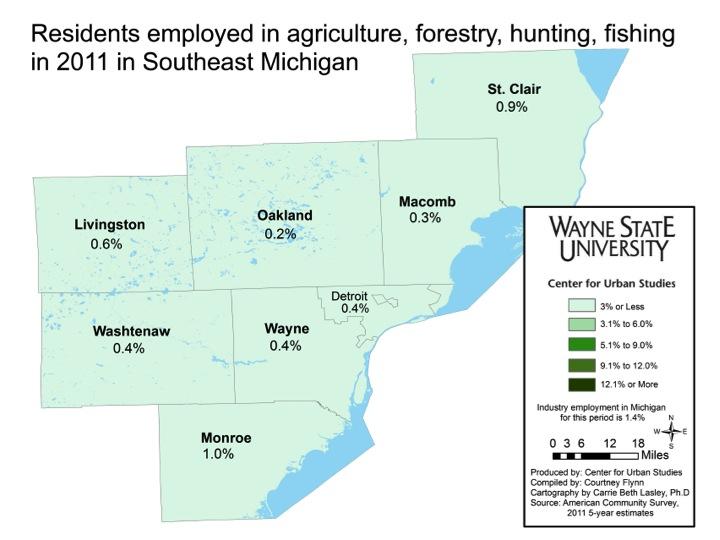
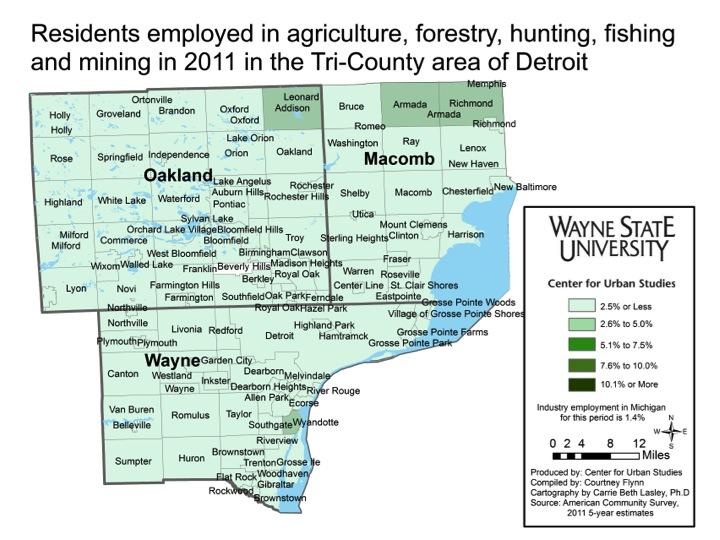
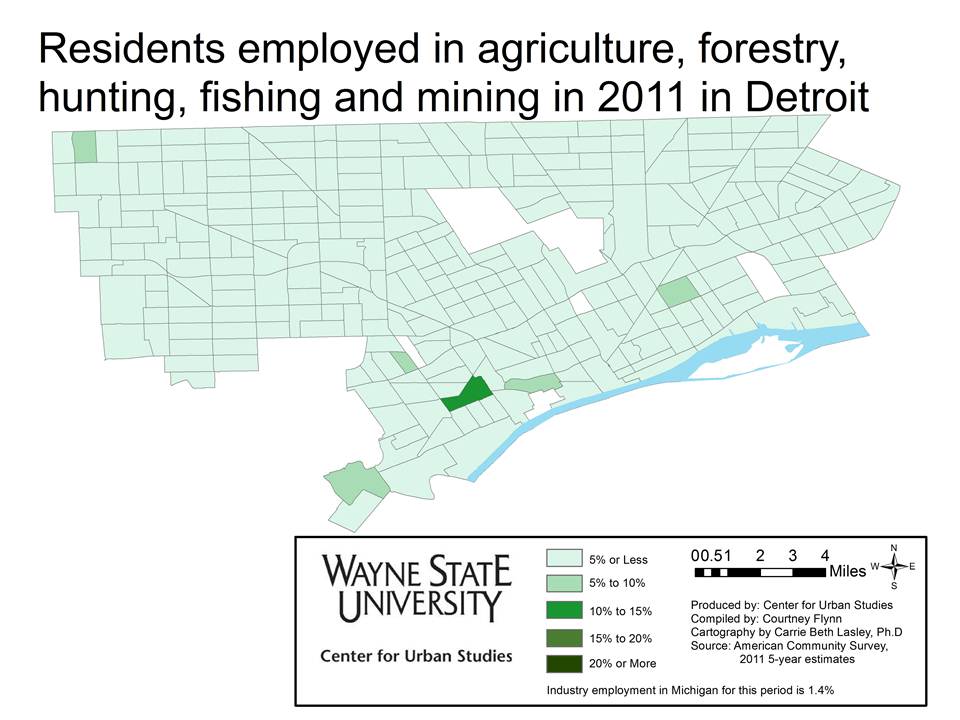
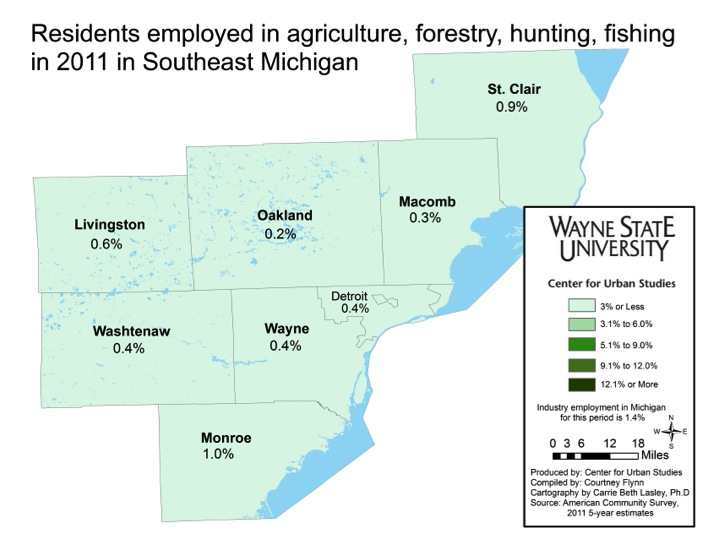
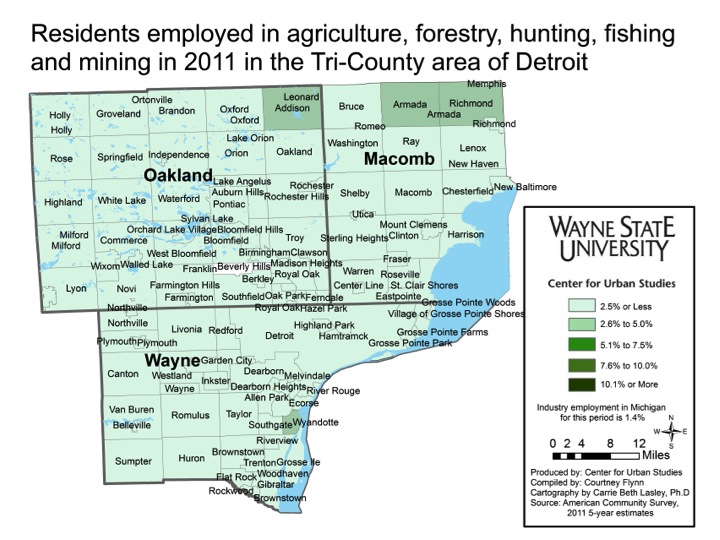
None of the seven counties in the region boast a population in which more than 1 percent is employed in the agriculture, hunting, fishing, or forestry fields. Monroe County has the highest population at 1 percent. The cities of Leonard and Addison in Oakland County; Armada, Richmond, and Memphis in Macomb County; and Wyandotte in Wayne County had between 2.6 and 5 percent of its population employed in one of the above-mentioned fields.

Detroit’s jobless historically higher than the Southeast Michigan region

In this post long-term employment data for Southeast Michigan is presented, including information for the City of Detroit and the region’s seven counties. As can be seen in the following charts, while Wayne County and the City of Detroit have experienced a loss of labor force and jobs, the less populous counties have fared better in recent times, particularly Livingston County.

The four charts below examine annual, unadjusted, employment data from 1970-2012. Please note that there was a change in methodology from 1989 to 1990, according to the Michigan Department of Technology, Management and Budget (MDTMB). Because of the change, Bruce Weaver of the Michigan Department Management, Technology and Budget warned that numbers may not be fully comparable.

According to the Bureau Labor Statistics, the various categories to describe unemployment “use data from several sources, including the Current Population Survey, the Current Employment Statistics program, State UI systems, and the decennial census, to create estimates that are adjusted to the statewide measures of employment and unemployment. Below the labor market area level, estimates are prepared using disaggregation techniques based on inputs from the decennial census, annual population estimates, and current UI data. This is the current methodology being used.”

The jobless rate is the percent of the labor force that is unemployed at a given time. Since 1975 the City of Detroit’s jobless rate has remained higher than the rates of the surrounding counties. For example, in 2009, Detroit’s jobless rate reached an all-time high of 24.9 percent, while at that same time the jobless rate in Washtenaw County was 8.4. Although the jobless rate has been declining since 2010, Detroit’s was still recorded at 18.4 percent in 2012. For Washtenaw County, which has consistently had the lowest jobless rate in the region since 1979, it was recorded at 5.7 percent for 2012.

According to Bureau of Labor Statistics, the labor force is, “all persons classified as employed or unemployed.” For the following three charts, please keep in mind that population numbers are closely related to the labor pool. For more information on population, please view this previous post. While Wayne County’s labor force has been primarily declining since 1979, the labor force for both Macomb and Oakland counties increased from 1984 to 2000. Both decreased after 2000. Livingston County has experienced a gradual increase its labor force since at least 1984. The labor force in Monroe and St. Clair counties has also inched up, but these two counties have experienced the least amount of change. In 2012, Detroit’s labor force was recorded at 343,856 and Wayne County’s was recorded at 816,059. This represents a 45 percent decline in Detroit’s labor force since 1970, when it was 624,475, and Wayne County’s was 1,090,505.

Unlike the labor force and employment numbers, the number of unemployed in the seven-county region has been much more erratic, linked to the ups and downs in the economy. All counties, along with the City of Detroit, experienced a peak in their unemployment numbers in 1982 and then again in 2009, with smaller peaks in 1974 and 1993. The counties with the smaller populations –Livingston, Monroe, St. Clair, and Washtenaw –have experienced the least amount of change.

Although the City of Detroit has a smaller population than Oakland and Macomb counties, its unemployment numbers have typically been higher. For example, in 2012 there were 63,836 unemployed people living in the City of Detroit, there were 41,530 in Macomb County and 37,570 in Oakland County.

For the record, the Bureau of Labor Statistics, an unemployed person is described as someone“16 years and older who had no employment during the reference time, were available for work, except for temporary illness, and had made specific efforts to find employment sometime during the 4-week period ending with the reference week. Persons who were waiting to be recalled to a job from which they had been laid off need not have been looking for work to be classified as unemployed.”

The graphs showing decline in the labor force in the area are similar to those for the number of employed persons. Wayne County and Detroit experienced the largest declines, while Oakland and Macomb counties have experienced the greatest increases . Declines for most counties and cities in Southeast Michigan began in 2000. Beginning in 2007, all areas experienced a steep decline the number of employed, as reflective of the beginning of the recession. In 2009, employment numbers did begin to increase again

Reported lead releases into the environment up dramatically from 2002 to 2012 in Southeast Michigan

A number of national and international environmental incidents in the early 1980s led to the federal Emergency Planning and Community Right-to-Know Act (EPCRA) in 1986. EPCRA mandates all facilities that handle or produce at least 10,000 pounds of any of 650 chemicals known to be harmful to humans or the environment annually report any releases into the environment This information is made available to the public via the Toxic Release Inventory (TRI).

In this post we will examine releases of two of those 650 chemicals – lead and lead-based compounds. For those interested in learning the effects of lead please click here.

Below is a map showing the location of the 2012 releases of lead and lead-based compounds in the Southeast Michigan area.

In Southeast Michigan, 38 of 87 reporting facilities indicated they had no on-site releases into the land, water or air (These are 0’s on the map). The largest releases Southeast Michigan was Wayne Disposal, in Belleville, which reported more than 52,000 pounds of lead or lead-based compounds. How much of this stays in landfills versus gets released by air or water is not reported. This facility is a landfill that receives toxic waste, including being the only recipient of polychlorinated byphenols (PCBs) in the State of Michigan. In addition to skilled waste handlers, power generation is another top contributor to lead releases, with DTE and other generating plants along rivers and lakes releasing large quantities of lead and lead-based compounds, well over 60,000 pounds.

Wayne Disposal, the region’s largest reporter of releases lead and lead-based-compounds (52,318 pounds), is located in Wayne County, along with about 35 other facilities. It may be reasonable to assume that the vast majority of this went into their landfill, but no data is provided about the specifics beyond the amounts. There are a total of 36 facilities reporting in Wayne County; altogether these facilities reported releasing a total of 54,366.91 pounds in 2012, as shown on the map below. There is a concentration of facilities reporting releases of lead and lead-based-compound in and near Southwest Detroit. However, the largest reported releases in Detroit were from the GM Detroit-Hamtramck Assembly Plant, which is bisected by the southern border of Hamtramck and Detroit.

Releasing just over 455 pounds of lead-based compounds into the air in 2012, the GM Detroit-Hamtramck Assembly Plant is large, as well as near areas of dense settlement. Using software developed by the U.S. Military and adapted for use by the Environmental Protection Agency, we used dominant weather conditions to determine the approximate area in which these compounds, emitted from on-site stacks, may fall. The result is shown on the map below. The tri-color cone is the area most likely to be impacted because of dominant weather conditions (Winds 10 mph, 58oF, partly cloudy). The circle includes areas impacted by changing wind directions. Additional clouds, wind or precipitation could create a wider pattern of impact. Within the circle, live 5,963 people in 1,997 housing units (2010 Census). There are also three schools (Hanley, Holbrook and Oakland International) and one park with athletic facilities (Veterans in Hamtramck). Oakland International Academy falls under the cone of dominant exposure.

This set of estimates are based on a centroid in the northern area of the site, near cooling towers, but the results could vary depending on the specific location on the site where releases occur. There appear to be several large stacks and many small stacks on the site.  Some stacks are located further east on the site, which would yield estimates that cover more residential areas in Detroit.

Releasing just more than 455 pounds of lead-based compounds in 2012, the GM Detroit-Hamtramck Assembly Plant is large, as well as near areas of dense settlement. Using software developed by the U.S. Military and adapted for use by the Environmental Protection Agency, we used dominant weather conditions to determine the approximate area in which these compounds, emitted from on-site stacks, may fall. The result is shown on the map below. The tri-color cone is the area most likely to be impacted because of dominant weather conditions (Winds 10 mph, 58oF, partly cloudy). The circle includes areas impacted by changing wind directions. Additional clouds, wind or precipitation could create a wider pattern of impact. Within the circle, live 5,963 people in 1,997 housing units (2010 Census). There are also three schools (Hanley, Holbrook and Oakland International) and one park with athletic facilities (Veterans in Hamtramck). Oakland International Academy falls under the cone of dominant exposure.

NOTE:The software Aloha and Marplot were used to used to estimate the spread of lead pollution in the area.  In Aloha lead pollution can not be estimated so mercury was used as a proxy. The weight of lead per cubic inch is 0.39 lbs; the weight of mercury is 0.49 lbs. per cubic inch.

To better understand the increase in lead pollution, we examined how lead was released into Wayne County. TRI documents releases into all mediums of the environment, breaking them down into details. Aggregating the categories into the three major environmental mediums – air, water and land, we can see that which methods of lead pollution has changed dramatically over the decade. In 2002, air pollution was the predominant medium, accounting for 99 percent of all lead pollution (455 pounds in total from stack releases and fugitive emissions). Since 2002, this amount has increased in aggregate (1,453 pounds in 2012, a 319 percent increase); however, the proportion of reported lead releases into the air has decreased in relation to the total, from 99 percent in 2002 to 3 percent in 2012.

The dramatic increase in reported lead releases has come from land releases – or that stored in landfills or otherwise held on site. In 2012, 96 percent of the total emissions for the region came from a single facility – Wayne Disposal, a toxic waste facility located on the Wayne/Washtenaw border near Belleville. As explained earlier, a facility must report if it handles more than 10,000 pounds of a toxic chemical, whether or not the facility releases the chemical or handles it without a release. Opened in 1997, Wayne Disposal was not handling enough lead or lead-based compounds in 2002 to require TRI reporting. By 2004, Wayne Disposal was handling enough to trigger reporting requirements. Eight years later, it is the largest single reporter in the region, reporting more than 52,000 pounds of lead or lead-based compounds. In future posts we plan to investigate the sources of the lead maintained at the facility. In general, we expect to find that most of the lead is from lead-based paint that is part of demolition debris from older houses in the metropolitan area.


The effects of lead poisoning

What is lead poisoning?

  • Lead is a home health and safety hazard that can harm a child’s brain, causing lifelong learning and behavior problems. When lead dust is ingested or inhaled, even in miniscule amounts, it can cause significant and irreversible brain damage as well as other health problems. Lead dust equivalent of only three granules of sugar can begin to poison a child.1

What are the sources of lead in Detroit?

  • There are two main sources of lead within dwellings – paint and water pipes, though recent research has indicated a substantial portion may come from air pollution, particularly in the summer. In Detroit, most childhood lead poisoning comes from paint. Other sources of lead include soil, particularly around older buildings contaminated by flaking external paint, and adjacent to industrial facilities using (or previously having used) lead or demolished buildings.2
  • Homes built before 1978 have a good chance of containing lead-based paint. In 1978, the federal government banned consumer uses of lead-containing paint, but some states banned it even earlier. Lead from paint, including lead-contaminated dust, is one of the most common causes of lead poisoning.3 Approximately 94% of all houses in Detroit were built before 1980.4

How do kids get poisoned?

  • Deteriorating lead-based paint (peeling, chipping, chalking, cracking, damaged, or damp) is one of the key causes of lead poisoning.  It is especially hazardous when found on surfaces that children can chew or that get a lot of wear-and-tear, such as windows and window sills, doors and door frames, stairs, railings, banisters, and porches. Toddlers who crawl through dust laden floors are particularly vulnerable.3
  • Air-borne lead paint particles can also be inhaled as dust.  Lead can also be ingested through drinking water that has been contaminated as a result of lead pipework or lead-based solder. 12
  • Lead is particularly dangerous to children because their growing bodies absorb more lead than adults do and their brains and nervous systems are more sensitive to the damaging effects of lead. Babies and young children can also be more highly exposed to lead because they often put their hands and other objects that can have lead from dust or soil on them into their mouths.5

What are the impacts of lead poisoning?

In children, the main target for lead toxicity is the nervous system. Even very low levels of lead in the blood of children can result in:

  • Permanent damage to the brain and nervous system, leading to behavior and learning problems, lower IQ, and hearing problems
  • Slowed growth
  • Anemia5

In rare cases, ingestion of lead can cause seizures, coma and even death.5

Lead poisoning can also result in:

  • Inattentiveness, hyperactivity, disorganization, aggression, and increase risk of delinquency
  • Headaches, loss of appetite, agitation, clumsiness, or somnolence6

A lead poisoned child is:

  • Seven times more likely to drop out of high school7
  • For every 5 μg/dl increase in blood lead levels at six years of age, the risk of being arrested for a violent crime as a young adult increased by almost 50%.13
  • Fifty percent more likely to do poorly on the MEAP6

More than half of the students tested in Detroit Public Schools have a history of lead poisoning, which affects brain function for life, according to data compiled by city health and education officials.  About 60 percent of DPS students who performed below their grade level on 2008 standardized tests had elevated lead levels.7

Groups of children that have been followed from womb to adulthood show that higher childhood blood lead levels are consistently associated with higher adult arrest rates for violent crimes.8

Prevalence of Lead Locally and Nationally

  • Detroit is one of the worst cities in the country when it comes to lead poisoning. Although only 20% of Michigan’s children younger than 5 years lived in Detroit in 2010, childhood lead poisoning in Detroit has consistently accounted for more than 50% of the state’s total lead burden.9
  • In 1998, 15,769 children under 6 tested in Detroit had elevated levels of lead in their blood.  In 2012 this number was 2,755 children.14
  • In 2012, 7,560 children under 6 tested statewide had elevated levels of lead in their blood.10

Information Sources

  1. Olden, K., PhD. “Environmental Risks to the Health of American Children.” Preventative Medicine 22 (1993): 576-578.
  2. Department of Housing and Urban Development, Office of Healthy Homes and Lead Hazard Control. “Healthy Home Rating System—Operating Guidance.” http://portal.hud.gov/hudportal/documents/huddoc?id=operating_guidance_hhrs_v1.pdf
  3. United States Environmental Protection Agency. (2013). http://www2.epa.gov/lead/protect-your-family#sl-home
  4. U.S. Census Bureau Selected Housing Characteristics, 2007-2011 American Community Survey 5-Year Estimates, Detroit city, Michigan (http://factfinder2.census.gov/faces/tableservices/jsf/pages/productview.xhtml?pid=ACS_11_5YR_DP04)
  5. United States Environmental Protection Agency. (2013).  http://www2.epa.gov/lead/learn-about-lead#lead
  6. Zubrzycki, J. “Lead-Exposure Problems Spotlighted in Detroit.” Education Weekly Vol. 32, Issue 5 (2012): 6-9.
  7. Lam, T. and Tanner-White, K. “High lead levels hurt learning for DPS kids.” Detroit Free Press (May 16, 2010).
  8. Drum, K. “America’s Real Criminal Element: Lead.” Mother Jones (Jan. 3, 2013).
  9. Zhang, N., PhD, Baker, H., MPH, Tufts, M., MPH, Raymond, R., MS, Salihu, H., MD, PhD, and Elliott, M., PhD. “Early Childhood Lead Exposure and Academic Achievement: Evidence From Detroit Public Schools, 2008–2010.” American Journal of Public Health 103.3 (2013): 72-77.
  10. Michigan Department of Community Health Healthy Homes and Lead Poisoning Prevention Program 2012 Data Report on Blood Lead Testing and Elevated Levels, Childhood Lead Poisoning Data Facts All Counties in Michigan — Calendar Year 2012 — Children less than Six Years of Age: http://www.michigan.gov/documents/mdch/2012AnnualDataReportOnBloodLeadLevels_419508_7.pdf
  11. Farfel, M., Orlova, A., Lees, P., Rohde, C., Ashley, P., and Chisolm, J. “A Study of Urban Housing Demolitions as Sources of Lead in Ambient Dust: Demolition Practices and Exterior Dust Fall.” Environmental Health Perspectives Vol. 111, Issue 5 (2003): 1228-1234).
  12. United States Environmental Protection Agency. (2013). http://water.epa.gov/drink/info/lead/
  13. Wright, J., Dietrich, K., Ris, M., Hornung, R., Wessel, S., Lanphear, B., Ho, M., and Rae M. “Association of Prenatal and Childhood Blood Lead Concentrations with Criminal Arrests in Early Adulthood.” PLOS Medicine (May 27, 2008).
  14. Robert Scott, Michigan Department of Community Health (2013).

Personal incomes increasing in seven county region

•The personal income per capita for the seven county region of Southeast Michigan has increased since 2009;
•Unemployment remained steady at the state level;
•The Purchasing Manager’s Index for Southeast Michigan increased from July 2013 to August 2013; (monthly)
•The Commodity Price Index experienced an increase from September 2013 to October 2013 for Southeast Michigan; (monthly)
•Standard and Poor’s Case-Shiller Index show that the prices of homes in the Detroit area experienced a small decrease; (monthly)
•The number of building permits obtained in Wayne and Oakland Counties increased from September 2013 to October 2013; (monthly).

The typical trend for the per capita income for the seven county region has been an increase since 1992. Reflective of the recession, personal incomes in all seven counties decreased in 2009, but have been increasing since then.

The personal income per capita has always been the highest for Oakland County, which was recorded at $55,761 in 2012, and the lowest for Wayne and St. Clair counties, which were recorded at $35,458 and $34,548 respectively in 2012.

According to the most recent data provided by the Michigan Department of Technology, Management and Budget, from August to September of this year the unemployment rate for the State of Michigan has remained at 9 percent. The 9 percent unemployment rate for October 2013 was 0.1 percent higher of where it was at that time the previous year.

Employment numbers for Detroit, and other localities in the State of Michigan, were not available for September or October because of the government shutdown in October.

Although recent unemployment data is currently unavailable, the above maps show unemployment rates for 2011 from the American Community Survey. The maps display data showing those who are both in the civil labor force and unemployed, representing the number of people actively looking for a job but not finding one. In both the seven county (Livingston, Macomb, Monroe, Oakland, St. Clair, Washtenaw, and Wayne counties) and three county (Wayne, Macomb, and Oakland) regions, Detroit, Inkster and Pontiac had the highest unemployment rates. All three cities had unemployment rates above 12.1 percent, compared to the state average at the time of 7.7 percent.

There were two Census tracts in Detroit, one just outside of Hamtramck and one in Southwest Detroit, where the unemployment rates were between 40 and 50 percent.

The Purchasing Manger’s Index (PMI) is a composite index derived from five indicators of economic activity: new orders, production, employment, supplier deliveries, and inventories. A PMI above 50 means the economy is expanding.

According to the most recent data released on Southeast Michigan’s Purchasing Manager’s Index, there was an increase of 4.2 points from September 2013 to October 2013. In September 2013, a PMI of 63.1 was recorded which is reflective of an increase in the production activity and new orders index, along with finished goods inventories.

The Commodity Price Index, which is a weighted average of selected commodity prices, was recorded at 58 in October 2013, which was 3.8 higher than the previous month.

The Consumer Price Index measures the change in prices in a fixed market. The index is based on prices of “food, clothing, shelter, fuels, transportation fares, charges for doctors’ and dentists’ services, drugs, and the other goods and services that people buy for day-to-day living,” according to the Bureau of Labor Statistics.

The above graphs show the percent change in the price index measurements. The first graph shows there was a 1 percent decrease in the overall Consumer Price Index from August to October of 2013 in the Detroit-Ann Arbor-Flint area. According to the Bureau of Labor Statistics, this is mainly based on the fact that energy costs decreased by 2.8 percent over the two month time period and the food index fell by .2 percent.

For the Consumer Price Index Less Food and Energy, there was a 0.3 percent increase in the index from August to October of 2013 because of higher prices for education, communication, airline fares and medical care.

The above charts show the Standard and Poor’s Case Shiller Home Price Index for the Detroit Metropolitan Statistical Area. The index includes the price for homes that have sold but does not include the price of new home construction, condos, or homes that have been remodeled.

According to the index, the average price of single-family dwellings sold in Metro Detroit was $89,160 in August 2013. This was an increase of approximately $9,440 from the average price in August 2012.

The year to year percent change in the Home Price Index showed a slight decrease from the increase the region experienced in July. Between August 2012 and August 2013, there was a 16.34 percent increase in home prices for the Detroit MSA.

The above charts show the number of residential building permits obtained each month in Wayne, Oakland, and Macomb counties from January 2012 until October 2013. These numbers are reported by local municipalities to the Southeastern Michigan Council of Governments and include single family, two family, attached condo, and multi-family units.

Of the three counties examined, Macomb County was the only county that did not experience an increase in the number of permits obtained from September to October in 2013; rather, the number of permits decreased by 22. The number obtained in Wayne County increased by 5 from September to October 2013 and the number for Oakland County increased by 23 for the same time period.

When comparing the number of permits obtained in October 2012 versus October 2013 for these three counties all showed an increase in the number of permits pulled. In Wayne County there was an increase from 52 to 92, respectively. For Oakland County, 172 building permits were obtained in August of 2012 and 278 were obtained a year later. For Macomb County, there were  pulled this year 154 and 124 in October of 2012. All of these numbers represent relatively low levels of  residential construction.