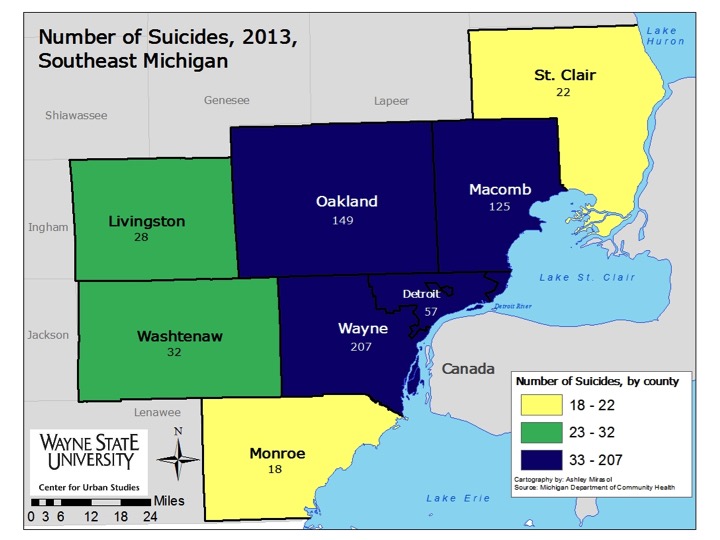
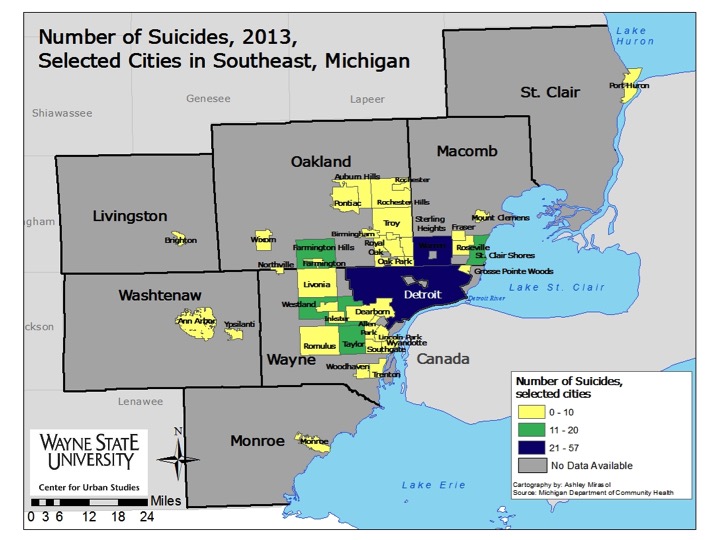
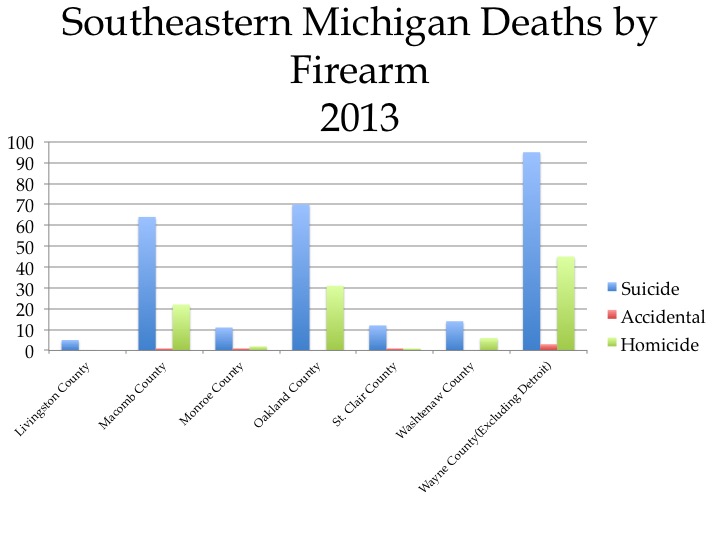
In Detroit, homicides by firearm far outpace suicide, according to the Michigan Department of Health and Human Services 2013 data. Outside Detroit in each of the seven counties in the region, the reverse holds. Suicide by firearm far exceeds homicide by firearm. Accidental deaths by firearm in Southeastern Michigan in 2013 were far lower than either other category. Wayne County, excluding the city of Detroit, had the largest difference between firearm deaths ruled suicide and firearm deaths ruled homicide; there were 50 more firearm deaths ruled homicide. Macomb County had the second largest difference at 42 and Oakland County’s difference was 39.
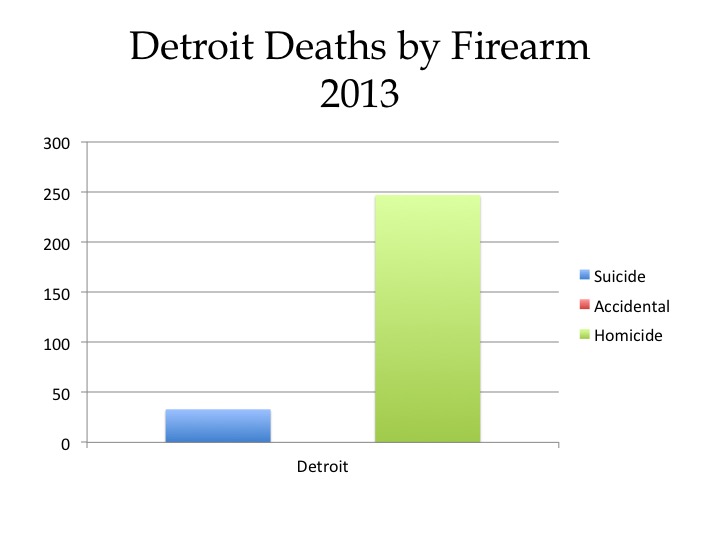
In Detroit there were 214 more firearm deaths ruled homicide than suicide.
Firearm deaths ruled accidental was the category with the lowest numbers across the region. Wayne County had the highest number of accidental deaths at three while Livingston, Oakland and Washtenaw counties, along with the city of Detroit, had zero.
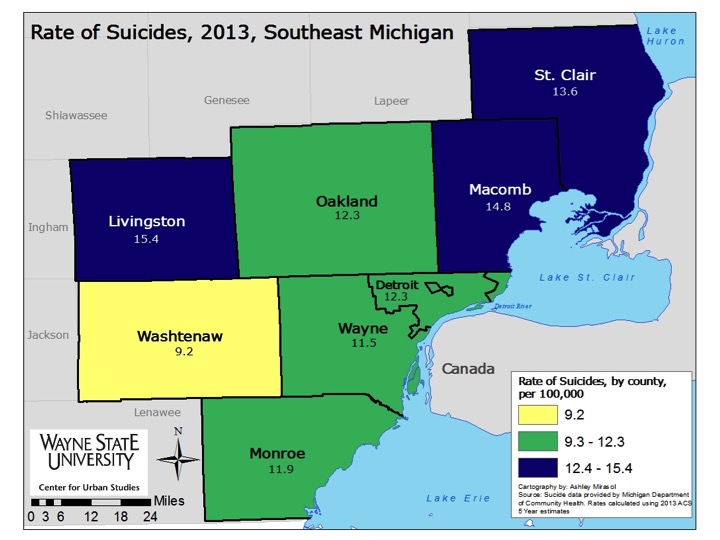
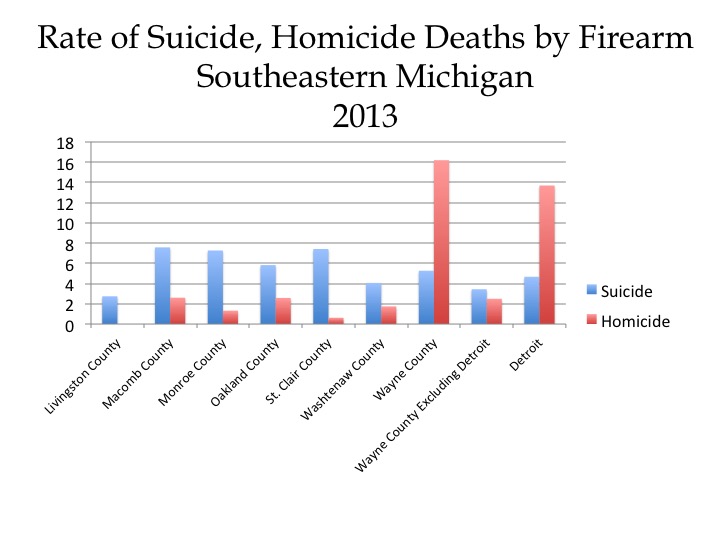
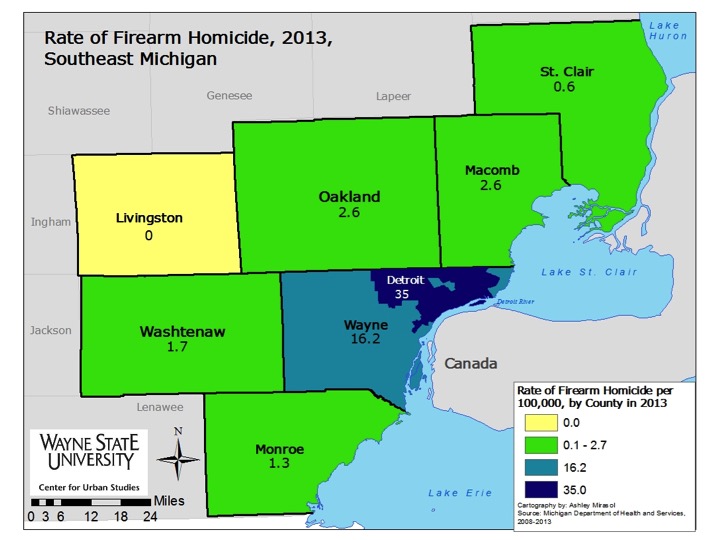
When looking at the rate of suicide and homicide deaths by firearm per 100,000 residents we see that suicide had a higher rate in all counties but Wayne in 2013. However, when the number of Detroit suicide and homicide deaths are removed from Wayne County it was in line with its peers in that its rate of suicide death by firearm was higher than its rate of homicide by firearm. At the county level, Macomb County had the highest rate of suicide by firearm at 7.6 and Livingston County had the lowest at 2.7. When not including the Wayne County rate of homicide by firearm with Detroit numbers included, Oakland County had the highest rate of homicide by firearm per 100,000 residents in 2013 at 2.5.
Detroit’s rate of homicide by firearm per 100,000 residents was higher than its suicide rate by firearm though in 2013; the rate of homicide by firearm was 13.6 while the suicide rate by firearm was 4.7.
In Detroit, homicides by firearm far outpace suicide, according to the Michigan Department of Health and Human Services 2013 data. Outside Detroit in each of the seven counties in the region, the reverse holds. Suicide by firearm far exceeds homicide by firearm. Accidental deaths by firearm in Southeastern Michigan in 2013 were far lower than either other category. Wayne County, excluding the city of Detroit, had the largest difference between firearm deaths ruled suicide and firearm deaths ruled homicide; there were 50 more firearm deaths ruled homicide. Macomb County had the second largest difference at 42 and Oakland County’s difference was 39.
In Detroit there were 214 more firearm deaths ruled homicide than suicide.
Firearm deaths ruled accidental was the category with the lowest numbers across the region. Wayne County had the highest number of accidental deaths at three while Livingston, Oakland and Washtenaw counties, along with the city of Detroit, had zero.
When looking at the rate of suicide and homicide deaths by firearm per 100,000 residents we see that suicide had a higher rate in all counties but Wayne in 2013. However, when the number of Detroit suicide and homicide deaths are removed from Wayne County it was in line with its peers in that its rate of suicide death by firearm was higher than its rate of homicide by firearm. At the county level, Macomb County had the highest rate of suicide by firearm at 7.6 and Livingston County had the lowest at 2.7. When not including the Wayne County rate of homicide by firearm with Detroit numbers included, Oakland County had the highest rate of homicide by firearm per 100,000 residents in 2013 at 2.5.
Detroit’s rate of homicide by firearm per 100,000 residents was higher than its suicide rate by firearm though in 2013; the rate of homicide by firearm was 13.6 while the suicide rate by firearm was 4.7.
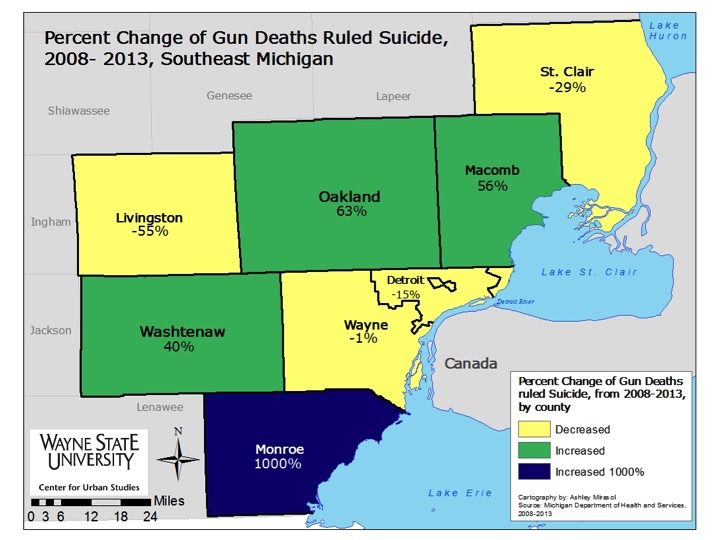
There were four counties with an increase in the percentage of firearm deaths ruled suicide between 2008 and 2013. Monroe County had the largest increase at 1,000 percent, which is representative of an increase of 10 firearm deaths ruled suicide. In 2008 there was one suicide in Monroe County and in 2013 there were 11. The other three counties were Washtenaw, Oakland and Macomb. In terms of sheer numbers, Oakland County had the largest increase of firearm deaths ruled suicide between 2008 and 2013 at 27.
Livingston County had the largest percentage decrease of firearm deaths ruled suicide between 2008 and 2013 at 55 percent. In 2008 in Livingston County there were 11 firearm deaths ruled suicide and in 2013 there were 5.