Detroit’s Residential and Business Vacancies Decline

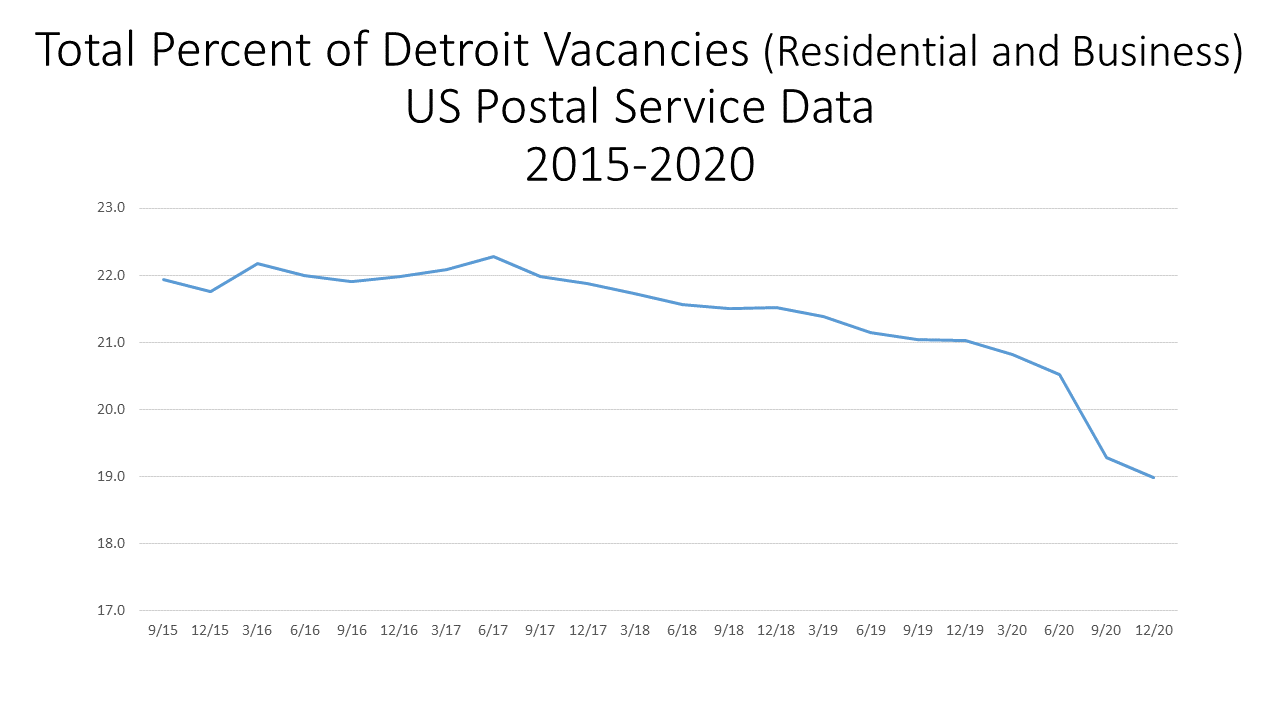
In December of 2020 the US Postal Service reported 74,313 total vacant properties in the City of Detroit, equivalent to a 19 percent vacancy rate. This rate is the lowest report rated since 2015, as can be seen in the first chart below. Additionally in 2020 the Postal Service reported 317,272 occupied addresses.

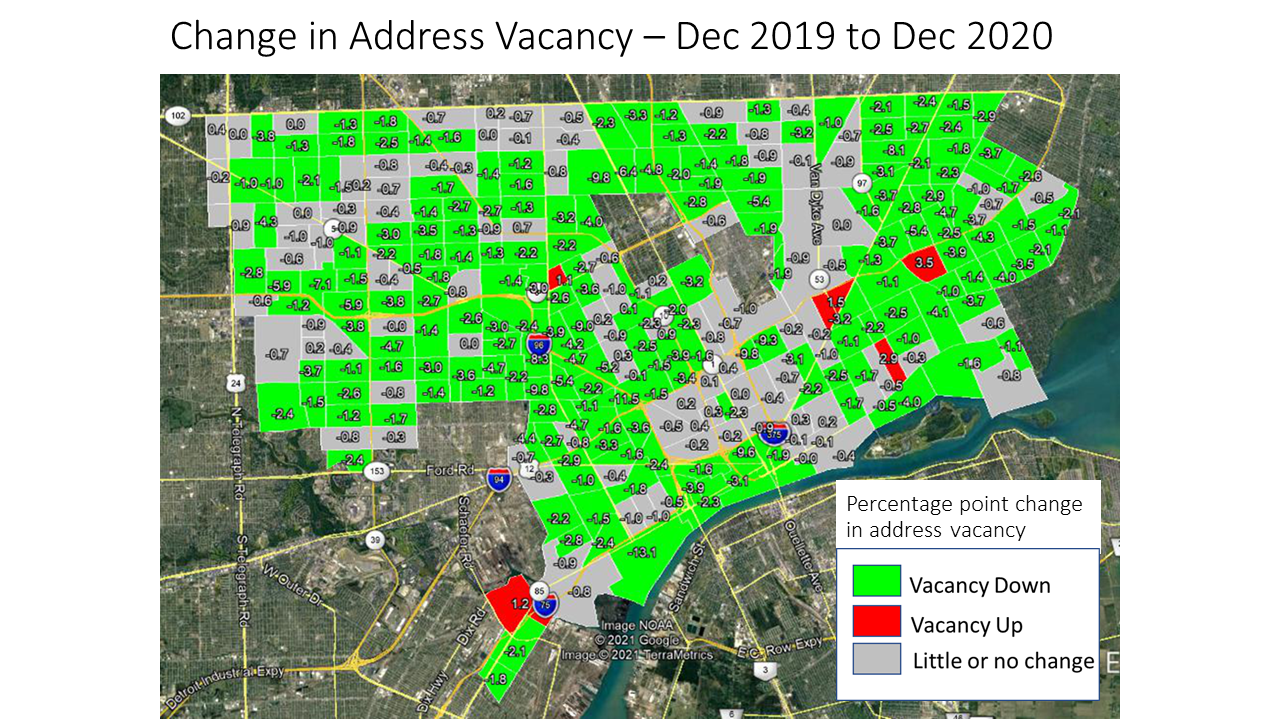
According to the first map below, while the overall vacancy rate in December of 2020 was 19 percent, there were several areas in the City with much higher rates. The highest rates were near I-96 and Gratiot Avenue in the City of Detroit, with the highest overall rate for a Census Tract being 52.3 percent in the Morningside/Chandler Park area. Conversely, vacancies remained the lowest in the Downtown Detroit area and Green Acres/Pembroke/Bagley areas. High vacancy rates in the City ranged from 31-52.3 percent and low vacancy rates ranged from 1.9 to 9.3 percent. Between September and December of 2020 the vacancy rate decreased by 0.3 percent. Additionally, the vacancy rate had an annual 2 percent decrease plus a 2.8 percent decrease over a five-year time period. The second map below shows the long-term trends; all but seven Census Tracts experienced a decrease in vacancy or little to no change between 2019 and 2020. The Chandler Park area had the highest increase in vacancy rates between December 2019 and 2020 at 3.5 percent.

The USPS provides aggregate vacancy and no-stat counts (see explanation below) of residential and business addresses that are collected by postal workers and submitted to on a quarterly basis the Department of Housing and Urban Development. While occupancy status is recorded, USPS does not capture any information about the nature of the vacancy or the address itself, other than whether it is a residential or business address. To the USPS, the address is either occupied and requires mail service or is vacant and does not. An address is deemed vacant if it did not collect mail for 90 days or longer. In addition to occupied and vacant addresses there are also “no stat” addresses. A “no stat” address is called that if it is under construction and not yet occupied or is in an urban area and identified by a carrier as not likely to be active for some time.

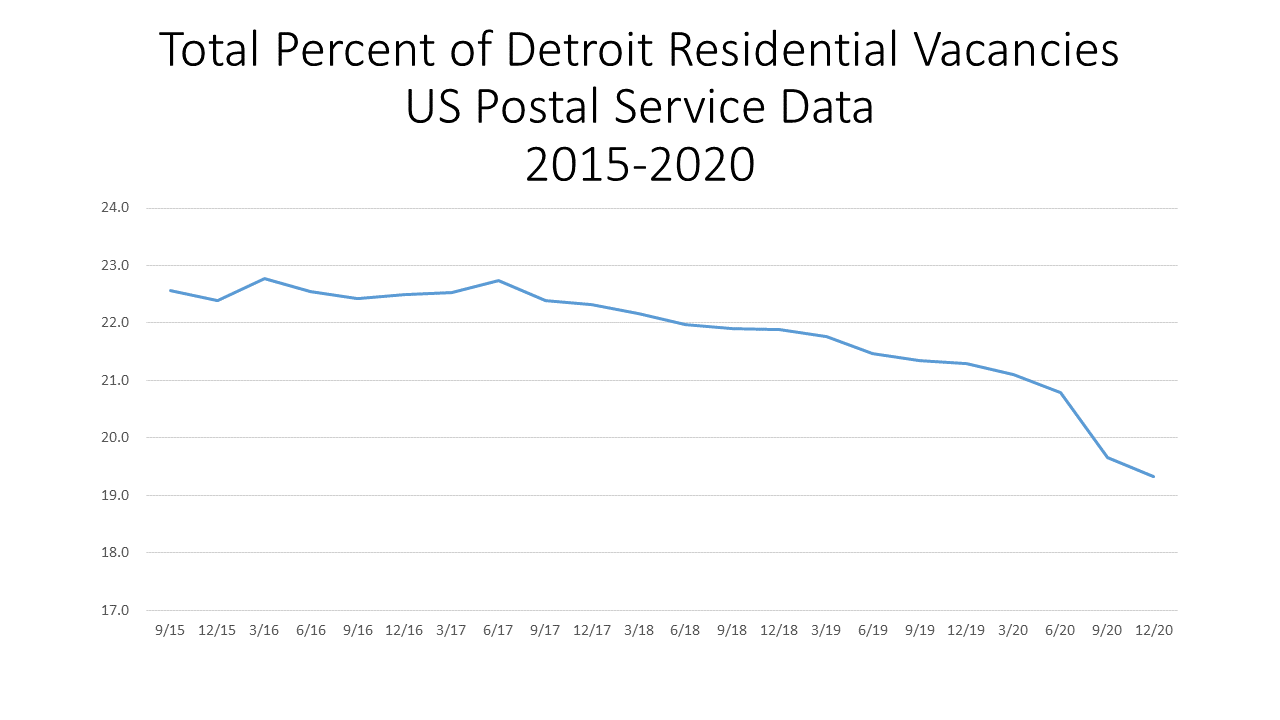
As noted, overall vacancy rates in the City of Detroit have been declining, and this also true at both the residential and business levels. Residential vacancy rates in September of 2015 were 22.6 percent, which was equivalent to 81,666 residential vacancies. By December of 2020 that number of vacancies decreased to 19.3 percent, or 67,442 total vacancies.

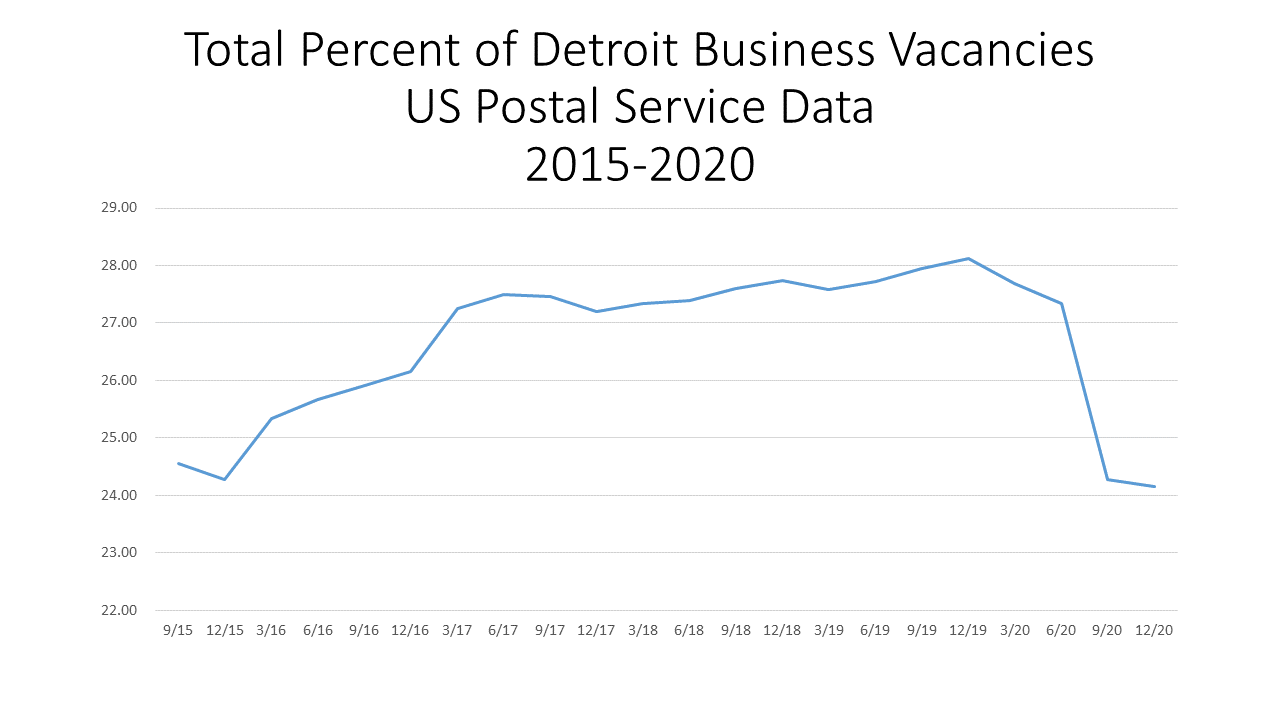
For business vacancies in December 2020 there was a total of  6,871 vacant businesses out of 28,438 total businesses in the City.  This was equivalent to 24.2 percent. In September of 2015 the vacancy rate was 24.6 percent for a total of 7,337 vacant businesses out of 29,885.

Examining both charts below we see that there has been a steadier decline in residential vacancy rates than business vacancy rates. Between 2015 and 2019 business vacancies were actually climbing, and reached a high of 28 percent in December of 2018. Then, through the pandemic declined substantially, though it is not clear why.

According to the USPS there was 27,878 “no stat” addresses reported in Detroit in December of 2020, an increase of 3,884 from the year prior.

Environmental Injustices Continue in Detroit

Environmental injustice occurs when certain populations, typically those who are marginalized, and the environment are both harmed from certain actions. We have seen this occur with the Flint water crisis and we continue to witness it right here in Detroit. While pollution can come in many forms, it is air pollution that we are focusing on in this post and what is at least one factor in Detroit’s environmental injustice.

Before we dive into some of the sources of Detroit’s air pollution it is important to understand Detroit’s socioeconomic makeup. With a population of about 620,000 residents, 78 percent of the population is black, nearly 25 percent of the population is under the age of 18 and 32 percent of the population lives in poverty, according to the US Census Bureau.

Furthermore, according to the University of Michigan School of Public Health it is estimated that air pollution kills more than 650 Detroiters a year, with thousands more being hospitalized and children missing a disproportionate number of days at school because of illnesses and asthma.

According to the 2021 update on the State of Michigan’s “Detroit: The Current Status of Asthma Burden,” the asthma rate of the in the City of Detroit in 2019 was four times higher than the State of Michigan’s rate. Additionally, there were 1,458 asthma hospitalizations of Detroit residents in 2019.

Between 2017 and 2019, 71 Detroit residents died due to asthma. The rate of asthma mortality among Detroit residents was 31.4 per 1,000,000 population. The rate of asthma mortality in Detroit in 2017-2019 was about three times the rate for Michigan as a whole.

Now, when further digging into asthma rates el, the “Detroit: The Current Status of Asthma Burden,” states that in 2019, the rate of asthma hospitalization among Detroit’s Black population was 31 per 10,000 while the rate among Detroit’s white population was 7.9 per 10,000.  Asthma hospitalization among Detroit Blacks were over three times that of Detroit whites. Michigan Blacks had over five times the hospitalization rate of Michigan whites.

According to the American Lung Association, the exact cause of asthma remains unknown, but there are certain factors that play a role in developing the disease. These factors include family history, allergies, viral respiratory infections, obesity, smoking, certain jobs and air pollution, especially including dust and mold.

As noted in our last post, there are several secondary particle pollution sources that have a negative impact on the area’s air quality in Metro-Detroit. According to climatetrace.org, a global non-profit organization that independently traces greenhouse gas emissions, some of the area’s highest emitters are an oil refinery, two steel plants, an airport and a powerplant. These emitters are:

Marathon Petroleum CO Detroit:

Ranked 378/80,188 Worldwide: for Carbon Dioxide emissions (CO2E)

Cleveland-Cliffs Dearborn Steel Plant

Ranked 296/80,188: for Carbon Dioxide emissions (CO2E)

Detroit Metropolitan Wayne County Airport

Ranked 917/80,188 for Carbon Dioxide emissions (CO2E)

Gerdau Monroe Steel Plant

Ranked 1,450/80,188 for Carbon Dioxide emissions (CO2E)

Monroe Michigan Power Plant (DTE)

Ranked 37/80,188 for Carbon Dioxide emissions (CO2E)

Other secondary sources that contribute to particle pollutants in the Metro-Detroit are the the Mistersky and River Rouge power plants, highways, the Ambassador Bridge and Stellantis manufacturing plants in Warren and on Detroit’s eastside.

The media has long reported the history of the Detroit’s 48217 ZIP code, which is located in Southwest Detroit. With the Marathon plant and the DTE Delray and Mistersky powerplants, along with nearby highways and international trucking routes (Ambassador Bridge and soon to be Gordie Hower International Bridge), the amount of air pollution in this area is at concerning levels.

According to a recent released by the University of Michigan School of Public Health, between 2016-2021 the major source of PM2.5 ( which is fine inhalable particles, with diameters that are generally 2.5 micrometers and smaller) in the area was “mobile sources of emissions,” or vehicle exhaust and construction equipment, at 40 percent. Industrial sources of emissions also contributed a “sizable” amount to the PM2.5 levels, but were on the decline due to recent closures of coal-burning power plants and other facilities in the area.

Another area of growing concern is Detroit’s eastside, where the Stellantis production plant has not only grown to two production lines, but the amount of traffic has also increased due to the addition of a logistics warehouse that services the Stellantis plant. As has been noted in this and previous air quality posts, high traffic and industrial areas are major factors in both environmental pollution and an individual’s health.

So, what we know thus far is that Detroit is a primarily a city composed of minorities, particularly African-Americans and Hiuspanics with a lower median income than neighboring communities in Southeast Michigan. We also know that in Detroit there are pockets of dedicated space for industry, whether it be manufacturing plants, power plants or other forms that push PM2.5 into the air. Poor air quality is not only a major concern for many Detroit residents, but also a reality. This type of environmental injustice has led to severe health problems for thousands of residents, both children and adults.

With strong regulations, from zoning to emission standards and even traffic regulations, we can work toward alleviating environmental injustices. However, as we continue to see at an increasing rate, pollution and other negative impacts on the environment have a long-lasting impact. Advocating for and taking steps to implement equitable solutions when it comes to housing, education and access to jobs is crucial.

Life Expectancy Declines in Michigan, US

The average life expectancy for Americans decreased in 2020, according to the National Center for Health Statistics, and the same goes for Michiganders.

According to the National Center for Health Statistics, which is run by the Centers for Disease Control, the average life expectancy of an American in 2019 was 79 years of age and by 2020 that decreased 77 years of age. In 2021, the National Center for Health Statistics reported the average life expectancy of an American decreased to 76 years of age. For Michigan, the Michigan Department of Community Health did not have data for 2021, but for 2020 the average life expectancy of males and females, both white and black, declined.

The first chart below shows that between 2019 and 2020 the life expectancy for females declined from 80.6 years of age to 79.2; for males the average life expectancy declined from 75.7 years of age to 73.6. Prior to the reported 2022 average life expectancy ages, the last times they were as low was in 2002 for females (79 years of age) and 1999 for males (73.4 years of age).

According to the Centers for Disease Control, the top 10 contributing factors to death for those who live in Michigan in 2020 were:

•Heart Disease (117,087 deaths)

•Cancer (21,118)

•COVID-19 (11,362)

•Accidents (6,044)

•Stroke (5,873)

•Chronic Lower Respiratory Disease (5,644)

•Alzheimer’s Disease (4,860)

•Diabetes (3,408)

•Kidney Disease (1,940)

•And Influenza, Pneumonia (1,880)

While we know the leading causes of death, it is believed by the CDC that the pandemic likely drove the recent decline in the average life expectancy for Americans, across the board. In Michigan, COVID-19 itself attributed to 11,362 deaths in 2020. We also know that the number of deaths related to heart disease, accidents, influenza/pneumonia, kidney disease, diabetes and stroke increased between 2019 and 2020, as did the drug overdose rates.

So, while the numbers above help frame the story as to why Michigan’s average life expectancy is decreasing, digging into the data another way also tells another story.

The Michigan Department of Community Health publicly presents data on the average life expectancy broken down by both sex and race. As shown above, overall, females have long had a higher life expectancy over males. However, when further breaking down the data, we see that black females and white males in Michigan have had nearly the same life expectancy since 1910. In 2020, the average life expectancy for black females in Michigan was 73.3 years of age, a decrease of 3.3 years from 2019. The average life expectancy of white men in Michigan was 75.3 years of age in 2020, a decrease of 1.3 years from 2019. White females in Michigan experienced a 0.9 decrease in average life expectancy, which was the smallest decrease of the four groups. It was black males who had the largest decrease in life expectancy between 2019 and 2020 in Michigan at 4.8 years; in 2020 the average life expectancy for black males in Michigan was reported at 64.9 years of age. The last time the average life expectancy for black males was that low, or lower, was in 1995 when it was reported to be 64.4 years of age.

According to the Michigan Department of Community Health, the top leading causes of death for black males in Michigan in 2020 were:

•Heart Disease (2,430 deaths)

•COVID-19 (1,610)

•Malignant neoplasms (1,272)

•Accidents (799)

•Assault ( 512)

Note that assault is not even among the overall the top 10 causes for Michigan citizens overall.

While we mentioned the effect COVID-19 has had on life expectancy, as well as drug overdoses and the increase mortality rates related to other diseases, it should also be noted that number of individuals with access to health care has increased in recent years. So, as the average life expectancy is decreasing, more individuals are receiving greater access to health care, an odd result, but probably the effect of COVID has overtaken the benefits of better care.

Overall, decline in life expectancy for all sexes and races is concerning as it means people are dying earlier than they should be.

Broadband Not Accessible for All in Metro-Detroit

Even in the age of the internet, accessibility is limited for many, including in Southeastern Michigan.

According to the Southeastern Michigan Council of Governments (SEMCOG), there are about 1.6 billion homes in the seven county region with broadband and about 250,000 without it. In other words about 87 percent of homes in the region have internet and 13 percent are without it.

Access to broadband connectivity is two-fold though.

In a small percentage of the region there is no connectivity. In Southeastern Michigan, 99 percent of homes have access to broadband and 1 percent do not; this equals to out about 1.9 homes having access to broadband and about 10,000 not having access. The first map below highlights where any kind of access to the internet lacks. Each county in the region is affected, with very small neighborhoods in even some of the most populated areas (Detroit, Canton, West Bloomfield, etc.) experiencing some dead zones. However, the more rural areas in the region (north Macomb County, western Livingston and western Washtenaw counties) and several areas throughout St. Clair and Macomb counties) have much larger areas where access to broadband does not exist. While the land area where access is lacking looks large, the population that lives in these areas must also be considered. As noted, overall, there are about 10,000 people who do not have access to the internet due to service not existing where they live.

The first chart below highlights those who are underserved by broadband, which not only includes those who do not have access to broadband at all but also those who do not have access to highspeed internet (meaning they may have access to slower internet that does not allow for extensive streaming, downloading, etc.). St. Clair County has the highest percentage of homes that are underserved at  7.1 percent, followed by Monroe County where 2.5 percent of homes are underserved. Oakland County has the lowest percentage of homes that are underserved at 0.4 percent.

***All data in this post is provided by SEMCOG***

While the existence of broadband infrastructure is a concern, so is overall access, especially for those who have limited access to the infrastructure. The chart below shows the percentage of homes that do not use the internet. Wayne County has the highest percentage of homes that do not use the internet at 19 percent and, conversely, Washtenaw County has the lowest percentage of homes that do not use the internet at 7 percent.

Factors that play into a home being able to obtain broadband include income, age and race. For example, in Wayne County, 49 percent of households with an average income of $20,000 a year or less do not have the internet. This income bracket has the highest percentage of homes without internet across the region. When examining aging groups that data shows that 33 percent of the 65-years-of-age and older population does not have the internet; this is the age bracket with the highest percentage of individuals without access. And, finally, 13 percentage of the black population in Wayne County does not use the internet. Blacks have  the highest percentage of non-usage in Wayne County, and in every other county in the region.

Access to the internet is vital for many. This was fully demonstratated when COVID made remote work and school a necessity. As our society continues to evolve, access to this lifeline must become more accessibility to the population despite their location, income, race and age. As the data shows, race, income and age certainly play a factor in accessibility so breaking down those barriers must be a priority, as should developing stronger infrastructure in more rural areas. 

Locally, Washtenaw County has committed more than $13 million in American Rescue Act Funding to expand affordable and equitable high-speed broadband infrastructure to unserved and underserved communities. This is part of a larger investment by Washtenaw County which is focused on connecting every to high-speed broadband infrastructure.

Additionally, the City of Detroit is creating a test fiber-to-the-home connectivity project in Hope Village. This project will connect about 2,000 homes to affordable service. This project is also being funded by the American Rescue Act.

With millions of dollars dispersed to every county in American Rescue Act Funding, this should certainly become a priority for more places than just Washtenaw County.

Detroit’s Population Falls in 2020 Census, Oakland and Macomb Counties Continue to Grow

The numbers are in, and according to 2020 Decennial Census data Michigan’s overall population grew to 10,077,331, but Detroit suffered a population loss for yet another decade. According to the recently released data, Detroit’s 2020 population was recorded at 639,111, a decrease from  the 713,777 2010 Census population. The City of Detroit’s population was at one point larger than every other county’s population in the State of Michigan (1.8 million people in 1950), except for Wayne County (it is located in Wayne County. However, as the first chart below shows, that began to change in 1990 when Oakland County’s population exceeded Detroit’s. Then, in 2010, Macomb County’s population also exceeded Detroit’s population. According to the most recent Census data, Oakland County’s population was  1,274,396 and Macomb County’s population was 881,217 in 2020. Wayne County, including the City of Detroit, still has the largest population in Michigan at 1,793,561. However, Wayne County also continues to lose population, in part because of Detroit’s population loss.

Between 2010 and 2020, the City of Detroit and St. Clair and Wayne counties were the only large units of government to lose members of their population. The City of Detroit had the largest percent loss at 10.5 percent, or 74,666 people. Wayne County experienced a 1.5 percent loss (27,023) and St. Clair County experienced a 1.6 percent loss (2,657). Tax foreclosures have been cited as a reason for the Detroit’s continued population loss.  Note, however, that Detroit lost fewer people in the last decade than the previous decade–74,666 from 2010 to 2020, compared to the 201,530 population loss between 2000 and 2010.  Detroit Mayor Mike Duggan said he plans to appeal the recently released Census numbers for the City, as he firmly believes they are inaccurate. Part of his reasoning? The 2020 Census accounted for 254,000 occupied households but according to DTE there are about 280,000 residential households paying electric bills. In comparing these two data points, there is a discrepancy of 25,000 occupied houses with running electricity—housing units he thinks the Census missed. 

Wayne County officials on the other hand recognize that population loss continued, but chose to see progress since the total loss between 2010 and 2020 was about 27,000 people whereas, between 2000 and 2010, the population loss was about 240,000 residents, so there has been a substantial decline in the loss. According to a recent Free Press article, part of population loss Wayne County experienced was due to the loss Detroit experienced, but that was offset by population gains in other municipalities in Wayne County. Furthermore, a large portion of the State’s population remains concentrated in Wayne County (about 1/5 of the population). 

The population loss experienced by Detroit and Wayne and St. Clair counties was likely the gain for other area counties. According to the data, Washtenaw County experienced an 8 percent population increase between 2010 and 2020 (27,467), Livingston County experienced a 7.1 percent increase (12,899), Oakland County experienced a 6 percent population increase (72,034) and Macomb County experienced a 4.8 percent increase (38,865).

In a future post we will also be looking at the population gains and losses at the municipal level in Southeastern Michigan. A few notable regional gains and losses to mention now though are:

Population Gains Above 20 Percent

•Hamtramck, where the population increased 27 percent between 2010 and 2020 (from 22,423 to 28,433)

•Salem Township, where the population increased 25 percent ( from 5,627 to 7,018);

•Oceala Township, where the population increased 23 percent (from 11,936 to 14,623);

•Lima Township, where the population increased 22 percent (from 3,307 to 4,024)

•Dundee Township, where the population increased 21 percent (from 6,759 to 8,145);

•Saline Township, where the population increased 20 percent (from 1,896 to 2,277);

•Novi Township, where the population increased 20 percent (from 55,224 to 66,243);

Population Losses Above 10 Percent

•Scio Township, where the population decreased by 13 percent between 2010 and 2020 (from 20,0081 to 17,552); •Detroit, where the population decreased by 10.5 percent (from 713,777 to 639,111).

With population changes comes changes in demographics as well. For example, in Detroit, the Hispanic white population grew to make up 9.5 percent of the City’s demographic and the Hispanic or Latino population to grew to makeup 8 percent of the population.

To fully grasp the regional and statewide population gains and losses we needed to understand just who left one area and moved to another. Migration to the suburbs, particularly to Macomb and Oakland counties by the City’s white population, is what initially triggered Detroit’s population loss in the 1950s. This population loss has continued through 2020. Demographic changes have continued through today and with the release of new Census data, Drawing Detroit will show just how Southeastern Michigan, and Michigan overall, has changed in the last decade and beyond.

Detroit’s Infant Mortality Rate Reaches 13 Year High

Michigan ranks 36th in the country in infant mortality and the City of Detroit has the highest number of infant deaths in the State, according to the Michigan Department of Health and Human Services. In 2018, the most recent year for which data was available, Detroit’s infant mortality rate was 16.7, the highest its been since 2002 when the rate was 16.8 These two rates translate to 9,476 (2018) infant deaths and 14,187 (2002) infant deaths, respectably. The infant death rate is the number of resident infant deaths divided by total resident live births X 1,000.  Infant deaths are deaths occurring to individuals less than 1 year of age.

As shown in the first chart below, Detroit infant mortality rates are consistently much higher than those of any county in Southeastern Michigan, and any other county in the State. Detroit’s infant mortality rates are also consistently higher than the State average. And, while the State’s infant mortality rates have been declining overall since 2000 Detroit’s rate has increased 3 points since 2016. It is important to remember that over 50 percent of children in Detroit families live below the poverty rate, far higher than elsewhere in the state.

Monroe and Livingston counties have regularly had the lowest rates; in some years not enough data was available for a rate. While we know that Detroit and Wayne County’s infant mortality rates are much higher than those in Monroe, Livingston and Washtenaw counties we also know that race plays a role in infant mortality rates. According to the US Department of Health and Human Services Office of Minority Health, African Americans • Have 2.3 times the infant mortality rate as non-Hispanic whites;

•Are 3.8 times as likely to die from complications related to low birthweight as compared to non-Hispanic white infants;

•Had over twice the sudden infant death syndrome mortality rate as non-Hispanic whites, in 2017.

Additionally, in 2017, African American mothers were 2.3 times more likely than non-Hispanic white mothers to receive late or no prenatal care. The evidence of these statistics are also apparent in the second chart below.

In 2018, the most recent year for which data was available, the infant mortality rate for black babies in Detroit was 15.9 while for white babies it was 7.1. That gap between infant mortality rates of white and black was even larger at the State level ( 14.4 for black babies and 4.4 for white babies) and at the county level in the region (compared to that in Detroit), where median incomes tend to be higher. Furthermore, Detroit’s overall infant mortality rate is likely the highest in the State because it has among of the highest percentage of black residents. According to the US Census Bureau, 78 percent of Detroit’s population is black, 39 percent of Wayne County’s population is black while 1 percent of Livingston County’s population is black and 2 percent of Monroe County’s is black. Statewide, 14 percent of the population is black.

Not only should the increasing infant mortality rates of Detroit and Wayne County be of concern, but so should the causes. As alluded to above, race and income are contributing factors to infant mortality rates, as is racism. According to the Michigan League for Public Policy’s report “Strong Moms for Thriving Babies: Right Start 2020“ issues such as poverty and racism must be addressed in order for local infant mortality rates to decrease. Recommendations to do this include extending Medicaid coverage to 12 months postpartum; allowing for and enhancing reimbursement rates; increasing the number of high-quality home visiting programs to establish healthy starts for families by offering moms and their children, valuable health screenings and connecting families; restoring Michigan’s Earned Income Tax Credit; and advocating for paid paternity leave.

Statewide, a $12.6 million annual budget for the new program “Healthy Moms, Healthy Babies” was approved as part of the 2021 budget. This program is aimed at decreasing the infant mortality rate while providing the resources in order to accomplish that goal. Components of this program include:

• Plans to expand healthcare coverage for a mother to a year;

•Moving a woman’s first postpartum visit to within three weeks, with a comprehensive visit within twelve weeks;

•Requiring implicit bias training for medical professionals;

•Expanding home visits;

•Allowing the woman to chose what form of birth control works best for her.

The problem, however, is that divided evenly this would provide only about $116 per child under one. If it were concentrated on only the 19%  of children in poverty, this would set aside a bit over $500 per child. Is it likely this is enough to make substantial change?

Fertility Rates in Michigan Continue to Decline

Fertility rates in the United States and in Michigan have been steadily declining. According to the Michigan Department of Health and Human Services, since the year 2000 fertility rates in the U.S. peaked at 69.5 births per 1,000 women of child bearing age in 2007. Since then the rates have continued to fall. Between 2011 and 2016 the fertility rate hovered between 63.2 and 62 before dropping to 60.3 in 2017 and 59.5 births per 1,000 women of child bearing age in 2018. In Michigan, the fertility rate has consistently been lower than that of the U.S., but it too has been on the decline. Since the year 2000 the fertility rate peaked in 2000 at 63 births per 1,000 women of child bearing age. Up until 2009 the fertility rate fluctuated between about 62 and 60.5, then in 2009 the rate dropped to 58.8 births per 1,000 women of child bearing age. Between 2013 and 2016 the fertility rate again increased to about 60 births per 1,000 women of child bearing age  before again dropping to 59.5 in 2017 and 58.5 in 2018. In raw numbers, in 2018 there were 110,293 births in Michigan, the lowest number since 1941.

According to a recent New York Times article, fertility rates tend to decrease with economic downturns. This happened with the Great Depression and then again with the Great Recession in 2008. However, while fertility rates rebounded following the Great Depression this has yet to happen following the recent recession. Stable fertility rates are important as they help ensure there will be a healthy workforce to keep the economy moving and to care for the elderly populations.

Below is a chart detailing the fertility rates for all of the seven counties in Southeastern Michigan in 2018, along with the rate for the State of Michigan and the City of Detroit. The only county to have a higher fertility rate than the State was Wayne County. In 2018 the fertility rate for Michigan was 58.5 births per 1,000 women between the ages of 15 and 44 and for Wayne County the fertility rate was 66.2; the City of Detroit had a fertility rate of 70.2. Washtenaw County had the lowest fertility rate at 40.5 births per 1,000 women between the ages of 15 and 44. One possibility for the low fertility rate in Washtenaw County is the fact that the county is home to the University of Michigan. With such a high college population, where the typical age is concentrated in the lower 20s, it is quite possible that the fact that fewer women in their 20s are having children contributed to the county’s low fertility rate.

In addition to publishing fertility rate data by county, the Michigan Department of Health and Human Services also publishes it by race. Below is the data for the year 2018 by county for white women. The fertility rate for white women in Michigan in 2018 was 55.2 births per 1,000 women between the ages of 15 and 44, and Wayne and St. Clair counties were the only two in the region with higher fertility rates. Wayne County had a fertility rate of 58.7 in 2018 and in St. Clair County the fertility rate for white women between the ages of 15 and 44 was 57.8. White women in the City of Detroit also had a fertility rate higher than the state; Detroit’s fertility rate per 1,000 white women between the ages of 15 and 44 was 57.9.

The fertility rate for black women in 2018 in Michigan was 67.6 births per 1,000 women between the ages of 15 and 44. Again, there was a higher fertility rate for black women in Wayne and St. Clair counties than at the state level; those rates were 71 and 70.7, respectively. The City of Detroit also had a higher fertility rate than the state at 69.2. A fertility rate was not available for Livingston County.

It should also be noted that the fertility rate for black women in the State of Michigan and across the counties in Southeastern Michigan was higher than the fertility rates for white women in the region and at the state level.

As fertility rates decline it is also important to understand that there seems to be a shift in the age women are choosing to have children. According to the same New York Times article, at the national level, fertility rates have declined the most among teenage women; the fertility rate for teenagers has declined 70 percent since 2001. Women in their 20s are also having fewer children, despite this age group traditionally having the highest fertility rate. In 2016 it was women in their early 30s who had the highest fertility rate. By 2018, the only age group that experienced an increase in fertility rates was women in their late 30s and early 40s.  Also, according to the article, more than half the women in the U.S. who had children in their 30s had a college degree; this was more than the amount of women in their 20s with children and college degrees. There is a belief that women are waiting longer to have children to ensure their financial stability, career trajectory and that they have enough resources to provide for their children.

Population Shifts Reflect Aftermath of Economic Distress, Change

Last week we examined the density of the various racial, ethnic and ancestral backgrounds in Southeastern Michigan and this week we further explore how those populations have grown or declined, regionally between 2010 and 2016. One of the fascinating results of this analysis is that it demonstrates a clear reversal in the long term trend for Caucasian population to exit Detroit. This has reversed with substantial increases in the percentage of whites in some inner city areas of Detroit. We see a similar trend in Pontiac in Oakland County. As the first map below shows, population growth above 51 percent or more occurred in the Downtown Detroit, Midtown, West Village, New Center, Boston Edison, Corktown and Palmer Park areas of Detroit. These areas have been popular areas of redevelopment in recent years. Another possible reason for this growth is that homes in Detroit, for example, cost far less than other areas of the metropolitan area, and this makes renting or home ownership feasible when it might not be, after losses of income due to the decline of industry and the job market. One note of caution—the big increases for whites occur with respect to very small base populations. So, big increases might not mean that many people.

As the second map shows, most of Detroit experienced a loss of the African American population between 2010 and 2016. While Detroit experienced a loss of the African American population, there were increases of this population in areas such as Warren, Eastpointe, Dearborn and several outer-ring suburbs. This represents a continuation of a decades long migration outward from Detroit. As job markets integrate, it may be rational for African Americans to seek to be closer to job locations in the suburbs, where, after all, job growth has been higher than in Detroit.

The same forces are in play for the Latinx population. There were also population increases above 51 percent for those of Hispanic or Latinx descent in the region’s outer-ring suburbs, as the third map below shows.

For the Arab ancestry map (the fourth map), we see that there are several areas in the region, including in much of Detroit, where this population is minimal or not present. Where it was present in Detroit, it has been rapidly declining. Conversely, the Arab ancestral population’s growth is expanding in areas of western Macomb and both the eastern and western portion of the southern half of Oakland County.

Overall these maps remind us that population changes that have been steady for decades can change in unexpected ways in just a very few years, especially after a decade of economic distress and change.

Detroit’s Ex-Urban Areas Lack Diversity, Density

The purpose of this post is to show the population density of race, ethnicity and ancestry throughout Macomb, Oakland and Wayne counties. Each dot in the maps represents 500 people and the race, ethnicity or ancestry of that concentration. The groups represented on the maps are those of Arab ancestry, Hispanic or Latino ethnicity, non-Hispanic black or African American and non-Hispanic white or Caucasian. As shown in the first map, there are various concentrations of each throughout Southeastern Michigan, with those of non-Hispanic black or African American and non-Hispanic white or Caucasian being the most prominent across the region.

A deeper look at the map, and the individual maps, shows that the Caucasian population has the broadest distribution across in the region, with the highest concentrations in Detroit’s northern suburbs (See Below). The only truly notable absence of the Caucasian population in the map below is in Highland Park and in some areas of Detroit.

The group with the next highest population distribution is the African American population, with the largest concentration being in the City of Detroit. Other areas with high-density African American populations are the southern areas of the inner-ring suburbs of Detroit, Southfield, and Inkster, with increasing density in some down river communities and southern Macomb County, especially Warren. Additionally, as can be seen in the map below, Pontiac also is one of the higher density areas with an African American population.

When looking at the first map above, attention is also drawn to the Southwest portion of Detroit, where there is the highest density of the Hispanic or Latino ethnicity in the region. Allen Park, Lincoln Park and Melvindale also have a higher density of the Hispanic or Latino ethnicity in the region. The individual map also shows that there is also some concentration of the Hispanic or Latino population in Pontiac.


The final group examined in this post is those of Arab ancestry, and the highest density of this group is in eastern area of Dearborn and in Hamtramck. Dearborn Heights also has among the highest density of those of Arab ancestry. As the Arab ancestry map shows though, western Macomb County, eastern Oakland County and some western Oakland County communities are also the areas of the Southeastern Michigan where those of Arab ancestry live.

As noted, the above maps highlight the population density of various racial, ethnic and ancestral groups in the region. The outlying suburban and ex-urban areas of the region have much lower population density, along with far lower diversity.

Next week we will examine the how the percentage of each of these populations changed between 2010 and 2016.


Elderly Population Continues to Grow in Southeastern Michigan

While there are only 10 communities in Southeastern Michigan with more than 21 percent of the population 65 years of age or older, the number of communities with a growing elderly population is far greater than those with a declining elderly population. According to the data, majority of the rural communities throughout Southeastern Michigan-Monroe, Washtenaw, Livingston, St. Clair and northern Macomb and Oakland counties-have seen the greatest increases in a growing elderly population. Overall, St. Clair County’s elderly population grew the most between 2010 and 2016, with nine of the communities experiencing between 6 and 13 percent increases in the 65 years of age and older population. In St. Clair County, Algonac (21%), China Township (22%) and East China Township (26%) had the highest percentage of elderly residents in 2016. However, it was Lake Angelus, in northern Oakland County, that had the highest percentage of resident 65 years of age or older at 35 percent.

Detroit, and its inner and outer ring suburbs have the highest concentration of the aging population that is growing at a slower rate. As the second map below shows, majority of the Detroit suburbs did not experience a growth of the 65 years of age and older population above 2.5 percent between 2010 and 2016. In fact, some of those communities (Hamtramck, Grosse Pointe, Redford, Dearborn Heights) experienced an overall decline in the 65 years of age and older population between 2010 and 2016. In Detroit, the 65 years of age and older population only grew by 1.6 percent between 2010 and 2016. According to the data, in 2010 the elderly population was at 11 percent and by 2016 it grew to 12.6 percent. In Hamtramck, the 65 years of age population decreased from 9.1 percent in 2010 to 7.8 percent in 2016.

According to a recent Detroit Free Press article, by 2025 the number of people above the age of 65 will outnumber those 17 and younger. Nationally, such a growth of the elderly population isn’t expected to occur until 2035. There are varying reasons for the growth of the 65 years of age and older population locally, and nationally, including better medical advancements allowing people to live longer and the decline in birth rates over the year. One reason for what appears to be the quicker growth of the aging population in Michigan though is the fact that over about the last decade, particularly during the Great Recession, people have left to find jobs elsewhere. So, in short, out-migration has contributed to the fact that Michigan’s elderly population will outnumber its younger population within the next decade.