Four Southeastern Michigan School Districts Eliminate Budget Deficits

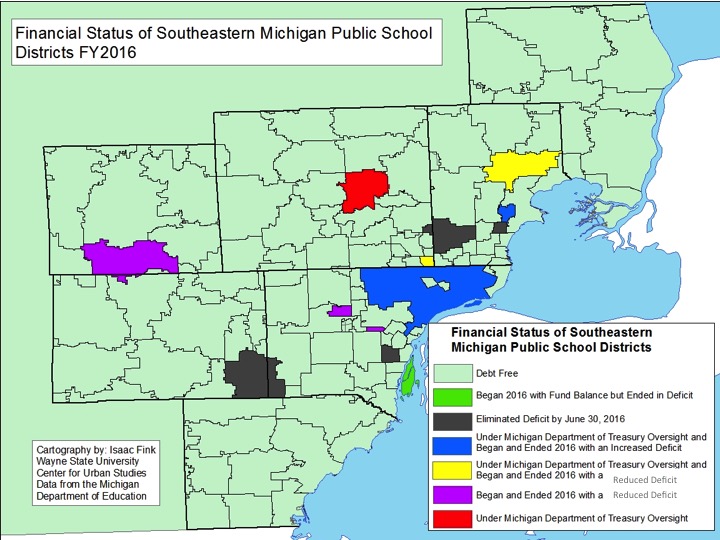
By the end of Fiscal Year 2016 there were four public school districts in Southeastern Michigan that eliminated their deficits while one new district was added to the list of having a deficit, according to the Michigan Department of Education. The four public school districts that eliminated their deficit by June 30, 2016 were Clintondale Community School (ended with a fund balance of about $1.4 million) and Warren Consolidated Schools (ended with a fund balance of about $5.7 million), both in Macomb County, Southgate Community Schools (ended with a fund balance of about $375,000) in Wayne County and Lincoln Consolidated Schools (ended with a fund balance of about $3.6 million) in Washtenaw County. Grosse Ile Township Schools in Wayne County began FY 2016 with a fund balance of $189,441, but ended the fiscal year with a deficit of $152,299. This was the only public district in the region and state to be added to this list. However, there were four charter schools in the region (Blanche Kelso Bruce Academy, Experienca Prepatory Academy, Frederick Douglas International Academy, Taylor International Academy) that began FY 2016 with a fund balance and ended with a deficit.

While there were districts that eliminated their deficit by the end of FY 2016, there were five public school districts in the region that ended the fiscal year under the oversight of the Michigan Department of Treasury (these districts are distinguished in red in the map, however if a district also increased or decreased its deficit they are highlighted in a different color in the map). A district is put under the oversight of the Department of Treasury if it maintains a deficit for five years. The public districts in the region under such oversight are: Detroit City School District, Hazel Park City School District, Mt. Clemens Community School District, New Haven Community Schools and the Pontiac City School District. Additionally, while the New Haven Community Schools and Hazel Park City School District began and ended FY 2016 with deficits, and under the supervision of the Department of Treasury, by the end of FY 2016 both districts had reduced deficits. At the beginning of the fiscal year New Haven Community Schools had a deficit of about $296,000 and by the end it had a deficit of about $65,000. The Hazel Park City School District had a deficit of about $8 million at the beginning of FY 2016 and by the end the fiscal year the deficit was reduced to about $6 million. There were also three other public school districts in the region that began FY 2016 with a deficit but reduced it by the end of the year; these districts were Dearborn Heights, Garden City and Pinkney.

The Detroit school district and Mt. Clemens Community Schools were the only two public districts in the region that began FY 2016 with a deficit and ended the fiscal year with an increased deficit; these distinctions are shown in the map although they too ended the year under the oversight of the Michigan Department of Treasury. Detroit Public Schools began FY 2016 with a deficit of about $1.8 million and ended the fiscal year with a deficit about $1.9 million. The Mt. Clemens Community Schools district began FY 2016 with a deficit of about $1.3 million and ended the fiscal year with a deficit of about $2.2 million.

slide3

Ann Arbor Has Highest Total Equalized Residential Value in Southeastern Michigan

There are four types of equalized property values: residential, industrial, commercial and agricultural. Residential property values are the largest contributor to the region’s total property values. In this post the 2016 total equalized values of residential properties are presented, meaning the values presented represent the municipality as a whole and not the average per residential property.

According to the State of Michigan, the equalized value of a property is the assessed value (which is about half the property’s market value and is set by the assessor) that has been adjusted by the County Board of Commissioners and the Michigan State Tax commission to ensure they are at the constitutional 50 percent level of assessment. All information presented in this post has been approved by the local county Board of Commissioners.

In the tri-county area (Macomb, Oakland and Wayne counties) Oakland County experienced the largest percentage increase in total equalized property values between 2015 and 2016. Oakland County experienced a 7.4 percent increase while Macomb and Wayne both experienced about a 1 percent increase.

In total, Oakland County also had the largest equalized property values in 2016 at $65,084,851,114 (more than $130 billion in actual value); residential values made up $49,933,653,218 (more than $100 billion in actual value) of that. The City of Troy in Oakland County had the highest total residential equalized property value in the county at about $3.8 billion (about $7.6 billion in actual value). This value was higher than Detroit’s total equalized residential property value of $2.5 billion ($5 billion in actual value). Wayne County’s total property value was $44,884,066,562; residential equalized property values made up $29,476,949,702 of that. The community in Wayne County with the highest total residential equalized property value was Grosse Ile with about a $3.3 billion total ($6.6 billion in actual value). In Macomb County the total equalized property value for the county in 2016 was $30,605,374,212 ($61.2 billion in actual value), with residential equalized property values making up $22,477,768,361 of that ($44.8 billion in actual value). Sterling Heights in Macomb County was the municipality in that county with the largest total residential equalized property value at about $3.5 billion ($7 billion in actual value). In Washtenaw County, where the total residential equalized property value was $13,045,788,080 ($26 billion in actual value), Ann Arbor had the highest total equalized residential property value, in the county and the region, at about $4.25 billion ($8.5 billion in actual value).

The map below shows that the municipalities with the highest total equalized values are mainly located in the Metro-Detroit area where home values and median incomes are traditionally higher. There are exceptions though, such as Detroit, where the median income and household value are below communities like Grosse Ile, Troy and Sterling Heights. However, Detroit is geographically the largest municipality in the state at about 139 square miles. The communities in the region with the lowest total equalized residential property values for 2016 are the rural communities, with larger amounts of agricultural land, located on the edge of the region in St. Clair, Livingston, Monroe and Washtenaw communities. In St. Clair and Monroe counties there was not one municipality where the total equalized residential property value was above $1 billion ($2 billion in actual value), while in Oakland County majority of the communities had total residential property values at or above that threshold.

slide2

Percentage of Female City Managers in Metro-Detroit Below Average

The percentage of females who serve as city managers in Southeastern Michigan is below the national average. In Southeastern Michigan, 10 percent of the cities with city managers had those positions filled by females. According to the International City/County Management Association (ICMA), a 2012 survey administered by this professional management organization found that about 20 percent of chief administrative officers in local government are females. Additionally, ICMA membership records show that 15 percent of the organization’s members in 2016 were female city managers.

In Southeastern Michigan there are 233 municipalities (not including counties or special districts), most of which are townships. Typically, the chief administrative officer in a township is the township supervisor, which is an elected position (more on this can be found in a past post). There are about 75 cities in Southeastern Michigan, but again, not all have city managers. Cities like Detroit and Warren have a strong mayor form of government, meaning the elected mayor serves as the chief administrative officer. Of the 69 cities with a council-manager form of government, only six had a female city manager, according to information found on each city’s website.

The largest city in Southeastern Michigan with a female city manager is Ferndale, which is located in southern Oakland County with a population of about 20,000. April Lynch has served as the Ferndale’s City Manager since 2011. The other cities with female city managers are: Belleville, Hamtramck, Lathrup Village, South Lyon and Rockwood.

In addition to cities and townships, villages are another form of local government in Michigan. In the map below these communities with chief administrative officers are also highlighted. Of the six villages in Southeastern Michigan with a village administrator one has a female serving in that position (not all villages have such a chief administrative officer-many villages have small populations, and the village president serves as the chief administrative officer). The village with a female administrator is the Village of Bingham Farms, which is located in Oakland County and has a population of about 1,100.

gender-of-city-manager_2_jpeg

As noted in our recent elected officials post, more than 50 percent of the country’s population is made up of females, but a much smaller number of females serve in elected positions, and as this post shows, are selected to lead local government. This conversation is being raised by organizations such as ICMA and Engaging Local Government Leaders (ELGL). Locally though, more conversations need to take place to at least put Southeastern Michigan in line with or above the national average, so there is a more inclusive and representative pool of local government leaders.


Deer-Vehicle Crashes in Region Account for 17% of State’s Total

In 2015 in the state of Michigan there were about 1.75 million deer, according to the Michigan Department of Natural Resources. In Southeastern Michigan there were 7,855 deer-vehicle crashes, according to the Michigan State Police.

This was down 509 crashes from 10 years prior. This total number of crashes represented 17 percent of the total number of deer-vehicle crashes in the state in 2015 even though this part of the state represents over 47 percent of the states population.

Below are three time series, based on data provided by the Michigan State Police, showing the total number of crashes in the seven county region, the total of injuries caused by deer-vehicle crashes and the total number of fatalities caused by deer-vehicle crashes.

Oakland County experienced the highest increase in the number of deer-vehicle accidents between 2014 and 2015 at 123. Over the 10 year period, four counties (Monroe, Oakland, St. Clair and Wayne) experienced increases, with Wayne County experiencing the highest at 56. Livingston County experienced the largest decrease in the number of deer-vehicle crashes between 2006 and 2015 at 474.

Washtenaw County is another county that experienced an overall decrease in the number of deer-vehicle crashes between 2006 and 2015 at 125. Between 2014 and 2015 the county also experienced a decrease of 110 crashes. However, the city of Ann Arbor is in the midst of a deer management program to reduce the number of negative deer-human interactions, according to Mlive. Between 2014 and 2015 the number of deer-vehicle accidents in the city increased from 51 to 90, according to Mlive.

slide4

As seen in the next two maps below, injuries caused by deer-vehicle accidents are fairly common while human fatalities are infrequent varying between zero and one for any given county in a year. Between 2006 and 2015 Oakland County regularly had the highest number of deer-vehicle injuries; it also had the highest number of deer-vehicle crashes. The number of injuries appears directly related to the number of accidents.

In 2015 there 70 injuries caused by deer-vehicle related accidents in Oakland County and in Monroe County there were four. Not only does Oakland County have the highest number of injuries from such crashes but it has also experienced the highest increase between 2006 and 2015 at 15. Washtenaw County climbed to a paek in 2010, fell substantially and then climbed slightly by 2015. It experienced the lowest increase in from 2006 to 2015 at 6.

While each county in Southeastern Michigan had at least a handful of injuries caused by deer-vehicle crashes, fatalities from such accidents were much more rare. Between 2006 and 2015 there were zero fatalities caused by deer-vehicle accidents in Wayne County. Unlike Wayne County, every other county in the region had at least one fatality in the 10 year time span. In the years 2009, 2010 and 2014 though there were zero deer related fatalities throughout the region. Livingston County had the highest number of fatalities between 2006 and 2015 at three, one of which was in 2015. Throughout the state of Michigan there were 11 fatalities caused by deer-vehicle crashes in 2015.


slide6

slide7

Although fatalities from deer-vehicle crashes are uncommon, motorists should still be aware of their surroundings when driving. Most deer-vehicle crashes occur in the fall and winter months between dusk and dawn on rural roads. Very few methods of reducing these crashes have been found to be effective, except fencing and drivers slowing their speeds (though they often will not without consistent enforcement).

Southeastern Michigan Economy Gaining Strength

  • The unemployment rate across the state remained stagnant while the rate in the city of Detroit decreased (monthly);
  • The number of employed Detroit residents increased, (monthly);
  • The Purchasing Manager’s Index for Southeastern Michigan remains strong, especially after increasing 7 points (monthly);
  • The Commodity Price Index remained the same (monthly);
  • The Standard and Poor’s Case-Shiller Home Price Index for the Detroit Metropolitan Statistical Area shows home prices continue to increase monthly and annually.

slide03

According to the most recent data provided by the Michigan Department of Technology, Management and Budget, the unemployment rate for the State of Michigan slightly increased to 4.7 in October of 2016 from 4.6 the previous month. However, unemployment in the City of Detroit decreased to 11.1 in September, from 12.4 the previous month. The September unemployment rate in 2016 was 0.4 points lower than it was in September of 2015.

slide05

In September of 2016 the number of employed Detroit residents rose to 221,238, an increase of 2,314 from August. Between September of 2016 and September of 2015 there was a total increase of 10,012 employed Detroit residents, according to the Michigan Department of Technology, Management and Budget.

While the number of employed Detroit residents increased between August and September the labor force decreased by 1,067. In August the labor force was reported to be 250,047 and in September it was reported to be 248,971.

slide07

The Purchasing Manger’s Index (PMI) is a composite index derived from five indicators of economic activity: new orders, production, employment, supplier deliveries, and inventories. A PMI above 50 indicates the economy is expanding.

According to the most recent data released on Southeast Michigan’s Manager’s Index, the PMI for October 2016 was 67.2, an increase of 7 points from the prior month. The October 2016 PMI was an increase of 8.4 from the previous year.  With this increase, the PMI is considered to be strong, particularly because it has remained above 50 since June of 2014. Much of this growth, according to the Institute of Supply Management of Southeastern Michigan, is due to the resurgence of the auto sector in the region.

slide09

The October 2016 Commodity Price Index decreased 0.2 points from September but increased 3.2 points from the prior year. The three month average for the Commodity Price Index was 48, which the Institute of Supply Management of Southeastern Michigan states is good for short-term profits.

slide11

The above charts show the Standard and Poor’s Case-Shiller Home Price Index for the Detroit Metropolitan Statistical Area. The index includes the price for homes that have sold but does not include the price of new home construction, condos, or homes that have been remodeled.

According to the index, the average price of single-family dwellings sold in Metro Detroit was $109,660 in August 2016. This was an increase from $103,750 from August of 2015 and an increase from $98,720 from August of 2014.