Metro-Detroit Business Indicators Show Increase in Vacancies

This post focuses in on key business climate indicators in the Detroit Metro area. We examine retail rental rates, the changes in these rates, vacancy rates for both retail and industrial property, and employment by sector.


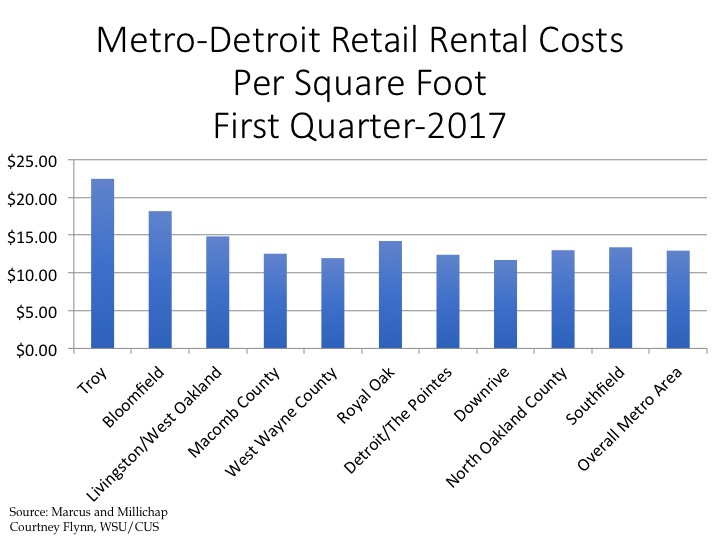
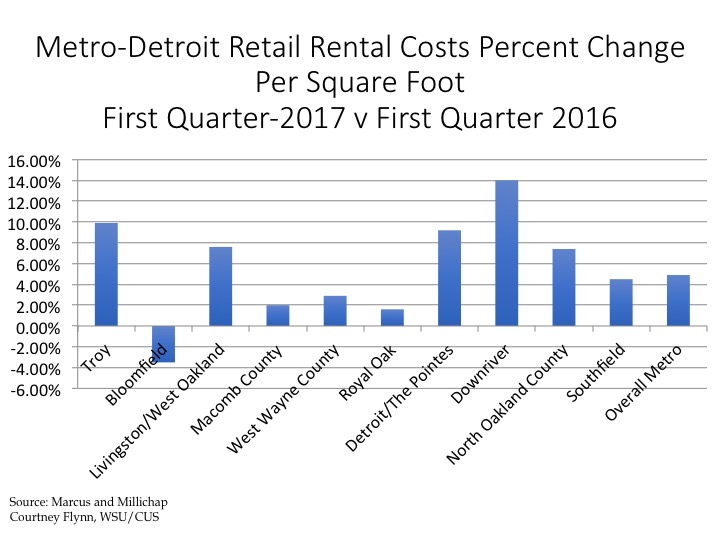
The two charts above describe the per square foot cost of retail rental space, and the change in that cost throughout the Detroit metropolitan region. In the first quarter of 2017 the City of Troy had the highest retail rental costs per square foot at $22.45, according to Marcus and Millichap. Troy also had a 10 percent increase from the first quarter of 2016. While the City of Troy did experience one of the larger retail rental cost increases over the last year, it was the Downriver area that experienced the largest increase. Between the first quarter of 2016 and the first quarter of 2017 there was a 14 percent rental cost increase in the Downriver area. By the first quarter of 2017 retail rental space cost $11.71 per square foot in Downriver; this was the lowest cost in the region.

Overall, the average retail rental cost per square foot in the Metro region was $12.94.

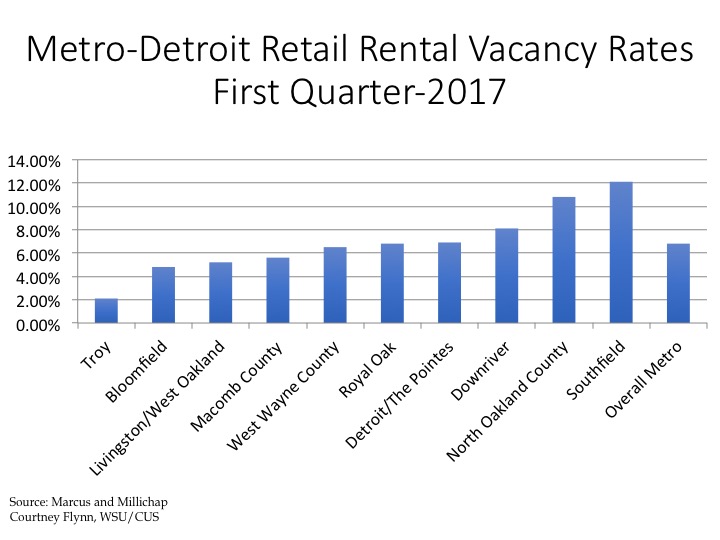
With retail rental costs the highest in the Troy area it is no surprise that that area in the region had the lowest vacancy rate at 2 percent during the first quarter of 2017, according to Marcus and Millichap. On the opposite side of the spectrum, Southfield had the highest retail vacancy rate at 12.1 percent; the cost of retail rental space per square foot in Southfield during the first quarter of 2017 was $13.39.

The overall retail space vacancy rate in the Metro region during the first quarter of 2017 was 6.8 percent.

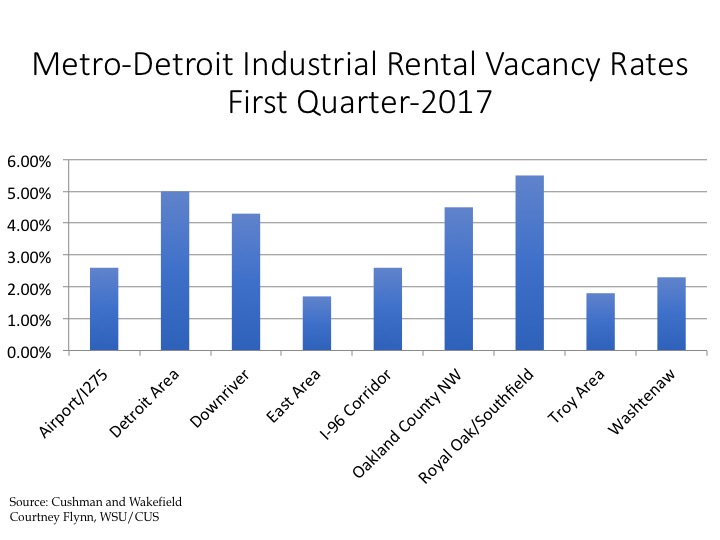
Compared to retail space vacancies (6.8%), overall there were lower industrial vacancy rates (an average of just over 2%) throughout the region. The Royal Oak/Southfield area had the highest vacancy rate in the first quarter of 2017 at 5.5 percent while the Eastern section of the Metro region had the lowest rate at 1.7 percent, closely followed by the Troy area and Washtenaw. The highest industrial vacancies were in the Royal Oak-Southfield area.

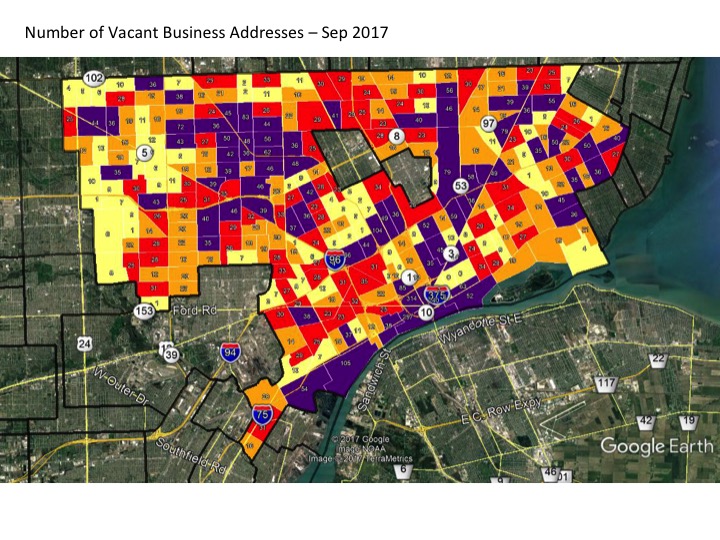
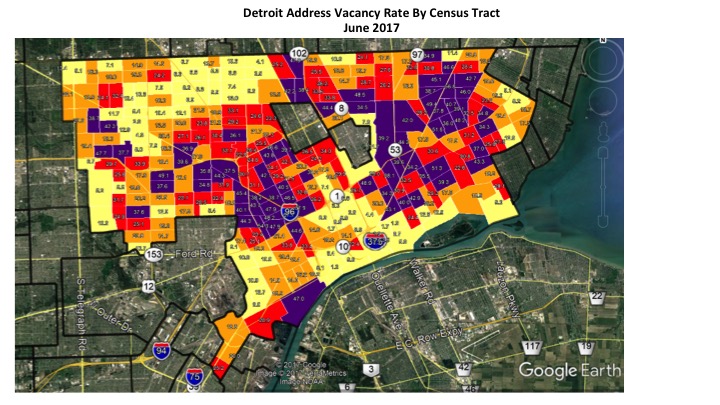
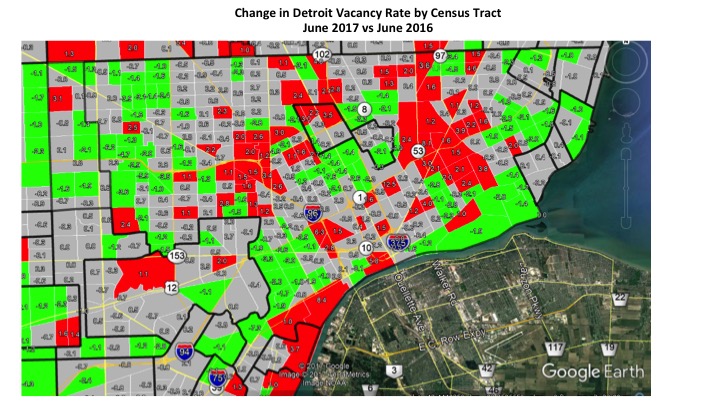
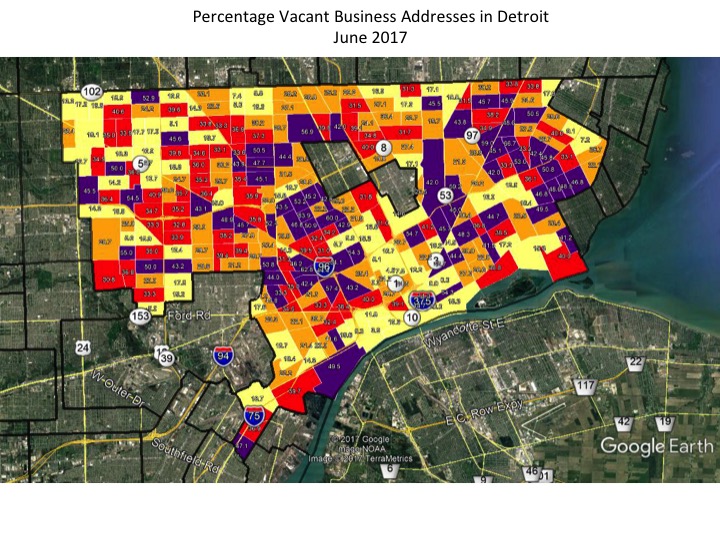
In June of 2017, according to the data from the U.S. Postal Service, there were 7,932 total vacant business addresses in the City of Detroit; this number is a 324 vacancy increase from June of 2016. Overall, the business address vacancy rate in the City of Detroit was 27.5 percent in June of 2017; there were a total of 28,844 reported business addresses. The maps above show by Census Tract where the highest and lowest business address vacancies were by both number and percentage. In total, as shown in the first map, the Southwest Detroit region along the Detroit River had the highest number of business address vacancies. The Census Tract with the highest number of vacancies was located in that area; there were a reported 314 business vacancies in one Census Tract.

In addition to the Southwest Detroit cluster of high business address vacancies there was also a cluster just west of Highland Park and another cluster along M-53. While these clusters did not have as high of business vacancy numbers as Southwest Detroit, in several cases, Census Tracts in these clusters had higher percentages of business vacancy rates. For example, in a Census Tract just east of M-53, there was a business address vacancy rate of about 59 percent; this was the highest percentage in the City of Detroit in June of 2017.

Overall, this data shows that business vacancies are increasing overall in the City, but the higher percentage of vacancies tend to be located in business and industrial districts outside of Downtown Detroit.

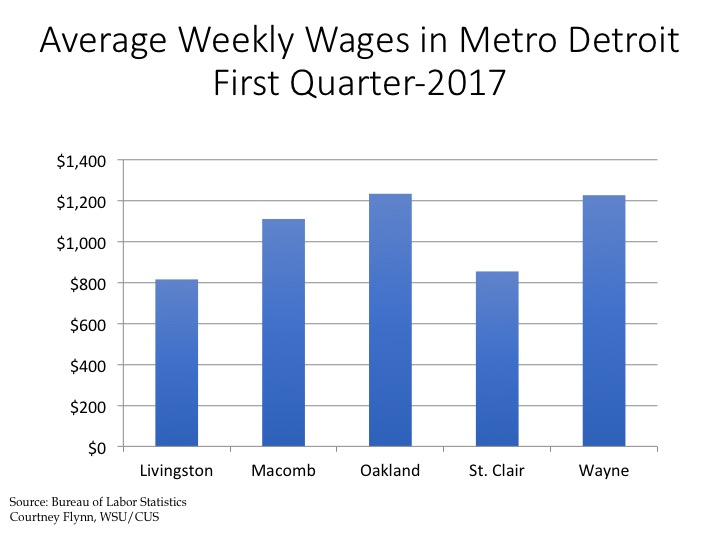
According to information from the Bureau of Labor Statistics (BLS) , during the first quarter of 2017 Wayne County had the highest average weekly wages at $1,266 while St. Clair County had the lowest at $854.

The BLS does not include Washtenaw and Monroe counties in their Metro-Detroit Economic Summary updates, which is why they are not included in the chart above.

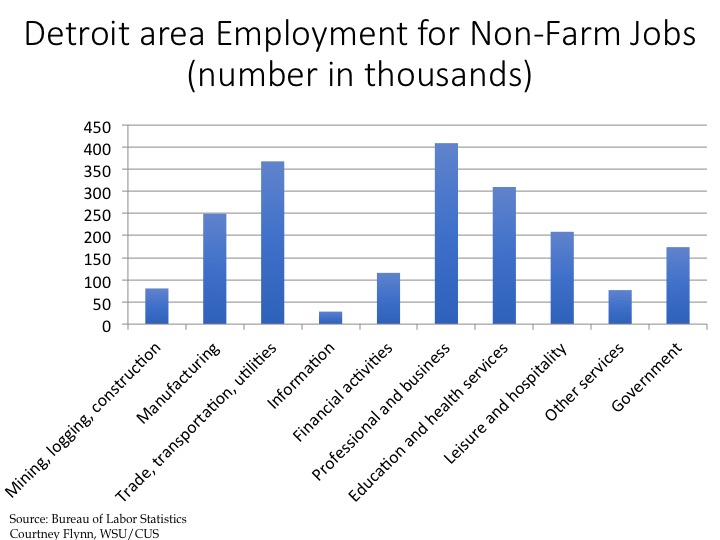
According to the BLS, the professional and business sector in the Metro-Detroit region had the highest number of employees at 408,800 while the information sector had the lowest number of employees at 28,300. The trade, transportation and utilities sector had the second highest number of employees at 367,700. The manufacturing industry had 249,400 employees, and the government sector had 173,900 employees.

Detroit Vacancy Rate Remains at 22 Percent

There were only 26 fewer vacant Detroit properties between June 2016 and June 2017, according to the U.S. Postal Service. This was a tiny decrease compared to the total number number of Detroit addresses of 396,416, but it was a decrease in vacancies. The vacancy rate in the City of Detroit remained just above 22 percent.

There were two other decreases that were probably more important. First, there was a substantial decrease in the total number of addresses, likely indicating that more vacant properties are now vacant lots. Overall, between June of 2017 and June 2016 the total number of addresses decreased by 5,388. By June of 2017 there were 396,416 total addresses counted by the U.S. Postal Service, and of these, there were 88,329 vacant addresses. Of the 396,416 total addresses, 353,140 were residential addresses and 80,296 of those were residential vacancies, meaning the residential vacancy rate was 22.7.

Second, although the decrease in the number of vacant addresses was small between June of 2016 and 2017, the decline in the number of “no stat” addresses was much larger; that number decreased by 3,515 in the last year. There is substantial ambiguity in that number, though it likely indicates some improvement in the housing market. Mail carriers denote properties as being either “vacant” or “no-stat.” Carriers on urban routes mark a property as vacant once no resident has collected mail for 90 days. Addresses are classified as “no-stat” for a variety of reasons. Addresses in rural areas that appear to be vacant for 90 days are labeled no-stat, as are addresses for properties that are still under construction. Urban addresses are labeled as no-stat when the carrier decides it is unlikely to be occupied again any time soon — meaning that both areas of high growth and severe decline may have no-stat addresses.

The maps below show the Detroit address vacancy rates by Census tract for June 2017 and the change in vacancy rates between June 2016 and June 2017. In total, there were about 65 Census Tracts in Detroit with total vacancy rates above 34 percent. The Census tract with the largest vacancy rate between June 2017 and June 2016 was located in a pocket of Census tracts along I-96 where the vacancy rates did not drop below 38 percent. The vacancy rate for this Census tract 54.3 percent. When looking at the second map the data shows that the largest vacancy rate increase for a Census tract was located in Southwest Detroit; the vacancy rate increase for that Census tract was 8.4 percent. The map also shows the largest vacancy rate increases were primarily concentrated in an area just east of Hamtramck and on the western side of the city near I-96.

Overall, the story this data shows is that the number of homes in the City is decreasing, and the number of vacant homes is slightly decreasing, though the exact number is ambiguous, given the uncertainty surrounding “no-stat” numbers. The decline in “no-stat” numbers is, however, consistent with recent population estimates. According the U.S. Census Bureau, between 2015 and 2016 the City of Detroit has lost about 3,541 residents; its population in 2016 was reported to be 672,795.

Poverty, Labor Force Participation Moderately Correlated in Southeastern Michigan

As discussed throughout our most recent series, data about labor force participation highlights decreasing percentage of individuals who are not active participants in the work force. To further explore the recent labor force and poverty rate discussions, this post delves into the correlation between the 2015 labor force participation rate and the 2015 poverty levels across the Southeastern Michigan area.

A correlation is statistical technique that can be used to describe the relationship between two variables. The correlation coefficient, often expressed as ‘r’, is a numerical value that is always between +1 and -1. When r is closer to +1, it implies a positive correlation; as one variable increases, the other does as well. When r is closer to -1, it implies an inverse correlation; as one variable increases the other decreases. When the value of r is closer to 0 the implication is that there is no relationship between the two sets of data.

Looking across the region we find that labor force participation with poverty at a level of -0.46, a moderate correlation. (Note that we are using municipalities as the unit of analysis here.) This correlation tends to indicate that as labor force participation declines, poverty increases, all other factors being equal. This helps to explain why we are seeing increasing poverty in areas, including many suburban areas, where labor force participation was hit hard by the Great Recession.


We also examined the variation in this correlation across the counties in the region.


Correlation Coefficients for Southeastern Michigan Counties: Labor Force Participation and Poverty

  • Livingston County: -.4
  • Macomb County: -.24
  • Monroe County: -.18
  • Oakland County: -.28
  • St. Clair County: -.18
  • Washtenaw County: .08
  • Wayne County: -.84

These results present correlations calculated across municipalities within counties. We found that, aside from Washtenaw County, every other county in Southeastern Michigan had a negative correlation, meaning that as labor force participation declined, poverty increased. Of those six counties, Wayne County was the only one to have a strong negative correlation—(-0.84). This implies that municipalities in Wayne County with lower labor participation are very likely to have higher levels of poverty.


The correlations for five other counties–Macomb, Livingston, St. Clair, Monroe and Oakland–were negative but weak or moderate, meaning that there was still a tendency for poverty to increase with a lower labor participation rate, but it was weaker.


Washtenaw County was the only county in the region to have a correlation coefficient above 0, the value being +0.08, indicating a very low positive association between poverty and labor force participation.


Overall, these analyses show that six of the seven counties had weak to moderate correlation between their labor participation rates and their adult poverty rates. Wayne County was the exception to this, with a strong correlation coefficient of -0.84. Previous posts have shown that Wayne County communities also experienced some of the largest decreases in its labor force participation rates since 2010 and had some of the highest overall adult poverty rates. For example, in 2015 Highland Park had the lowest adult labor force participation at 54 percent, while the poverty rate is 49.3 percent.


In the suburbs, particularly those located nearer to Detroit (with some notable exceptions), there have been overall declines in labor force participation rates. At the same time data clearly shows that the percentage of adults in poverty has been increasing for many of the suburbs in Southeastern Michigan in recent years.

Labor Force Participation Declines Throughout Much of Southeastern Michigan

Of the 212 communities in Southeastern Michigan for which labor force data was available from the American Community Survey, 119 experienced a decrease in the percentage of 16-64 year olds in the labor force between 2010 and 2015. Alternately examining the 16 years of age and up population, 135 of the 212 communities experienced a decrease. Port Huron Township in St. Clair County experienced the largest decline in its labor force for both the 16-64 year old population and the 16 and up population. For the 16-64 year old population the decline was 17.1 percent. In 2015, 74.7 percent of the 16-64 year old population in Port Huron Township was part of the labor force, and by 2015 that had declined to 61.9 percent. For the 16 and up population, Port Huron Township had a 19 percent decline in its labor force participation rate between 2010 and 2015, making that the largest decrease in the region. In 2010, 64.6 percent of Port Huron Township’s 16 and up population was in the labor force and by 2015 that declined to 52.4 percent.

While majority of the region experienced declines in the labor force participation rate, some communities experienced substantial increases. For the 16 and up population there were five communities with a percent change increase above 20 percent between 2010 and 2015. The city of Memphis had the largest percent change between 2010 and 2015 at 25.9 percent. In 2010, 61 percent of the population was participating in the labor force, and by 2015 that number increased to 76.8 percent. For the 16-64 year old population there were only three communities where the percent increase in labor force participation rates was above 10 percent. Summerfield Township in Monroe County had the largest percent increase for the 16-64 year old population at 14 percent. In 2010, 71 percent of the 16-64 year olds participated in the work force in Summerfield Township, and by 2015 that increased to 81.2 percent.

Overall, this post shows that majority of Southeastern Michigan has experienced a decline the percentage of individuals participating in the labor force since 2010. For labor force participation, there is a clear tendency for inner ring suburbs of Detroit to show moderate or substantial declines. Exurban townships evidenced some of the highest increases in labor force participation.

Labor Force Participation Lowest in Highland Park

In 2015 the Labor Force participation rate throughout Southeastern Michigan was the lowest in Highland Park (at 58%) for those 16 and above[1] , according to the American Community Survey. For reference, the rate average rate nationally was 62.4% in September 2015. By August 2017, it was 62.9.

As the maps below show, both high and low labor force participation is generally concentrated on the two sides of Eight Mile Road, just across county borders–low in northern Wayne County in the Detroit and Highland Park area, high in southern Oakland County in the Ferndale area.

An individual is considered part of the labor force if they have a job or are actively seeking one. The labor force participation rate is the percentage of adults who are members of the labor force.

[1] 16 and above refers to all ages including those above 64.


For those 16 and older the City of Highland Park had the lowest labor force participation rate in the region at 58 percent for those 16 and older and 54 percent for those between the ages of 16-64. In the City of Detroit the labor for participation for those 16 and older was 63 percent; it was 53 percent for those between the ages of 16 and 64. While there was a pocket of Wayne County where the labor force participation rate wasn’t above 55.2 percent for those 16 and older and above 65 percent for those between 16 and 64, the majority of the region had labor force participation rates between 62.2 percent and 71.4 percent for those aged 16 and older and between 72.7 percent and 80.5 percent for those between the ages of 16 and 64. Just as there was a concentration of low labor force participation in Wayne County in and around Detroit, there was a concentration of the highest labor force participation markets in southern Oakland County in the Ferndale/Royal Oak area. In Royal Oak the labor force participation rate was 74.8 percent for those 16 and older and 86.2 percent for those between the ages of 18 and 64. Ferndale had the highest labor force participation rate at for those between ages of 16-64 at 87.9 percent, and for those 16 and older and it was 73.2 percent.

An understanding of the labor force participation rate is important as it is another strong indicator of the economy. Those classified as unemployed may not be active participants of the workforce for a variety of reasons, one of which includes becoming discouraged and stopping seeking employment.

Next week we will look at how the labor force participation rate has changed between 2010 and 2015 and also examine how it correlates to the region’s poverty rates.