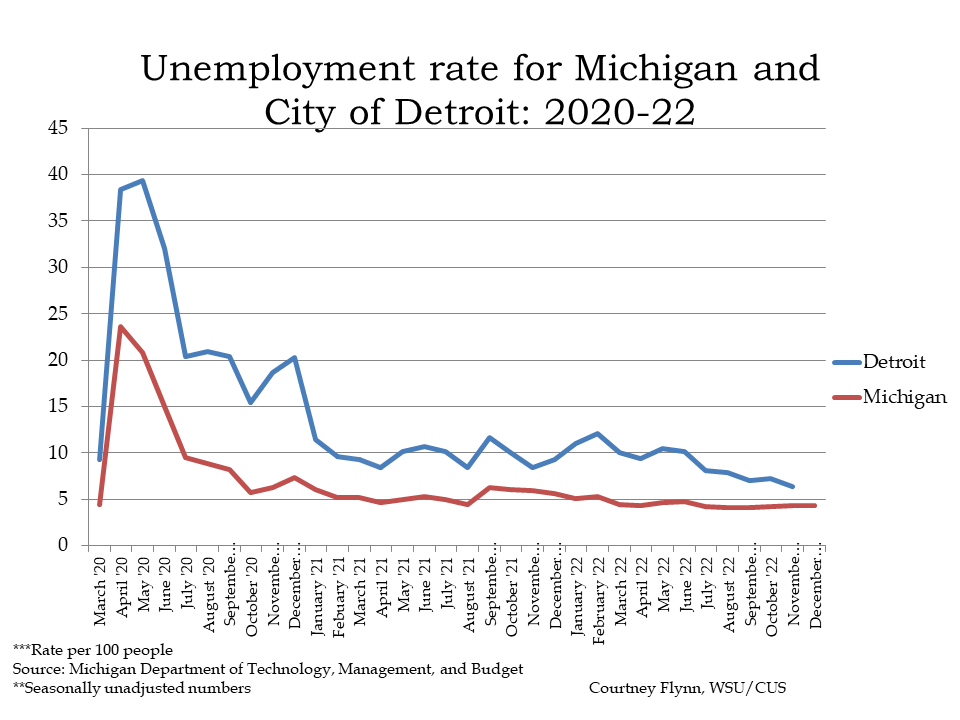
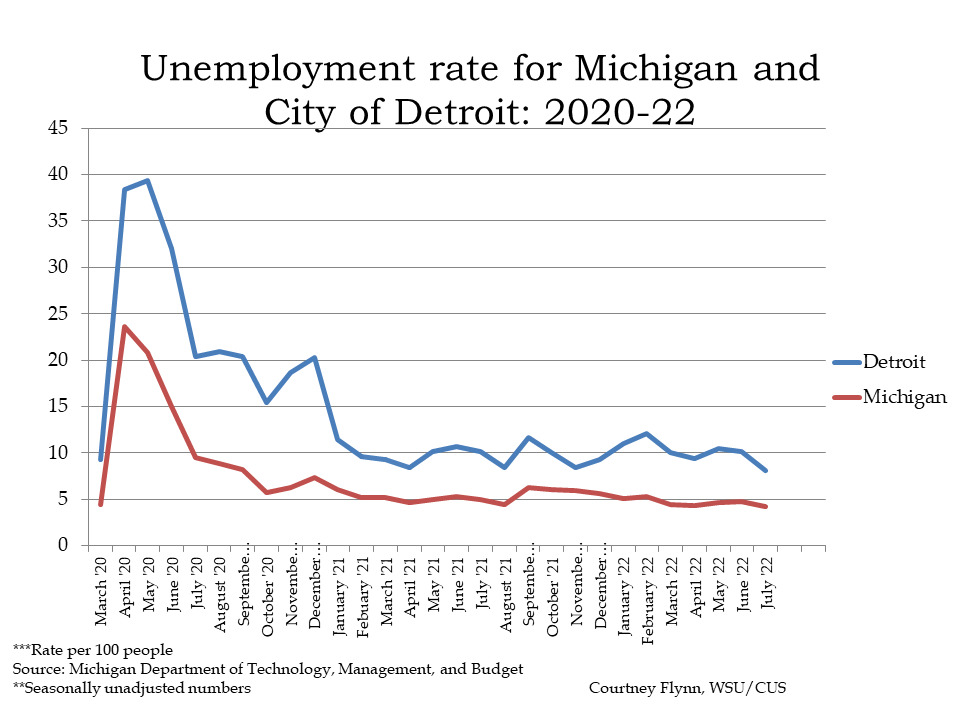
Just over seven weeks ago United Auto Workers (UAW) members who work for Ford, General Motors (GM) and Stellantis across the US strategically went on strike. The strikes began because the UAW workers have been fighting for better wages, including a restoration of cost of living pay raises, improved pension plans and additional benefits. As is noted later in this post, inflation continues to occur in Michigan, and throughout the country, and for example, 36 percent of Detroit residents earn a living wage, according to a University of Michigan Economic Outlook report.
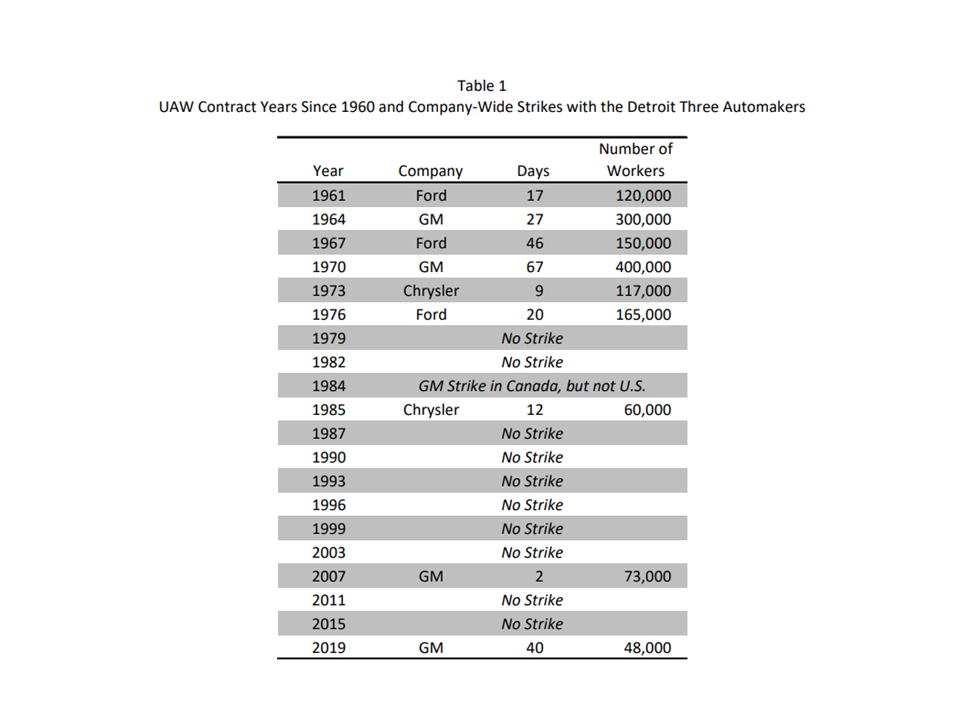
As the number of UAW facilities on strike expanded over the last six weeks so did the states where the facilities are housed. Not only has Michigan been impacted by the strikes but also California, Colorado, Kentucky, Illinois, Indiana, Kansas, Georgia, Tennessee, Florida, New York, Kansas, Massachusetts, Minnesota, Missouri, Ohio, Oregon, Texas, Virginia, West Virginia, Pennsylvania, Nevada, North Carolina and Wisconsin. With all of the Big Three having UAW employees on strike, this marks the first time this has occurred since at least 1960 during a contract negotiation year.
Now, while tentative agreements between the UAW and Ford, GM and Stellantis are moving toward ratification impacts from the strike, and the new ratified contracts, are sure to be felt. According to CBS Detroit, UAW employees of the Big Three will experience wage increases of 25 percent over the life of the contracts, along with items such as the restoration of cost-of-living allowances, the elimination of some wage tiers, increased 401K contributions and more. As these new tentative contracts make their way toward becoming reality for thousands of Big Three employees (voting and ratification still needs to occur), other automotive companies appear to be eyeing, and responding, to the changes too. According to the Detroit Free Press, Toyota recently announced they would be boosting wages by 9 percent and reducing the time it takes for workers to get to top wage; this will become effective Jan. 1.
With increased wages and improved wages coming down the pipeline soon for UAW employees, which should also have a positive affect on the overall economy, it should also be noted the financial impact the UAW strike has had. According to the Anderson Economic Group, LLC., the costs of the UAW strike reached $10.4 billion in its sixth week, with wage losses of Original Equipment Manufacturers workers being $650 million, losses to the Big 3 Manufacturers being estimated at $4.3 billion, lost wages and earnings to supplier companies and workers being estimated at $3.3 billion and loses to dealers, customers, and ancillary auto industry workers being estimated at $2 billion. With contracts still needing to be ratified, plants needing to reopen and several other housekeeping matters needing to occur, it is also projected that losses will continue for at least another short while.
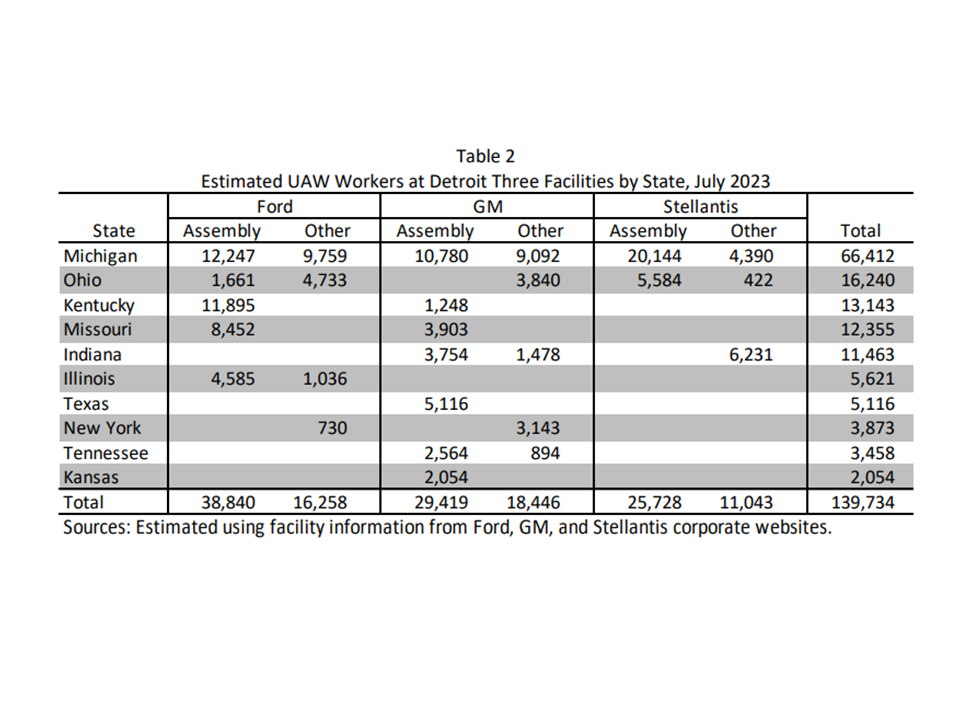
Michigan, which is home to the highest number of UAW employees, was predicted to experience personal income loss for over 66,000 people if UAW workers at the Ford, GM and Stellantis all striked. This prediction scenario was published in an Analysis of the Economic and Fiscal Impacts of Potential UAW Strike Scenarios by the University of Michigan right before the strike. While not every UAW plant went on strike these early projections do show a more drilled down look at the impacts of UAW strikes. For example, the analysis estimated personal income loss by for Ford UAW employees for a one- or two-week strike could have resulted in a total employment loss of 28,000 jobs statewide (including the 22,000 striking workers). The total personal income loss for this period could have been $50 million by the second week. Following two weeks of strikes it was projected Ford the suppliers would also begin to feel the impact of the strike (which they did), and a month after striking, the University of Michigan projected 54,000 people could have been unemployed as a result of the Ford UAW strike in the state, with a cumulative personal income loss of $150 million. Now, if the strike were to push to 8 weeks that unemployment number could grow to 105,000 total job losses in Michigan, along with a cumulative personal income loss of $610 million, according to the University of Michigan. For strikes longer than eight weeks, the total job loss for Michigan would likely remain at 105,000, but personal income losses would continue to accumulate.
This report, which was published before the strike, also hypothesized that a strike could also bring on a loss in tax revenue. According to the University of Michigan, a one-week strike could result in a loss of $1.8 million in state tax revenue. That number grows to $10.9 million for a four-week strike and $41.2 million for an eight-week strike.
While the above example sheds light on the impact a Ford UAW strike could have/had on the Michigan economy, similar effects were projected to occur with GM and Stellantis UAW workers strike too. According to the University of Michigan’s report, a one- or two-week strike at GM was projected to produce a total employment loss of 25,000 jobs (including the 20,000 striking workers), with a total personal income loss of $40 million by the second week and a $1.6 million loss in state revenue. If all UAW Stellantis employees went on strike, it was projected a one- or two-week strike could have produced a statewide total employment loss of 31,000 jobs (including the 25,000 striking workers), with a total personal income loss of $50 million by the second week. Additionally, a one-week UAW Stellantis strike could have resulted in a loss of $1.9 million in state tax revenue, according to the University of Michigan report.
As noted, the above information is all based on simulation and speculation of all UAW workers at all three companies being on strike in unison. On Sept. 15 UAW union members were instructed to go on strike, but at targeted auto plants, and not all of them. Since then, as we know, the number of plants on strike has grown, but not every plant went on strike from day one.
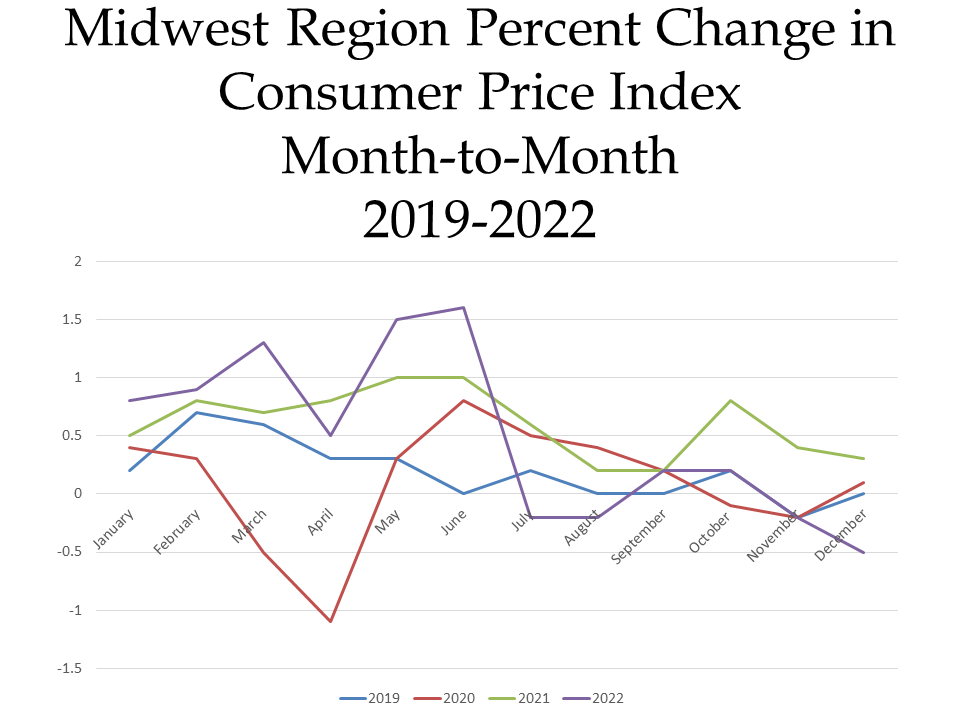
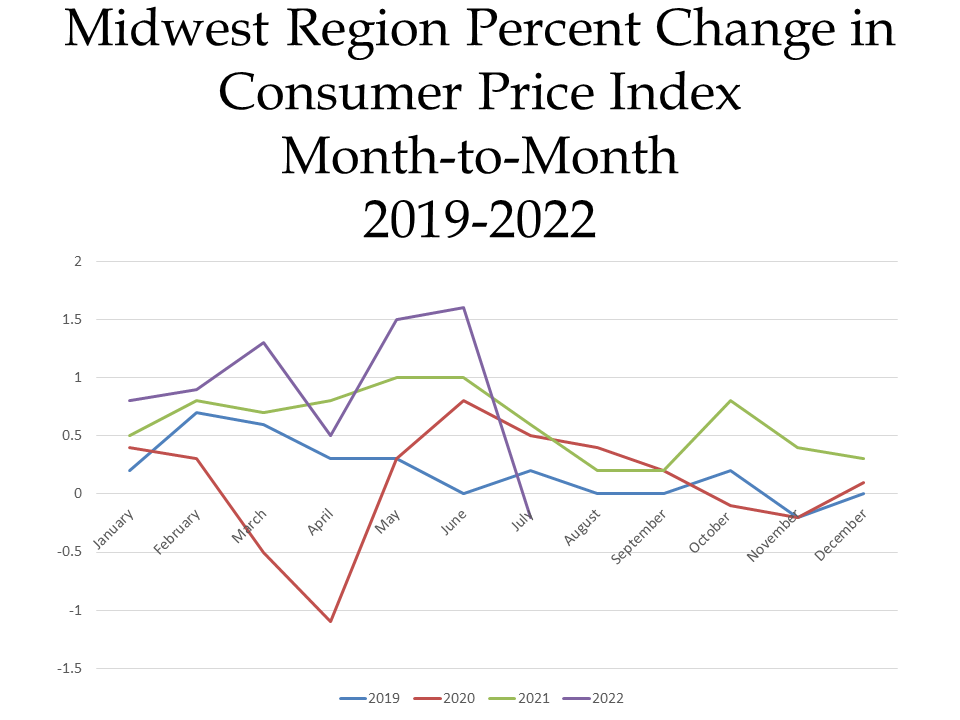
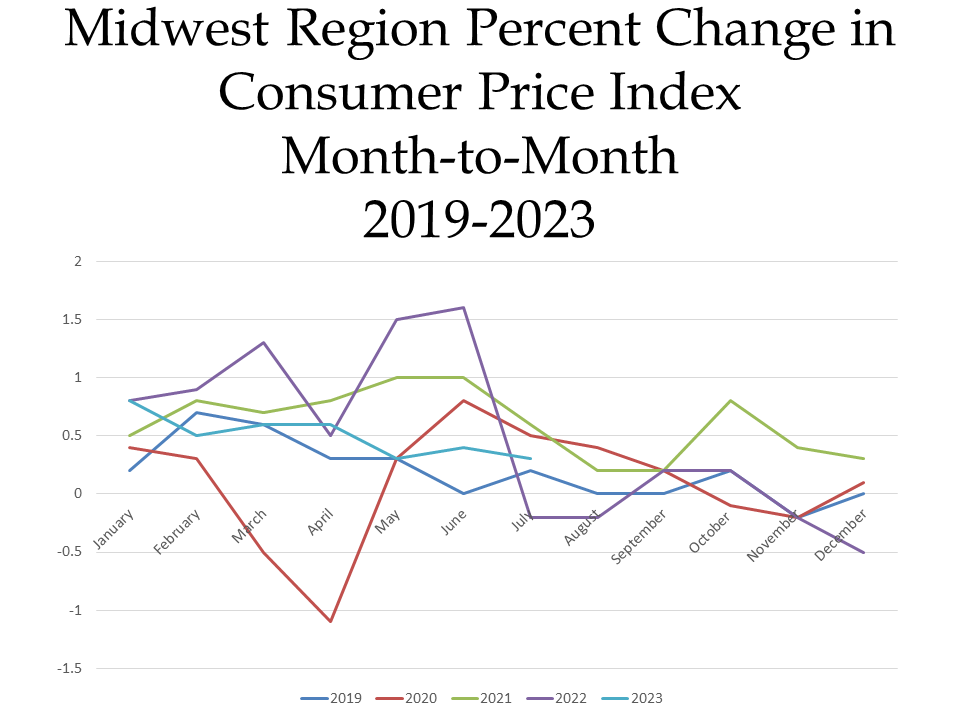
As mentioned early, one of the items negotiated into the UAW contracts was cost of living increases, which are based on the rate of inflation. The charts below show the percent changes in the Consumer Price Index (CPI) on a month-to-month basis and a year-to-year basis for each month in years 2019, 2020, 2021, 2022 and 2023 in the Midwest Region. The CPI is a measure that examines the weighted average of prices of consumer goods and services, such as transportation, food, energy, housing and medical care. It is calculated by taking price changes for each item in the predetermined group of goods and averaging them.
The first chart below highlights how the CPI changed on a month-to-month basis between 2019 and 2023. Currently in 2023, the region’s prices were up 0.2 percent in the month of August. The highlights for the change include:
•Overall, food prices declined 0.1 percent for the month of August. Prices for food at home fell 0.2 percent, while prices for food away from home (restaurant, cafeteria, and vending purchases) increased 0.2 percent for the same period.
•The energy index increased by 3.4 percent over the month, due almost entirely to an increased price in gasoline (6.7 percent). However, natural gas prices declined (0.5 percent, as did prices for electricity (0.1 percent).
•Rent (+0.4 percent) and medical care (+1 percent) and apparel (+2 percent) also contributed to the increase in the month-to-month CPI increase.
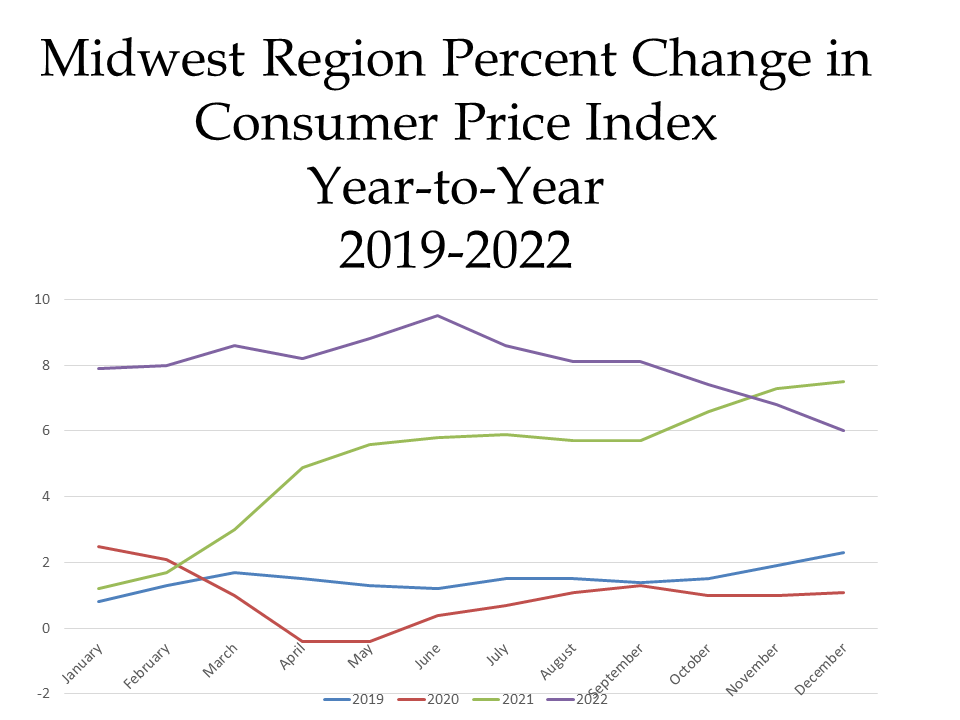
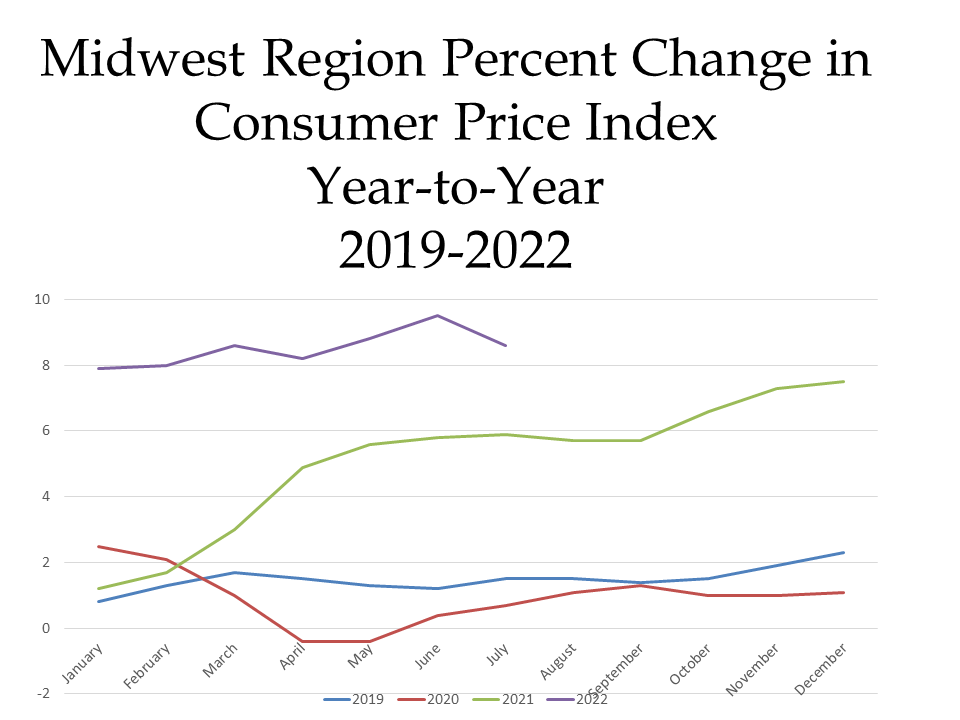
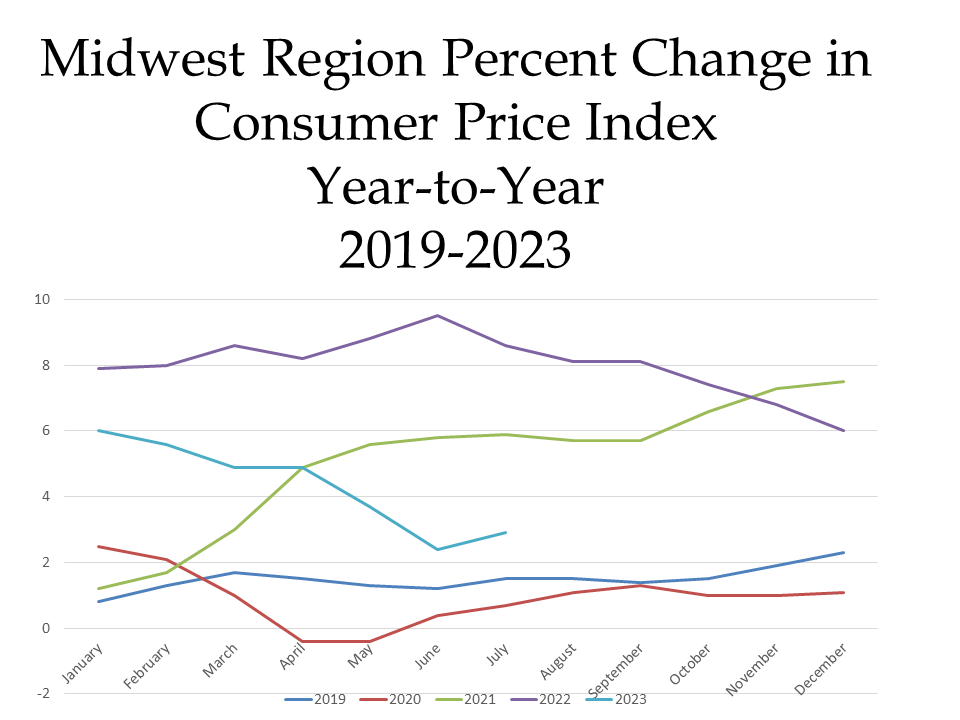
When examining the second chart, which shows how prices changed on a year-to-year basis, we see how prices remain higher than this time in 2019, 2020 and 2021 but not higher than 2022.
In August of 2023 the CPI was reported to be 3.4 percent above what it was the year prior. Contributing factors to the continued increase in the CPI include
•Food prices increasing 3.4 percent over the last year, with away from home food prices increasing 5.4 percent
•The cost of electricity decreased by 6.6 percent, with the 28.6 percent decline in the price of natural gas playing a large role in the overall decline
•Owners’ equivalent rent of residences increasing 6.9 percent and rent of primary residence increasing 7 percent
•Recreation prices increasing 4.3 percent
With cost of living continuing to increase and wages and benefits often not keeping up and increased desires for improved work life balances other workers in Michigan and beyond are also striking. In Michigan, 3,700 casino workers went a strike just over a month ago, demanding increased wages, reduced work loads and job security. In Portland, Oregon more than 3,500 members of the Portland Association of Teachers went on strike for similar reasons. This strike has shut down the 81 schools in the Portland School District.
According to an August 2023 Gallup Poll report, labor unions continue to enjoy high support in the U.S., with 67% of Americans approving of them. This is down slightly from its 2022 approval rating of 71 percent but significantly up from its 2009 approval rating low of 48 percent.
Additionally, Gallop reports, and recent events solidify that Americans have become more likely than a to want unions’ influence to improve their work lives and that they benefit various aspects of business and the economy.
In Michigan, actions by the legislature show that Unions are gaining back strength. Legislation on its way to be signed by the Governor repeals the 2023 Right-to-Work law that essentially allowed union employees to opt out of payment.