Education Related to Life Expectancy in Southeastern Michigan

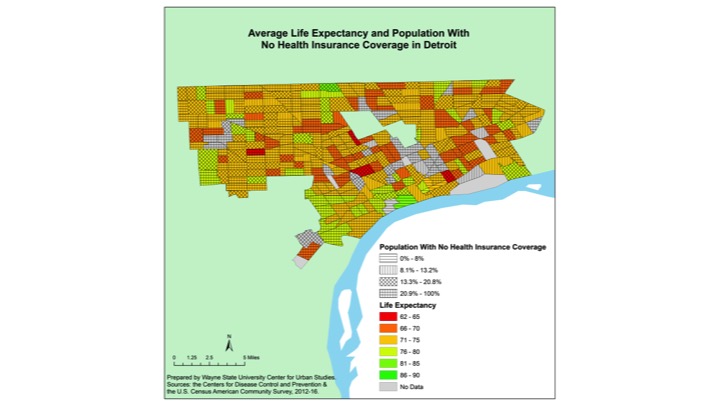
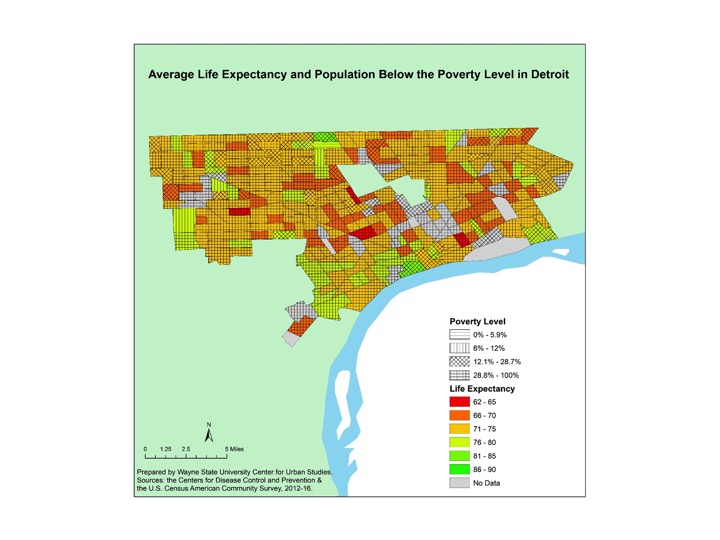
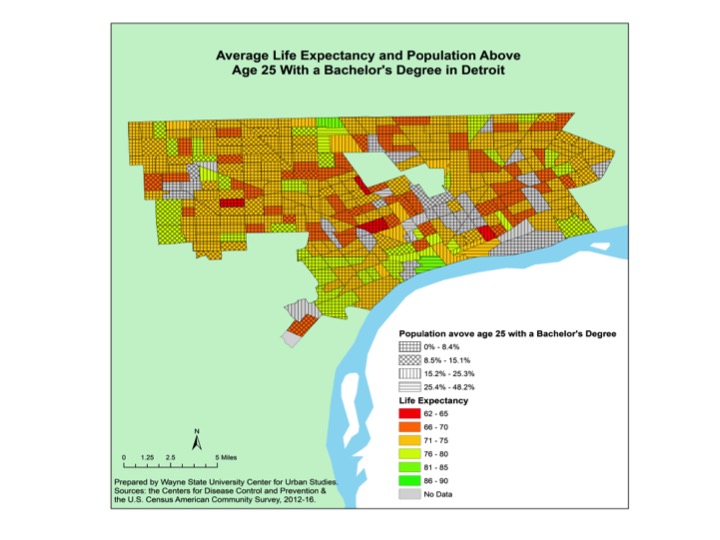
Another way to think about life expectancy is to say that it is partially a result of the choices we make, and the quality of choices might be indicated by our extent of education. Here we have represented education by the percent of a tract’s population over 25 that has a bachelor’s degree or higher. One could argue, appropriately, that getting a college education is at least partially a function of family income, but for now we want to see the simple correlation of this measure or education and life expectancy. We find a correlation between life expectancy and those with a bachelor’s degree or higher is 0.721 (sig. 0.00), meaning, as an individual’s education level increases so does their average age of life expectancy. In Detroit, the map below shows that majority of the Census Tracts that make up the City have about 8 percent of the 25 years of age and older population having earned a bachelor’s degree or higher. And, as we’ve discussed throughout this series, Detroit has among the lowest average life expectancy rates in the Southeastern Michigan region. The two Census Tracts in Detroit with the highest life expectancy rates (86-90 years of age) also have the highest percentage of individuals age 25 years and older with a bachelor’s degree or higher. The one Census Tract just south of 8 Mile Road with the highest average life expectancy rate has between 15 and 25 percent of the 25 years of age and older population having earned a bachelor’s degree or higher. The other Census Tract in Detroit with the highest average life expectancy is just southwest of Downtown Detroit and has between 25 and 48 percent of the 25 and older population having earned a bachelor’s degree or higher. On the opposite side of the spectrum, three of the four Census Tracts in the Detroit with the lowest average life expectancy (62-65) also have the lowest percentage of residents 25 years of age and older who earned a bachelor’s degree or higher.

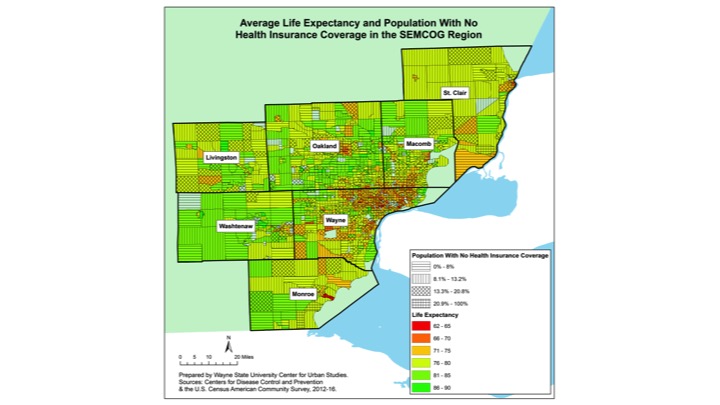
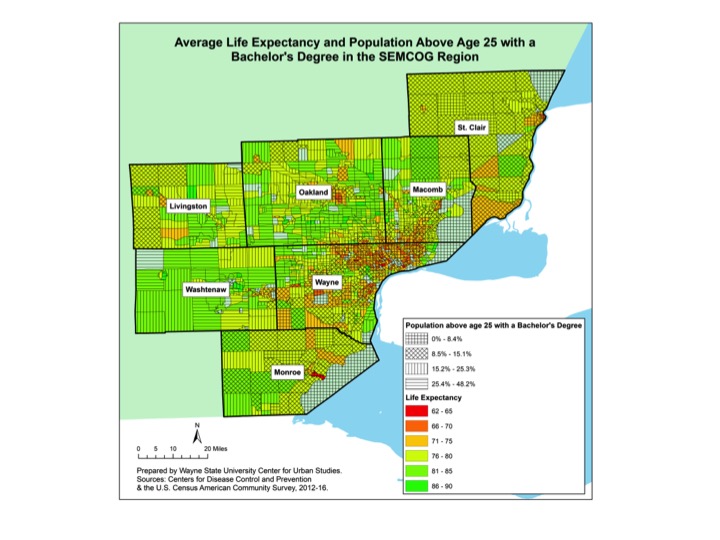
Outside of Detroit there are similar trends: communities with lower average life expectancies tend to also have lower percentages of individuals with a bachelor’s degree or higher. For example, the majority of Washtenaw County has an average life expectancy at 86 years of age or older. Additionally, the majority of that county has 15 percent or more of the 25 years of age and older population having earned a bachelor’s degree or higher. There are exceptions, areas in the more rural counties, particularly Monroe and St. Clair counties, though that have average life expectancies above the regional average but have lower percentages of individuals living with a bachelor’s degree or higher.

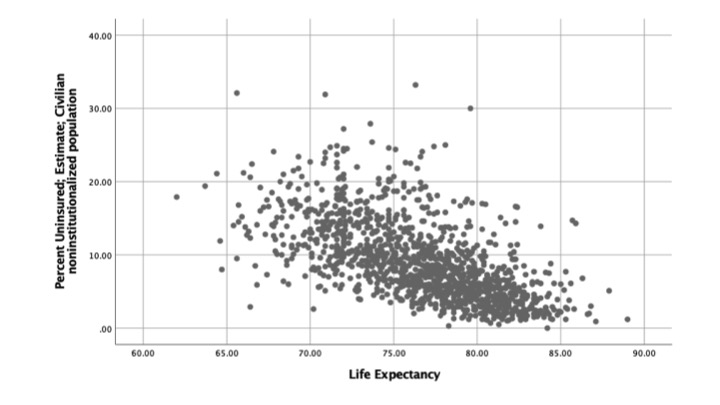
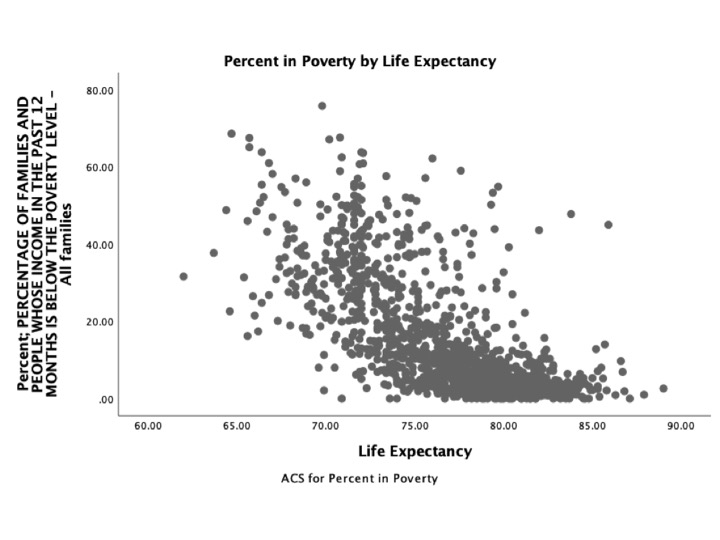
As has been shown above, there is a strong positive correlation between the percentage of individuals 25 years of age and older who earned a bachelor’s degree or higher and an individual’s life expectancy. This positive correlation is further demonstrated in the scattergram below, which shows that as the percentage of the population with a bachelor’s degree or higher increases, so does the average life expectancy. The chart also shows that majority of the population in Southeastern Michigan has a life expectancy between 70 and 80 years of age with 20 percent or less of that population having earned a bachelor’s degree or higher. Additionally, the chart shows that any area with a population that has 60 percent or more of the population having earned a bachelor’s degree or higher has an average life expectancy of 75 years of age or higher.

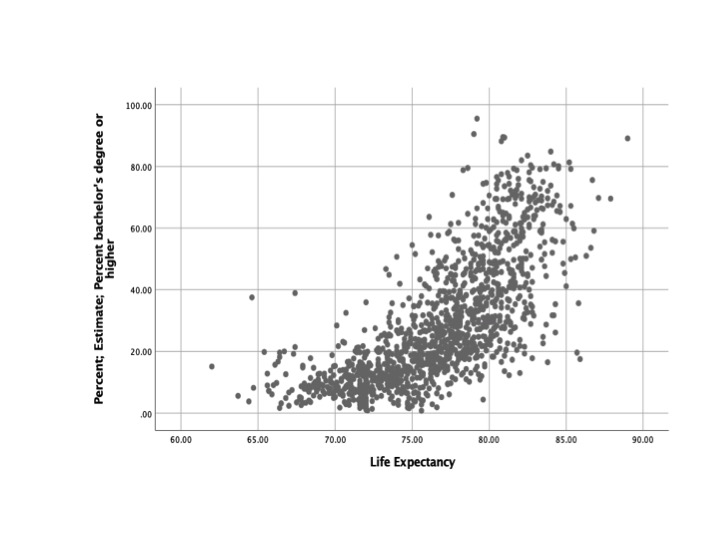
As has been shown through some of the examples above, there is a strong positive correlation between the percentage of individuals 25 years of age and older who earned a bachelor’s degree or higher and an individual’s life expectancy. This positive correlation is further demonstrated in the chart above, which shows that as the percentage of the population with a bachelor’s degree or higher increases, so does the average life expectancy. Additionally, the chart shows that any area with a population that has 60 percent or more of the population having earned a bachelor’s degree or higher has an average life expectancy of 75 years of age or higher.

Overall, these maps and the graph show that education is related to an individual’s life expectancy. Reasons for this include, tendency to earn higher wages, which allows easier access to health care and transportation. In a recent News Scientist article it was also stated that more education leads to higher life expectancy because education improves an individual’s cognitive abilities, which allows for better planning and self-control.

Next week, we will further examine how all three factors, education, access to health insurance and poverty, all affect an individual’s life expectancy.

Lower Life Expectancy Related to Lack of Health Insurance

The correlation between life expectancy and those who are uninsured is -0.617 (sig. 0.00), meaning that there is moderately strong tendency for the length of life to decline as lack of access to health care (i.e. being uninsured) increases. In general, those without health insurance tend to live shorter lives. For example, in the City of Detroit, there are more than 25 different Census Tracts where residents have a life expectancy of 70 years of age or less. Of those Census Tracts, majority of them have 21 percent of the population or more living without health insurance. Even as life expectancy increases to the median range of the spectrum in Detroit, the evidence shows that majority of the Census Tracts have about 13 percent of the population or more without health insurance. Interestingly though, only one of the four Census Tracts where the average life expectancy is 65 years of age has 21 percent or more of the population living without health insurance. The other three Census Tracts with such an average life expectancy has between 13 and 21 percent of the population living without health insurance.

When moving beyond the boundaries of Detroit, in many of the outer-ring suburbs life expectancy increases as does the percentage of residents with health care. For example, majority of Washtenaw, St. Clair and Monroe counties have less than 13 percent of the populations living without health insurance and average life expectancies at 76 years of age or higher. With the exception of one Census Tract in southern Monroe County, no other areas in those three outlying counties have more than 21 percent of the population living without health insurance. As you do move in closer to Detroit though, there are wider ranges of life expectancies and access to health care. In Wayne County, for example, areas such as Romulus and Lincoln Park also have lower life expectancies (70 years of age or less) and more than 21 percent of the population not having health insurance. But, there are also areas, such as Grosse Ile, where the average life expectancy is 86 years of age and above and 8 percent or less of the population do not have health insurance. While the average life expectancy tends to be higher in Macomb and Oakland counties, there are still pockets, such as South Warren, Mt. Clemens and Pontiac, where the average life expectancy is 70 years of age or less and those without health insurance is at about 13 percent or higher.

As has been shown through some of the examples above, there is a moderately strong negative correlation between the percentage of the population living without health insurance and the average life expectancy of Census Tracts in Southeastern Michigan. This is further demonstrated in the chart above, which ultimately shows that as the percentage of the population living without health insurance increases the average life expectancy decreases. The chart also shows though that majority of the Census Tracts in Southeastern Michigan have an average life expectancy of about 75 years of age or higher with 10 percent of less of the population living without health insurance.


Overall, these maps and the graph show that while there is a range in life expectancies in Southeastern Michigan, there is also a range in those with access to health care, particularly those in and around Detroit. Access to health care is important as health care providers can not only treat, but also prevent, a plethora of illnesses and diseases. Such knowledge and treatment is vital for longer life expectancies.

Economic Indicators: Unemployment Drops in Detroit

  • In November unemployment rates remain stagnant at the state level, decrease in Detroit;
  • Majority of Southeastern Michigan counties have higher average weekly wages than the national average;
  • Housing prices continue to rise in Metro-Detroit.

In November of 2018 the unemployment rate for the State of Michigan was 3.9, a rate that did not change from the previous month, according to the most recent data provided by the Michigan Department of Technology, Management and Budget. The State unemployment rate for November of 2017 was 0.7 points above what it was in November of 2018.

The Detroit rate was 1.3 points lower in November of 2018 from the previous month. Also, the November 2018 unemployment rate for Detroit was 0.2 points higher than what it was in November of 2017.

The chart above displays the unemployment rates for each of the seven counties in Southeastern Michigan for November of 2017 and 2018. All declined except for Livingston, which stayed the same. In November of 2018 Wayne County had the highest unemployment rate at 4.6, with St. Clair County having the second highest regional unemployment rate 4.1. Livingston, Oakland and Washtenaw counties were the only three in the region with unemployment rates at or below 3 in November of 2018. The unemployment rate for Livingston County was 2.9, the unemployment rate for Oakland County was 3 and the unemployment rate for Washtenaw County was 2.6.

Washtenaw County experienced the largest decline, with the November 2017 unemployment rate being 3.3 and the November 2018 unemployment rate being 2.6.

Regionally, according to the Bureau for Labor Statistics, Oakland County has the highest average weekly wages for all industries at $1,168, with Washtenaw County following closely at $1,134 and Wayne County just behind that at $1,125. The U.S. average weekly earnings were $887; St. Clair and Livingston counties are the only two in the region with average weekly earnings below the national average.

The above chart shows the Standard and Poor’s Case-Shiller Home Price Index for the Detroit Metropolitan Statistical Area. The index includes the price for homes that have sold but does not include the price of new home construction, condos, or homes that have been remodeled.

According to the index, the average price of single-family dwellings sold in Metro Detroit was $124,840 in November 2018; this was $30 lower than the average family dwelling price in October. The November 2018 price was an increase of $6,990 from November of 2017 and an increase of $15,050 from November of 2016, an increase of $21,570 from November of 2015 and increase of $26,620 from November of 2014. Note that the amount of annual increase is declining steadily.

Poverty Affects Life Expectancy in Detroit, Region

There is a huge variation in life expectancies in Southeastern Michigan, from an average of 62 years in the lowest Census Tract to a high in 85.9 in the highest tract. Moreover life expectancy is closely and negatively related to poverty. The correlation between life expectancy and poverty is -0.713 (sig. 0.01), meaning that there is moderately strong tendency for the length of life to decline as poverty increases in a tract. Or, put simply, poor people die sooner, a lot sooner. Both the maps and chart below present the relationship between shorter life expectancy and poverty or conversely lower levels of poverty in a tract and higher average life expectancy. At the same time, the majority of the areas in Southeastern Michigan have 20 percent or fewer of families living below the poverty line, along with average life expectancies between about 75 and 85 years of age. For reference, the average life expectancy in the United States is about 79 years of age and the federal poverty level for a family of four is $24,300. In 2017 12.7 percent of the U.S. population was living in poverty.

For the City of Detroit there is an average life expectancy across tracts is 71 to 75 years of age, although there are several Census Tracts where the average life expectancy is well below 70. Most of the Census Tracts in Detroit, especially those with lower life expectancies, have more than 28 percent of the population living at or below the poverty line. Specifically, there are three Census Tracts in Detroit where the average life expectancy is between 62 and 65 and the percentage of the population living below the poverty line ranges from about 29-100 percent (the highest threshold in the Detroit map below). While Detroit demonstrates the correlation between higher than average poverty rates and lower life expectancy, there are certain parts of the region where the life expectancy is about on par with the national average (78.8 years of age) but the percentage of the population live in poverty is at or below the national poverty rate (12.7 percent). These examples occur in the mainly the rural areas of the region, such as parts of St. Clair, Livingston and Monroe counties. In general though, radiating out beyond Detroit and the inner-ring suburbs, poverty levels decrease, and the average life expectancy increases. For example, in nearly all of western Washtenaw County the average life expectancy ranges from 81-85 with the poverty levels being at or below 12 percent.

As has been attributed in some of the specific examples noted above, there is a moderately high negative correlation between the percentage of the population living at or below the poverty line and the average life expectancy of Census Tracts in Southeastern Michigan. When looking at the median poverty levels of the region with the life expectancies there is a -0.713 P value, which is statistically significant at the .01 level. What this means is that as the percent in poverty increases, there is a tendency for average life expectancy to decrease.

Overall, these maps show that throughout Southeastern Michigan there is a wide range in life expectancy and poverty levels, with outer ring suburbs faring better and more urban areas, such as Detroit, and some rural areas faring worse. While we see here that poverty does relate to average life expectancy rates, other factors that may also affect average life expectancy include access to health care and educational attainment. The correlation between these factors and the average life expectancy will be explored in the next two posts.