Life Expectancy Declines in Michigan, US

The average life expectancy for Americans decreased in 2020, according to the National Center for Health Statistics, and the same goes for Michiganders.

According to the National Center for Health Statistics, which is run by the Centers for Disease Control, the average life expectancy of an American in 2019 was 79 years of age and by 2020 that decreased 77 years of age. In 2021, the National Center for Health Statistics reported the average life expectancy of an American decreased to 76 years of age. For Michigan, the Michigan Department of Community Health did not have data for 2021, but for 2020 the average life expectancy of males and females, both white and black, declined.

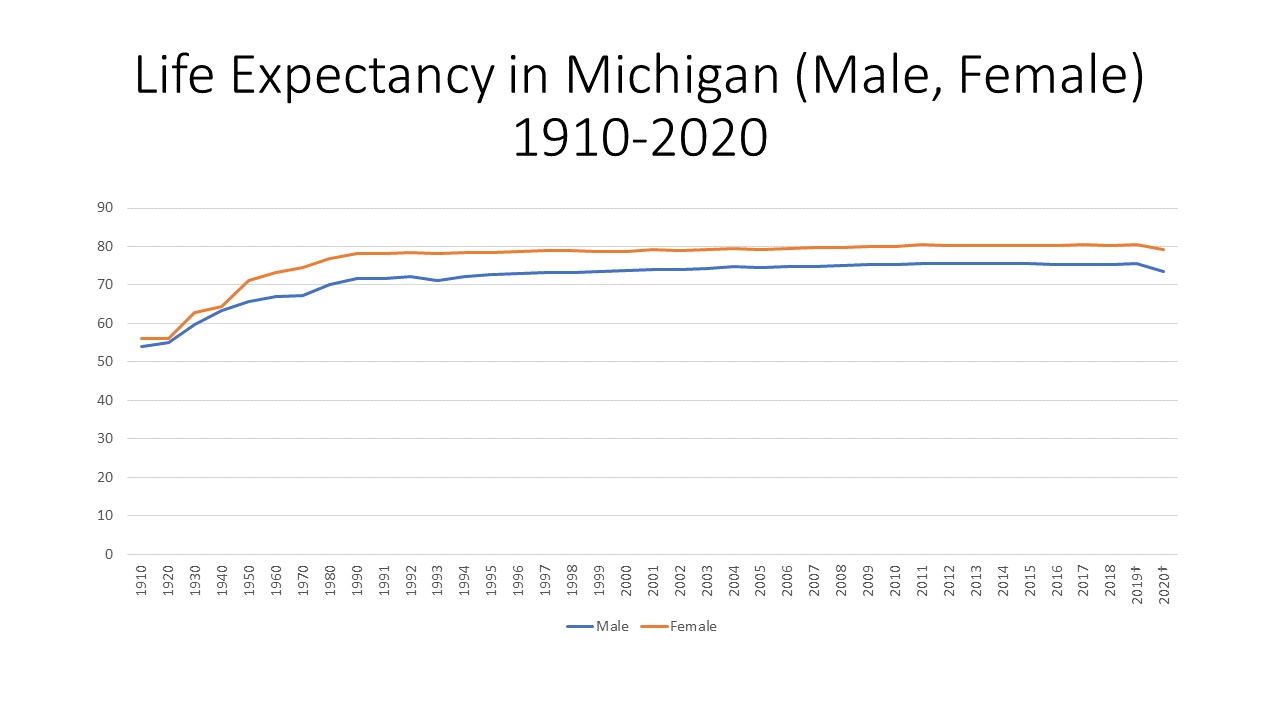
The first chart below shows that between 2019 and 2020 the life expectancy for females declined from 80.6 years of age to 79.2; for males the average life expectancy declined from 75.7 years of age to 73.6. Prior to the reported 2022 average life expectancy ages, the last times they were as low was in 2002 for females (79 years of age) and 1999 for males (73.4 years of age).

According to the Centers for Disease Control, the top 10 contributing factors to death for those who live in Michigan in 2020 were:

•Heart Disease (117,087 deaths)

•Cancer (21,118)

•COVID-19 (11,362)

•Accidents (6,044)

•Stroke (5,873)

•Chronic Lower Respiratory Disease (5,644)

•Alzheimer’s Disease (4,860)

•Diabetes (3,408)

•Kidney Disease (1,940)

•And Influenza, Pneumonia (1,880)

While we know the leading causes of death, it is believed by the CDC that the pandemic likely drove the recent decline in the average life expectancy for Americans, across the board. In Michigan, COVID-19 itself attributed to 11,362 deaths in 2020. We also know that the number of deaths related to heart disease, accidents, influenza/pneumonia, kidney disease, diabetes and stroke increased between 2019 and 2020, as did the drug overdose rates.

So, while the numbers above help frame the story as to why Michigan’s average life expectancy is decreasing, digging into the data another way also tells another story.

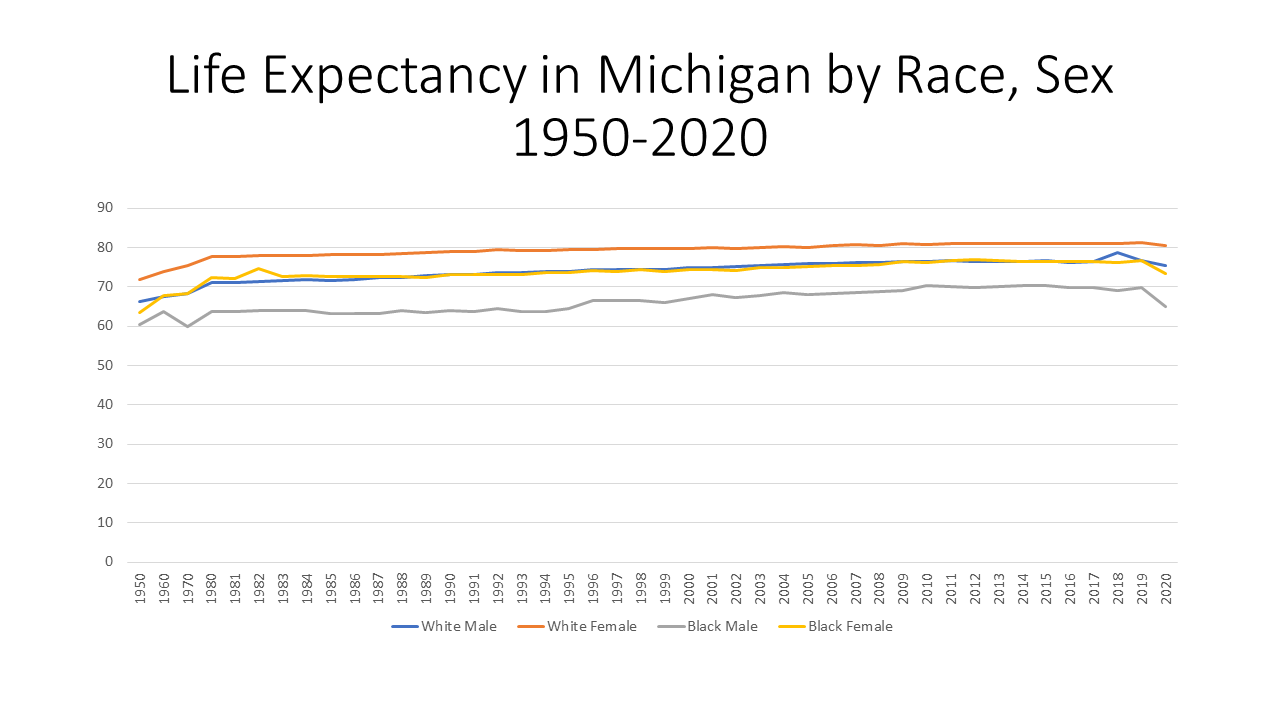
The Michigan Department of Community Health publicly presents data on the average life expectancy broken down by both sex and race. As shown above, overall, females have long had a higher life expectancy over males. However, when further breaking down the data, we see that black females and white males in Michigan have had nearly the same life expectancy since 1910. In 2020, the average life expectancy for black females in Michigan was 73.3 years of age, a decrease of 3.3 years from 2019. The average life expectancy of white men in Michigan was 75.3 years of age in 2020, a decrease of 1.3 years from 2019. White females in Michigan experienced a 0.9 decrease in average life expectancy, which was the smallest decrease of the four groups. It was black males who had the largest decrease in life expectancy between 2019 and 2020 in Michigan at 4.8 years; in 2020 the average life expectancy for black males in Michigan was reported at 64.9 years of age. The last time the average life expectancy for black males was that low, or lower, was in 1995 when it was reported to be 64.4 years of age.

According to the Michigan Department of Community Health, the top leading causes of death for black males in Michigan in 2020 were:

•Heart Disease (2,430 deaths)

•COVID-19 (1,610)

•Malignant neoplasms (1,272)

•Accidents (799)

•Assault ( 512)

Note that assault is not even among the overall the top 10 causes for Michigan citizens overall.

While we mentioned the effect COVID-19 has had on life expectancy, as well as drug overdoses and the increase mortality rates related to other diseases, it should also be noted that number of individuals with access to health care has increased in recent years. So, as the average life expectancy is decreasing, more individuals are receiving greater access to health care, an odd result, but probably the effect of COVID has overtaken the benefits of better care.

Overall, decline in life expectancy for all sexes and races is concerning as it means people are dying earlier than they should be.

Inflation Puts Strain on Food Banks, Families in Southeastern Michigan

Rising inflation is hitting people all over the metropolitan area. For example, food banks are experiencing increased use, according to local media outlets. In the Metro-Detroit area major food banks include Gleaners Community Bank and Forgotten Harvest; these organizations not only supply food to those in need via their mobile food pantries and sponsored distribution events; they also provide food to soup kitchens, other organizations’ food pantries and other programs. According to MichiganRadio.org, in March of 2022 Gleaners Community Food Bank had about 13,000 visits to its mobile food pantries; the average number of visits in the six months prior to that was about 9,000. Feeding America West Michigan experienced a 34 percent increase in visits between February and March of 2022, according to the April 2022 Michigan Radio. A recent Model D article states that the Capuchin Soup Kitchen experienced a 25 percent increase in visits in the last year. Additionally, the same Model D Media article reports that Forgotten Harvest recorded a 30 percent increase month-to-month between April, May and June of this year. According to the article, Forgotten Harvest served 16,000 individuals in the month of June— 10,400 more than in the same month last year.

The charts below show just what inflation means to the average person. For example, in the first chart below, according to the Bureau of Labor Statistics,  the cost of meat, poultry, fish and eggs has increased by 8.4 percent in the Metro-Detroit area between July of 2021 and July of 2022. Dairy has increased by about 20 percent in that time frame and cereal and bakery goods have increased by about 19.3 percent. As we know, not only are food prices increasing but so is the cost of housing, utilities and gas. Gasoline has experienced the largest consumer price index increase in the last year at 63.9 percent.

Another way to view inflation is to understand how the value of a dollar, or $100, has changed. The chart below uses $100 in June of 2000 as a reference point to show inflation over the last 22 years. So, for example, $171.46 today would be the same as $100 in June of 2000. In other words, the purchasing power of the dollar has continually decreased, except between 2008 and 2009. Between 2020 and 2022 the purchasing power of the dollar has had the largest decrease since 2000. Between 2020 and 2022 there was a $21.52 difference in the power of the dollar. What you could buy for $149.74 in 2020 increased to $171.46. And again, these dollar figures are comparable to what $100 would be worth in 2000.

The data and anecdotal stories show just how inflation, coupled with supply chain issues, are impacting families throughout Michigan, Metro-Detroit and beyond. Seeing the writing on the wall, the Food Bank Council of Michigan received a $50 million one-time allocation in the 2022-23 State Budget to support ensuring families across Michigan could access food. These funds will increase infrastructure to better serve Michigan’s northern counties and Upper Peninsula through decreasing transportation expenses. The funding will also be used to conduct a Hunger Study, providing data to align federal, state and commodity programs to meet residents’ needs. According to the Food Bank Council, it is paying 40 percent more to keep up with food pantry demands across the state.
Additional allocations to food banks will certainly help with the increased use in food pantries, but the State Budget funding was a one-time allocation and the duration of the increased use in food pantries is unknown. The state, and federal government, though are working toward food security through other avenues as well. For example, about 1.3 million people from about 700,000 households in Michigan receive federal Supplemental Nutrition Assistance Program (SNAP) benefits through the state’s Food Assistance Program. Since the COVID pandemic began, all household have received the maximum benefits allowed for their size, and this practice continues. Following the May 2021 SNAP benefit amount increase, households of the following sizes are receiving the corresponding max benefit amount:

·One Person: $250  
·Two Persons: $459  
·Three Persons: $658  
·Four Persons: $835  
·Five Persons: $992  
·Six Persons: $1,190  
·Seven Persons: $1,316  
·Eight Persons: $1,504  
In August, households receiving SNAP benefits had an additional $95 added to their Bridge card to help further combat the affect inflation is having on food costs. How long this will last is unknown as federal approval of the increased SNAP benefits is necessary every month.
Schools are also working to create greater food security for students but either adopting a universal free lunch policy for all students, or at least sending free and reduced lunch applications to all households in the district. According to the Kids Count Data Center, 715,000 of Michigan public K-12 students qualified for free or reduced lunches’ income bracket in 2021. During that time though, all students—nationwide—received free lunches as part of a federal program implemented in the height of the COVID pandemic. This school year though, that policy does not exist and Michigan does not have a universal school lunch policy. Detroit Public Schools implemented one though, as have some others throughout the story. For the many districts that do not have such a policy, free and reduced lunch applications are being sent to all homes so eligible students can receive the service. For reduced meals, breakfast is $0.30 and lunch is $0.40. Income eligibility information can be found here.

We know that food banks are meeting, and serving, just some of the thousands upon thousands of individuals being impacted by the affects of inflation. However, long-term assistance to such food banks remains unknown, as direct long-term funding from state entities isn’t certain, and with economic concerns growing, donations may decrease. Food pantries serve a vital role in our community, as do programs such as SNAP and the Free and Reduced School Lunch Program. Food insecurity is an issue hundreds of thousands Americans face daily and long-term strategies to create food security need stronger framework and better funding.

To find a food bank in Michigan click here.

Housing Prices Begin to Stabilize, CPI Takes A Dip in Metro-Detroit

Michigan’s unemployment continues to decrease, for the tenth straight month, and the labor force in the state continues to grow. This year is looking much rosier than in 2020 when great uncertainty riddled the state, and the country. With job recovery following the peak of the pandemic, and an increase in revenues from the sales and use tax and federal funding the state is predicting about a $5 million surplus. While such a surplus can viewed as a sign of improved economic times, we must also recognize inflation is on the rise, and uncertainty still looms with COVID and the war in Ukraine. Recognizing that inflation is hitting the homes of most, if not all, Gov. Gretchen Whitmer was proposed sending $500 to working Michigan families in attempt to help ease the strain on our pockets. The Republic led majority legislature is discussing a $2.5 billion plan that would cut taxes. What will happen remains unknown, especially as the project surplus is just an estimate.

But the data below does tell that story that Michigan’s economy is on the rise while the costs of goods and services is also on the rise.

The chart below provides a more detailed look at how unemployment rates are currently, compared to year ago, at the local level. Across all seven counties in Southeastern Michigan unemployment rates were lower in July of 2022 as compared to July of 2021. Wayne County experienced the largest decrease in that year, with the unemployment rate decreasing by 4.9 percent. While Wayne County had the highest unemployment rate in the region in July of 2021 (9.6%), it did not have the highest rate in July of 2022. Rather, Monroe County currently had the highest unemployment rate in the region in July of 2022 at 5.4 percent. Livingston County continued to have the lowest unemployment rate in the region at 2.2 percent.


The charts below show the percent changes in the Consumer Price Index (CPI) on a month-to-month basis and a year-to-year basis for each month in years 2019, 2020, 2021 and 2022 in the Midwest Region. The CPI is a measure that examines the weighted average of prices of consumer goods and services, such as transportation, food, energy, housing and medical care. It is calculated by taking price changes for each item in the predetermined group of goods and averaging them.

The first  chart below highlights how the CPI changed on a month-to-month basis between 2019 and 2022. Currently in 2022, the region’s prices were down 0.2 percent. The highlights for the change include:

•Food prices increasing 1.2 percent for the month of July (prices for food at home increased 1.5 percent while prices for food outside of the home increased by 0.8 percent)
•Gas prices declining 8.8 percent, which contributed to the energy index decline of 5.7 percent
•Overall, prices without considering food and energy prices, rose by 0.3 percent from the month prior.

When examining the second chart, which shows how prices changed on a year-to-year basis,  we see how prices remain higher than previous years but that there was a decline in the CPI for the month of July between 2021 and 2022.

In July of 2022 the CPI was reported to be 8.6 percent above what it was the year prior (this is lower than the 9.5 percent increased experienced between June of 2021 and 2022). Contributing factors to the continued increase in the CPI include:

•Food prices increasing 12.4 percent over the last year
•Energy prices increasing 34.1 percent over the last year.
•New and used motor vehicles increasing 8.4 percent
•And household furnishings and operations increasing 10.8 percent.
While home prices in Metro-Detroit continue to increase from one month to the next, the rate at which they are increasing is beginning to taper off. According to the Case-Shiller Home Price Index, the average price of single-family dwellings sold was $172,560 in July of 2022; this was a mere $170 higher than the average family dwelling price in June. While the month-to-month increase has slowed down, a look at data from year’s prior is a reminder just how much the average price of a home has increased. Between July of 2022 and 2021 the average price increased $19,960 and between July of 2022 and 2014 the price increased $75,220.


Parks Need Priority in Funding to be Sustained

While park land is plentiful in Southeastern Michigan, its upkeep and protection is something necessary to keep it accessible to the public. As noted in our last post, park land throughout Michigan, and Southeastern Michigan, is made accessible through government entities, non-profits and/or private organizations. The funding of park lands and public spaces by non-profit and private organizations is at the will of the organizations’ board members and owners. However, funding and protecting park land through government entities is often more complex.

Government owned and operated parks throughout Michigan are funded primarily through tax dollars, but user fees, grants and donations also aid in their funding. At the state level, according to the Michigan Department of Natural Resources (MDNR), about 97 percent of funding for parks operations and maintenance is generated by user fees and royalty revenues. According to the MDNR, the breakdown is as follows:

  • 51%: Camping and lodging reservation fees
  • 26%: Recreation Passport sales
  • 15%: State-owned, oil, gas and mineral royalty revenues – which feed the Michigan State Parks Endowment Fund – (15%)
  • 5%: Concessions, shelter reservations and miscellaneous sources

Michigan’s General Fund tax dollars provide the remaining three percent of state parks funding.

At the County level, funding differs from one county to the next. For example, in Wayne County there is a millage (0.2459 mills) that funds county parks and distributes money to local communities for their parks. This millage means that the County’s general fund is not expected to make room for parks funding, but if those elected to represent Wayne County residents chose to do so in the general fund they can. Instead, through this additional millage that was voted on by the people (in 2016 and renewed in 2020) there is a dedicated funding source for a guaranteed amount of time. Through a parks millage, funding is dedicated to the creation, operation and/or upkeep of a park. When parks are funded through just the general fund the amount of money allocated to the parks, the programs and/or upkeep can vastly differ from year-to-year depending on the priorities of the elected bodies.

By simply putting a parks millage on the ballot, Wayne County showed that park improvements were a priority of theirs, and with 76 percent of voters supporting the 2020 ballot initiative this also showed that Wayne County residents also view parks as a priority.

In addition to Wayne County having a millage that helps support its parks and recreation opportunities so does Oakland, Washtenaw and St. Clair counties. In Southeastern Michigan, Monroe, Macomb and Livingston counties do not have additional funding mechanisms to support their parks.

Despite Monroe, Macomb and Livingston counties not having county-wide millages to help fund parks, there are cities in Livingston and Macomb counties that have millages to help support their parks.

For example, in Livingston County the Howell Area Parks and Recreation is supported by a 0.75 millage. This millage not only created the recreation agency that services Genoa, Marion, Oceola and Howell townships it also finances the parks and services the residents of these townships use and rely on.

In Macomb County, the cities of Roseville and Eastpointe created a joint recreation authority through a 1 mill tax levy that was originally approved by voters 2011. This millage allows the authority to operate, offer services (which produce revenue, also allowing the authority to operate) and maintain and update facilities and parks. Municipalities such as Washington and Macomb townships also have millages (one for each township, they do not have a joint authority) that support their parks and their recreation opportunities.

So, while tax dollars are a primary source of funding for our parks, and the opportunities they provide, the commitment to their allocation varies. Additionally, commitment to the funding of public parks comes from other sources as well. For example, there are the revenues generated from their use (fee structures differ from one park to the next, one program to the next and one municipality to the next), donations offered from various people and groups and grants that municipalities receive.

The grants that municipalities can apply for to support their parks are rather plentiful; the MDNR, the Southeastern Michigan Council of Governments, Ralph C. Wilson Jr. Foundation are just some of many organizations that allocate grand fund to support parks and recreation opportunities. However, grants are often a one-time allocation of funds and cannot be relied on to ensure a park, its staffing, its programs and more will continue from one year to the next.

To ensure the park land, and the programs associated with it, we all benefit from remains accessible and useable we must create dedicated funding mechanisms. Millages are one source, but must be approved by voters. And, while general fund dollars flow into a municipality on an annual basis, the allocation of those funds differs annually.