Detroit’s unemployment continues to rise

•From January 2014 to February 2014, the unemployment rate across the state decreased while in Detroit it increased (monthly);
•The Purchasing Manager’s Index for Southeast Michigan decreased from January 2014 to February 2014 (monthly);
•The Commodity Price Index increased from February 2014 to March 2014 for Southeast Michigan (monthly);
•Standard and Poor’s Case-Shiller Index shows that the prices of homes in the Detroit Metropolitan Statistical Area are beginning to level off (monthly);
•Wayne County  experienced a decrease in the number of monthly building permits pulled.

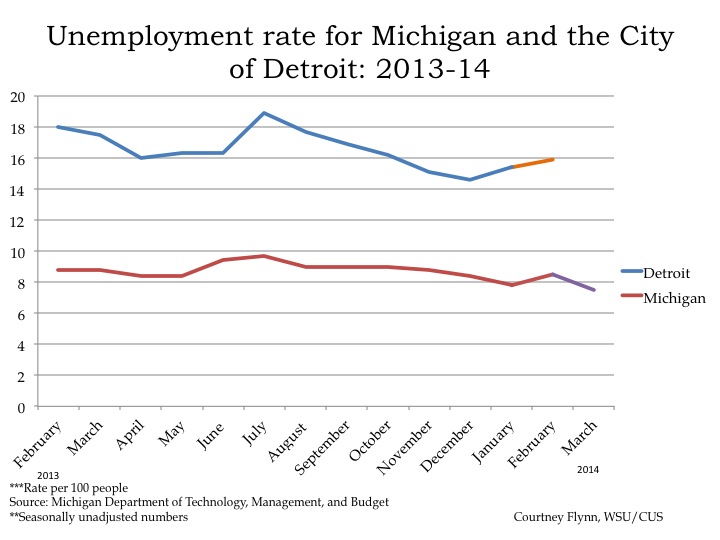
According to the most recent data provided by the Michigan Department of Technology, Management and Budget, from February to March the unemployment rate for the State of Michigan decreased from 8.5 to 7.5 percent. The City of Detroit experienced an unemployment rate increase from  15.4 percent  in January February  to 15.9 percent in February. The unemployment rate in Detroit has increased 1.3 points since December of 2013. The reporting of unemployment rates for the local level are a month behind from the state level reporting.

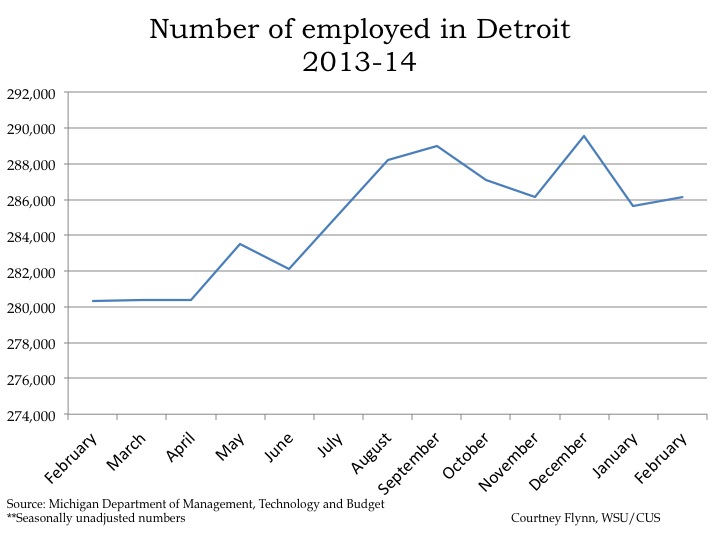
From January to February the number of people employed in the City of Detroit increased by about 500, leading to a total of to 286,136 people employed.

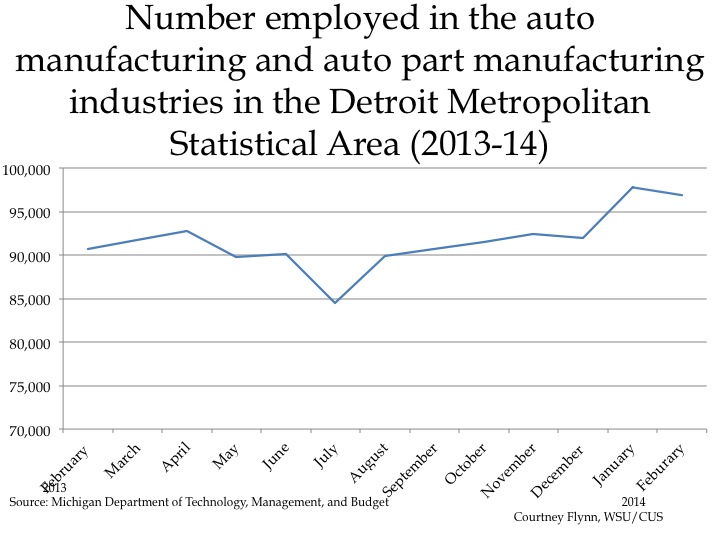
The above chart shows the number of people employed in the auto manufacturing industry in the Detroit Metropolitan Statistical Area (Detroit-Warren-Livonia) February 2013 and to February 2014. During the period under consideration, the highest employment levels in the auto manufacturing and auto parts manufacturing industries occurred in January 2014 when there were 97,800 people employed in the Detroit MSA. That  number dropped by 900 to 96,900 in February.

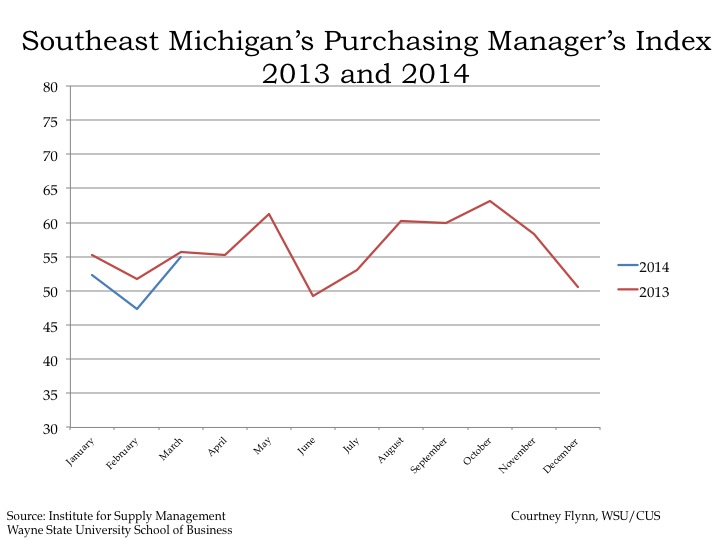
The Purchasing Manger’s Index (PMI) is a composite index derived from five indicators of economic activity: new orders, production, employment, supplier deliveries, and inventories. A PMI above 50 means the economy is expanding.

According to the most recent data released on Southeast Michigan’s Purchasing Manager’s Index, the PMI for March was 55, an increase of 7.7 points from the prior month.

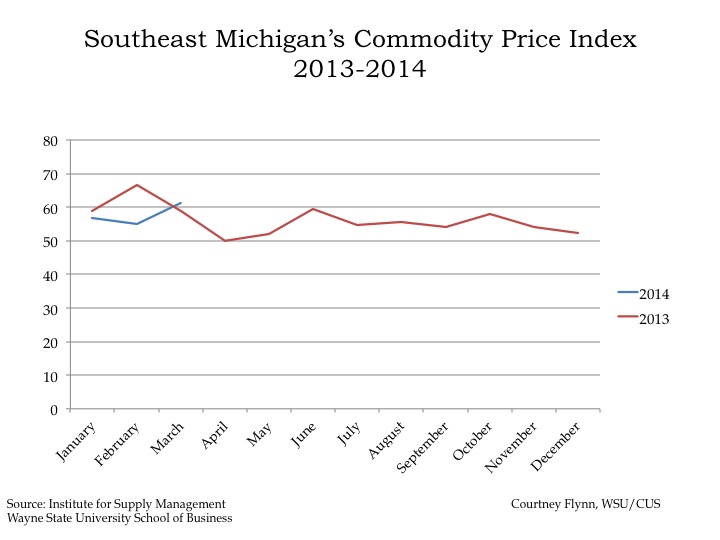
The Commodity Price Index, which is a weighted average of selected commodity prices, was recorded at 61.4 points in March, which was 3.8 points higher than the previous month.

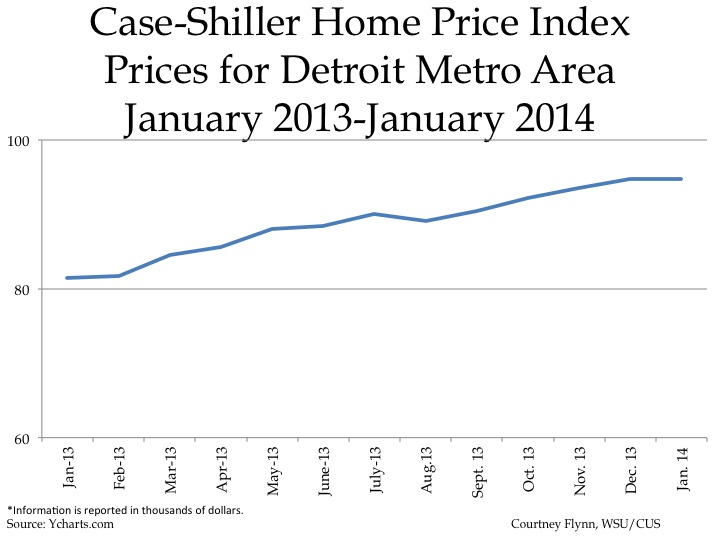
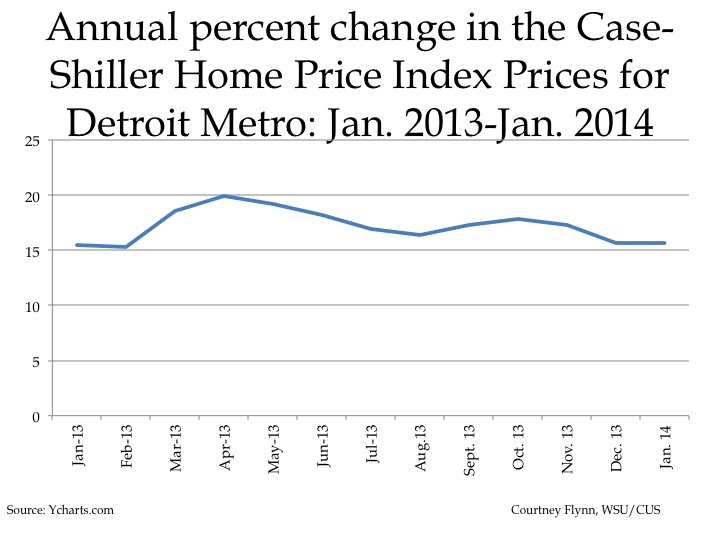
The above charts show the Standard and Poor’s Case-Shiller Home Price Index for the Detroit Metropolitan Statistical Area. The index includes the price for homes that have sold but does not include the price of new home construction, condos, or homes that have been remodeled.

According to the index, the average price of single-family dwellings sold in Metro Detroit was $94,800 in January 2014. This was an increase of approximately $13,400 from the average price in January 2013.

Also, the home prices in the area were slightly higher in January than in December while the percent changes in price from the year prior was roughly the same for those two months.

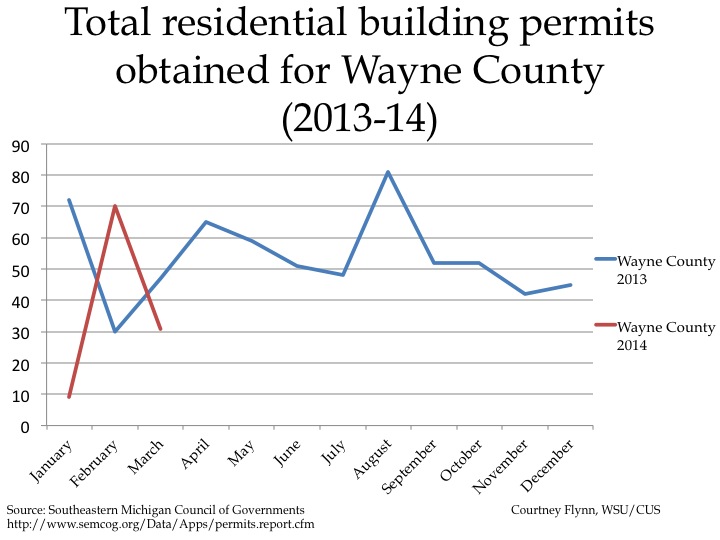
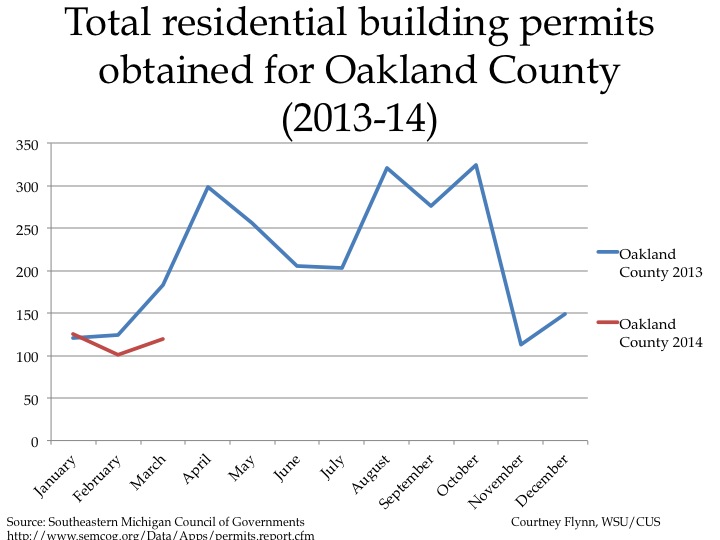
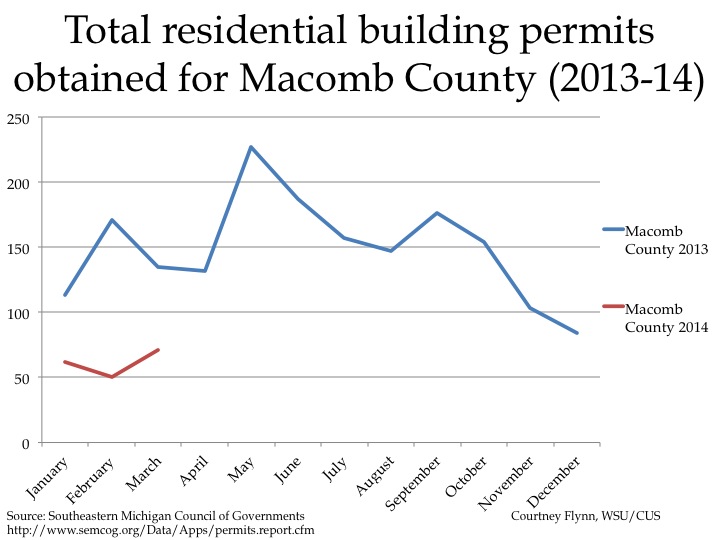
The above charts show the number of residential building permits obtained each month in Wayne, Oakland, and Macomb counties from January 2013 until February 2014. These numbers are reported by local municipalities to the Southeastern Michigan Council of Governments and include single-family units, two-family units, attached condos, and multi-family units.

Wayne County was the only one to experience a decrease in the number of building permits pulled in February 2014 to March 2014, from 70 to 31. Oakland County on the other hand with 120 permits pulled in March experienced a 21 permit increase since last month. and Macomb County had 71 permits pulled, a 21 permit increase over February.


SMART seeking millage increase

The Suburban Mobile Authority for Regional Transportation (SMART), which is currently the only functioning regional transit authority in Southeast Michigan, is looking to increase the amount of taxes it levies on an annual basis from Wayne, Oakland and Macomb county taxpayers. Currently, SMART levies .59 mils;  organizers are looking to increase that to 1 mil. It has been reported the requested increase is for solely capital needs. For example, SMART reports it needs to replace 146 40-foot busses within the next five years at a cost of about $73 million.

In addition to ridership data, this post also shows the operating revenues and expenses for the authority over the past decade. It also compares its tax support from residents to other transit authorities throughout the state. SMART was originally supported by taxpayers after a millage was approved in the 1995 August primary; this approved request was a third of a mill for years. This same request was approved again in 1998; in 2005 the millage was increased to the .59 mils.

All information was provided by public documents through SMART.

Since 2008 the number of passengers who have utilized SMART’s services has decreased by about 9,000. Following a fare increase in December 2009, average weekly ridership decreased from 39,850 in 2009 to 34,634 in 2011. Then in 2010 routes were decreased. In 2011 the average weekly ridership was 36,579 and in 2012 it dropped to 32,188.

Operating revenue for SMART has decreased by about $3.2 million since 2005. Currently, for 2014 the authority’s operating budget is $109.9 million. The authority reports that without the 1 mill tax levy, which, if passed, has a three year sunset period, it expects to have a $21.1 million deficit in 2018.

The Capital Area Transit Authority (CATA), which is based out of Lansing, has the highest revenue per capita at $61.64. The Kalamazoo Metro Transit System comes in at the lowest at $4.03. However, SMART, which covers a much larger region, brings in  $10.19 per capita in tax revenue, according to its most recent financial projections.

SMART services reach the largest population of transit authorities in the state whose information was available (Grand Rapids transit authority did not have information available). In 2013, SMART reached over 3.3 million citizens in Macomb, Wayne and Oakland counties. CATA reached the second largest population at about 267,000.

This slide shows the percent of bus shelters available to SMART riders by county. Macomb County has the largest percent of shelters at about 41 percent; Wayne County has the lowest at about 23 percent.

The above chart shows the number of vehicles SMART had in 2009 compared to currently. As can be seen, there has been a decrease in the number of all vehicles used. This is likely a reflection of the fact SMART needs new busses and has reduced service lines in recent years.

The above chart shows how the total for employee wages and salaries has changed. The year 1995 is included as a reference point to when the first millage was passed.  Then, the total for employee wages and salaries was $22 million; in 2014 that total is $35.9 million.

The next chart shows that, like salaries, there has also been a decrease in the number of SMART employees.

Below are the current routes for SMART. 

Persistent Childhood asthma increases in Detroit

Michigan’s level of asthma is higher than the nation’s, and Detroit’s is higher than Michigan’s.

This post examines this serious health issue by looking at the prevalence of childhood asthma in Detroit by zip code.  The data presented here was provided by the Michigan Department of Community Health. Each map shows a different type of asthma indicator, ranging from the number of emergency room visits to whether or not asthma medications were distributed. Each zip code, except for the ones where data was unavailable, showed evidence of childhood asthma in 2012. Certain zip codes showed more prevalence than others. For example, 48207, the exception of the one showing prevalence of hospital visits. The 48234 area also showed prevalence of childhood asthma indicators, with the exception of the map that shows overuse of short acting beta-agnostics, which provide temporary relief for shortness of breath.

Overall, these data indicate these overall patterns for childhood asthma in Detroit in 2012:

•Approximately 8.1 percent of children which is located along the Detroit River near Belle Isle, was consistently in the top or second grouping in every map, with had standard persistent asthma;
•For these children with persistent asthma, in the majority of the zip codes had over 25.1 percent of children had two or more outpatient visits for persistent asthma;
•In the majority of the zip codes between 40.1 and 56.2 percent of children with persistent asthma visit the emergency room at least once for this condition;
•In 2012 most children visited the emergency only once;
•Children are more likely in most zip codes to use long-term medications for asthma than short-term medications.
•Most zip codes experienced an increase in persistent asthma.
•The chief policy concern these data raise is the question of why asthma is rising among Detroit’s children.  We will pursue this question in a subsequent post.

Note: Some zip codes do not have data reported. This can be either because there were no cases or that there were so few cases that reporting was suppressed.

The map above shows the percent of children in 2012 who met the Healthcare Effectiveness Data and Information Set (HEDIS) standards for persistent asthma. According to the NCQA, which creates the HEDIS standards, is defined as at least one emergency department visit or one inpatient claim or four outpatient visits  with two asthma medication dispensing events or at least four asthma medication dispensing events where asthma is the principal diagnosis. While zip codes 48207 and 48201 had the highest percent of children with persistent asthma (between 8.1 and 9.3 percent), it was codes 48203, 48221, 48202, 48208 and 48201 that experienced the highest percent point change from 2005 to 2012.

The map above, shows the percent of children with asthma who had two or more outpatient visits for persistent asthma. The table shows the percentage point changes from 2005 to 2012 were much higher for this indicator than the first one discussed. Many of the higher percentage point changes occurred in the zip codes where between 30.1 and 42 percent of children had two or more outpatient visits for persistent asthma.

This map shows that majority of the zip codes that make up Detroit had between 40.1 and 56.2 percent of children with persistent asthma visit the emergency room at least once for this condition. The only zip code in Detroit where below 30.1 percent of children with persistent asthma visited the ER for this condition was 48212. This area also experienced a 15.8 percentage point decrease in the percent of such visits from 2005 to 2012. Zip code area 48211 experienced the highest percentage point decrease from 2005 to 2012 at 25.7 percent; this area was in the 30.1 to 40 percent category in 2012. Northwest Detroit’s 48219 zip code, had the highest percentage increase at 10.3; it also was in the highest grouping in 2012 for percent of children who visited the emergency room with persistent asthma.

The percentage of children with persistent asthma who had two or more emergency room visits was much lower than the percentage who went to the ER at least once. In 2012 there were only four zip codes where between 15.1 and 23.5 percent of the children with persistent asthma visited the ER more than once because of the asthma. The zip code 48201, which was one of the areas where between 15.1 and 23.5 percent of the children with persistent asthma visited the ER more than once, also had the highest percentage point increase from 2005 to 2012 at 8 percent.

As with the decreased number of ER visits related to persistent asthma in Detroit children, the percentage of children with persistent asthma who had asthma-related hospitalizations decreased from 2005-2012. All of the zip codes in Detroit experienced a decrease, the highest being a 13.9 percentage point decrease in zip code 48223.

Throughout most of Detroit in 2012 between 10.1 and 20 percent of children with persistent asthma were suspected of overusing short acting beta-agnostics. These are medications used for short-term relief of asthma symptoms. The zip code area 48219 had the highest percentage point increase for this asthma burden indicator. The percentage point increase was 6.2.

The two maps above show the percent of children with persistent asthma who used a given type of asthma relief medication in 2012.  The first map shows the percent of children with persistent asthma who used corticosteroids, a type of steroid used to provide asthma relief. The second map shows the percent of children with persistent asthma who used longer-term medications.  In both cases the use of these drugs increased in most zip codes.


Long-term unemployment becoming a long-term problem

In an article recently published by Brookings, it describes the struggles the long-term unemployed often deal with. According to the information, the percent of Americans unemployed on a long-term basis is higher than the previous peak in 1981-1982 while the short-term unemployment rates appears to be average. This article also shows that majority of the long-term unemployed previously had jobs in retail/sales or blue collar type jobs. To read more click here.

Wayne Disposal releases highest amount of mercury in the region

According to the Agency of Toxic Substances and Disease Registry, exposure to mercury, a naturally occurring element, can cause gastrointestinal, developmental, neurological, ocular, and renal damage. While the most common way humans are exposed to mercury is through consumption of fish and shellfish, we are also exposed to it when coal is burned. According to the Environmental Protection Agency, the largest human cause of mercury emissions comes from burning coal. With this in mind, the EPA issued a mandate for mercury emissions from coal-fired power plants to be limited by 2015. By 2016 the mandate is to be fully implemented and mercury emissions are to be reduced by 90 percent, according to the EPA.

As presented by EnvironmentMichigan.org, above the top 10 mercury emitters by state (this includes coal-fired power plants and other emitters) are shown from 2010. Michigan came in at number 10, with facilities emitting 2,253 pounds of mercury into the atmosphere. Ohio, Indiana, and Pennsylvania were the three Great Lakes States that came in above Michigan. Texas was the state with the overall highest mercury emissions at 11,127 pounds.

Unlike the previous chart, this one shows the 2010 emissions for coal-fired power plants. In parallel with the first chart, Ohio, Indiana and Pennsylvania’s coal-fired power plant emissions were higher than Michigan’s.
In 2010, according to the Natural Resources Defense Council, Michigan based coal-fired power plants emitted 1,924 pounds of mercury into the air. In comparison, the following Great Lakes states produced these emissions from coal-fired power plants: Ohio power plants emitted 2,865 pounds, Pennsylvania emitted 2,720 pounds, Indiana emitted 2,174 pounds, Illinois emitted 1,484 pounds, Wisconsin emitted 1,269 pounds, Minnesota emitted 873 pounds and New York emitted 239 pounds.

The map above displays 2012 mercury releases for the 15 facilities in southeast Michigan that are permitted to release mercury. According the EPA, a chemical release means the material is emitted into the air or water or placed in a type of landfill for disposal.
DTE, released a total of 2,127.8 pounds of mercury from its five power plants in the region. The largest contributor to mercury releases from power plants was the DTE Monroe Power Plant at 985.7 pounds. The St. Clair DTE Power Plant released 426.26 pounds of mercury and the Belle River DTE Power Plant, just a few miles south of the St. Clair location, released 364.7 pounds of mercury in 2012. The Trenton Channel DTE Power Plant released 232.91 pounds and the River Rouge location released. 138.25 pounds.
The largest mercury releaser in 2012 was not a coal-fired power plant,
but a hazardous waste landfill:  Wayne Disposal had the highest mercury releases on a single permit, 2,192.48 pounds. The second largest mercury release site in the region, The Monroe power plant released 965.7 pounds of mercury in 2012, which is higher than what the Natural Resources Defense Council reported was emitted in 2010. Although information from 2010 was presented above, this map offers information from 2012 to show the most recent emissions. This same data was not readily available for 2010 and 2011.