February Economic Indicators: Unemployment Rates, Housing Costs Fairly Stable


  • The unemployment rate increased at the state and local levels(monthly);
  • Regionally, Washtenaw County’s unemployment rate was the lowest;
  • The number of demolitions in Detroit outweighed the number of building starts;
  • Housing prices remained flat.

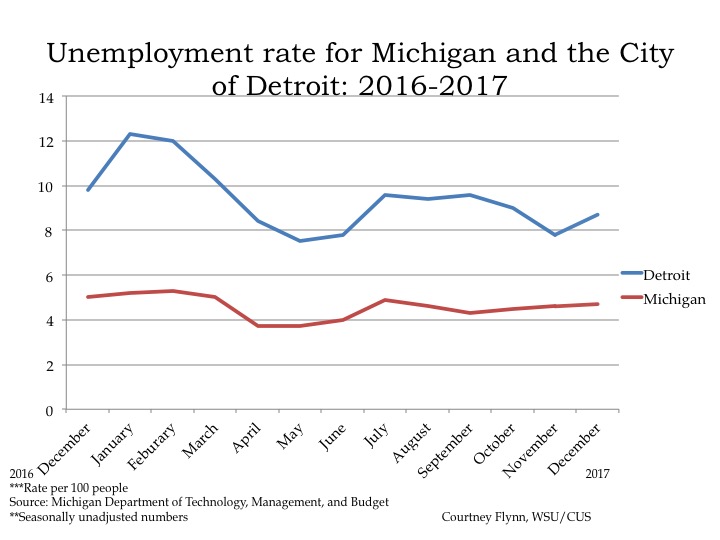
In December of 2017 the unemployment rate for the State of Michigan was 4.7, a slight increase from the November unemployment rate of 4.6, according to the most recent data provided by the Michigan Department of Technology, Management and Budget. The State unemployment rate for December was 0.3 points below what it was in December of 2016.

The Detroit rate was lower over the last year, but up for the most recently reported month. The City of Detroit unemployment rate was reported to be 1.1 points lower in December of 2017 than what it was reported at in December of 2016. For December 2017 the unemployment rate was reported at 8.7; in 2016 it was reported to be 9.8. Between November and December of 2017 though the unemployment rate for Detroit increased by 0.9 points.

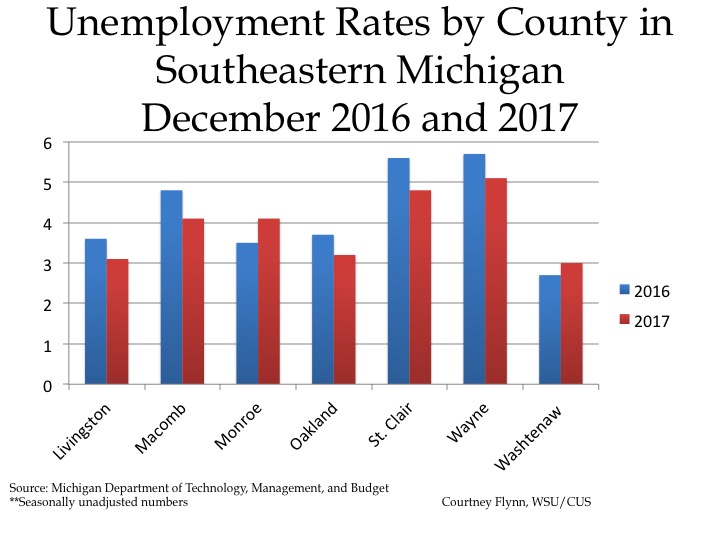
The chart above displays the unemployment rates for each of the seven counties in Southeastern Michigan for December of 2016 and 2017. Wayne County had the highest unemployment rates for both 2016 and 2017 (5.7 and 5.1 percent, respectively). Washtenaw County had the lowest unemployment rates in 2017 and 2016 during the month of December. In December 2017 the Washtenaw County employment rate was 3 and in 2016 it was 2.7. Additionally, in December of 2017, Washtenaw and Monroe counties were the only two in the region that had unemployment rates higher than in December of 2016.

Wayne and St. Clair counties were the only two in the region with unemployment rates above 4.5 percent in 2017.

St. Clair County had the largest unemployment rate decrease between December 2016 and 2017 at 0.8. In December of 2017 St. Clair County had a unemployment rate of 4.8, and in 2016 that rate was 5.6.

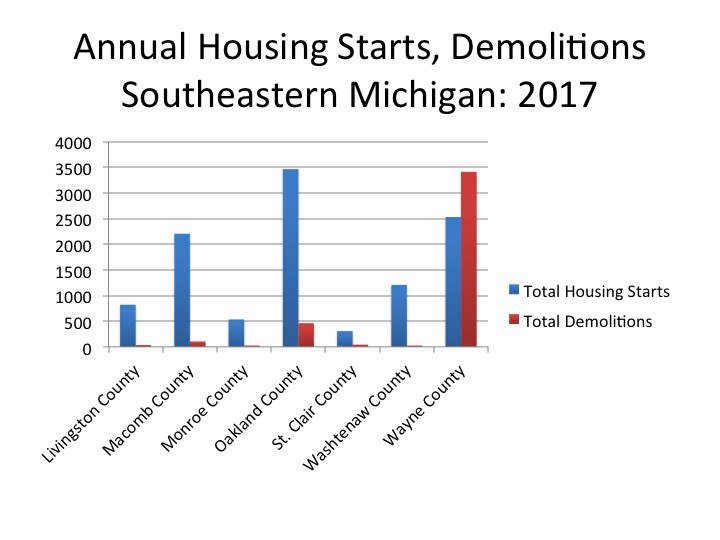
Oakland County had the highest number of housing starts in 2017, according to the Southeastern Michigan Council of Governments, at 3,467. St. Clair County had the lowest number of housing starts in the region at 307, more than 3,000 less than Oakland County.

Macomb, Oakland and Wayne counties had the highest number of housing starts in 2017; these counties also have the highest population numbers in the region. Additionally, all three counties have experienced growth in the number of housing permits being pulled since 2010. Macomb and Oakland counties did experience a dip of about 400 each in 2014, but numbers continued to grow after this.

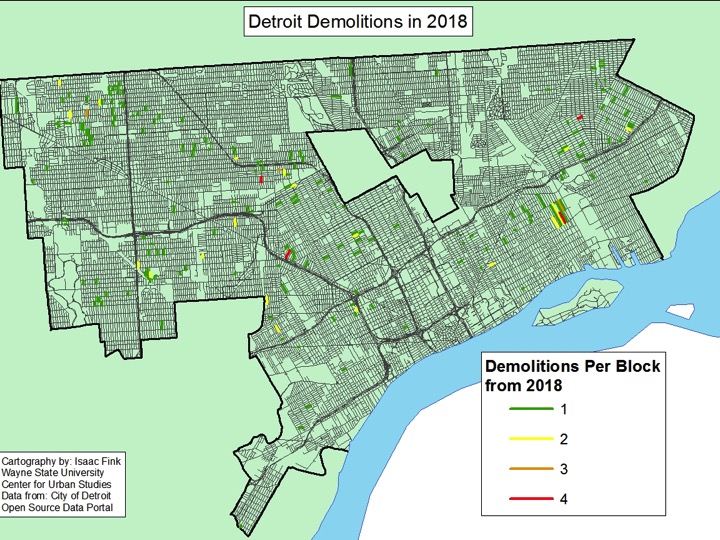
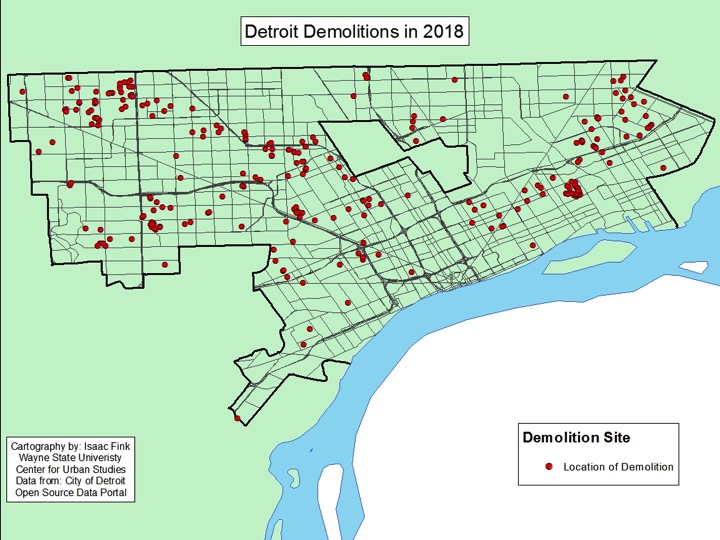
Wayne County was the only one in the region that had a higher number of demolitions than housing starts. All but 206 of 3,415 demolitions occurred in the City of Detroit, according to SEMCOG. In total, there were 3,209 demolitions in Detroit in 2017 and 1,084 housing starts in the same year.

Below is a map of all the demolitions in Detroit between Jan. 1 and Feb. 22, 2018. So far this year there has been 176 demolitions in Detroit, according to the City’s open data portal. The map shows that the demolitions are now occurring outside of the downtown/Midtown areas and instead farther out into the City. Some of the heaviest concentrations of demolitions are occurring in the West Village area of the City and in the far northwest area.

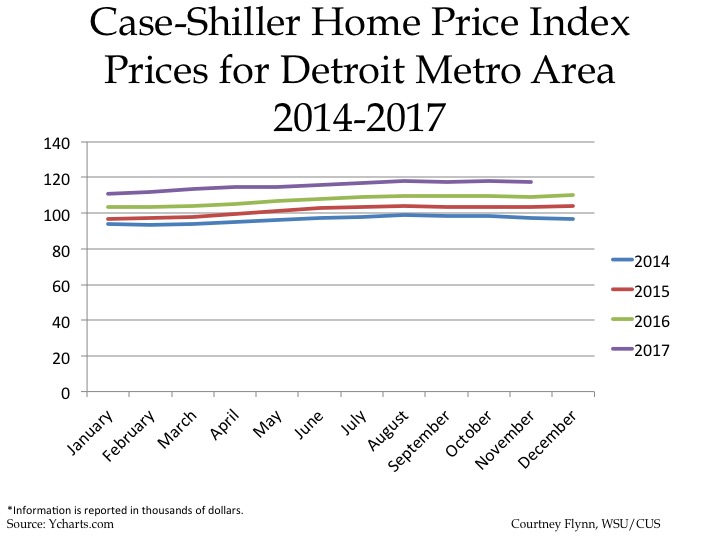
The above chart shows the Standard and Poor’s Case-Shiller Home Price Index for the Detroit Metropolitan Statistical Area. The index includes the price for homes that have sold but does not include the price of new home construction, condos, or homes that have been remodeled.

According to the index, the average price of single-family dwellings sold in Metro Detroit was $117,550 in November 2017; this was $300 lower than the average family dwelling price in October. The November 2017 price was an increase of $8,230 from November of 2016 and an increase of $14,140 from November of 2015 and an increase of $20,260 from November of 2014.

Commute Times in Southeastern Michigan Slightly Increase


In all Southeastern Michigan communities more than 70 percent of residents with a job commuted to work by some mode of transportation, whether it be by vehicle or a mode of public transportation in 2016, according to U.S. Census data. In our sprawling region, where cars are king, suburban life has long dominated and road infrastructure is failing, it is no surprise that the average commute time for the region is 30 minutes. However, in 61 of the region’s communities more than 50 percent of commuters experienced a commute time above 30 minutes in 2016.

At the level of counties, Livingston County had the longest average commute time in 2016 at 32 minutes, followed by St. Clair County at 29 minutes. When considering individual communities, there were only three communities where the average commute time was above 40 minutes; these communities were: Berlin Township (40 minutes), Riley Township (41 minutes) and Emmett Township (41 minutes). All three of these communities are located in the more rural areas of the region.

As noted, the data for 2016 shows that 61 communities in Southeastern Michigan have more than 50 percent of commuters experiencing a commute above 30 minutes. Unadilla Township had the highest percent of residents experiencing more than a 30 minute commute at 75; the average commute time for residents in that township was 39 minutes. No city had an average commute time below 20 minutes, and the communities with the lowest commute times either had large employment hubs or were located very close to them. For example, in 2016 commuters in Ann Arbor had the lowest commute time at 20 minutes. Both the University of Michigan and University of Michigan Health Care System are located in Ann Arbor, a relatively compact city.

Between 2010 and 2016 the average percent of residents who commuted to work increased only slightly, by 0.3 percent. While this shows that the number of commuters on the road remained relatively the same between 2010 and 2016, other data shows that, arguably, congestion on the roads have increased. According to the data, the average commute time for residents in Southeastern Michigan increased by about two minutes.

There were 30 communities in the region though where the commute time increased by more than 10 minutes. Overall, there were 127 communities that experienced a percent change increase in average commute times between 2010 and 2016. The communities with the largest percent increase in average commute times between 2010 and 2016 were spread across the region, which could very well mean road congestion was increasing due to the region’s road system. For example, the City of Northville had the largest percent change increase in commute time between 2010 and 2016 at 31 percent. Northville is located near to I-275, I-696 and I-96 in the areas where these highways are often under construction and experience regular traffic backups due to congestion.

River Rouge had the second largest increase at 26 percent. Jefferson Avenue runs through River Rouge, but was not easily accessible in the city between 2013 and 2016 due to the Jefferson Bridge being closed. This traffic shift would have caused commuters in River Rouge, and other downriver communities, to have to utilize Fort Street and/or I-75 to commute, meaning there were additional vehicles on these alternate routes.

On the opposite side of the spectrum, there were 78 communities in the region where average commute times decreased between 2010 and 2016. Of those communities, 14 had a decrease in the average commute time by more than 10 minutes.

While construction and constricted road systems attribute to traffic congestion, so does the number of vehicles on the road. In Southeastern Michigan we know that there is no comprehensive regional transit system, and instead majority of commuters rely on driving themselves to and from work. A way to decrease traffic congestion is to create a reliable, connected regional transit system that residents would be able to utilize to get to and from work. Increased use in public transportation would decrease congestion, particularly at peak hours, and put less stress on our existing road infrastructure.

Crimes Rate for Detroit Among Highest in the Region

The Federal Bureau of Investigation recently released data on known criminal offenses for the year 2016. For this post, these criminal offenses have been turned into rates per 100,000 residents to accurately show how reported crimes differ between the some of the most well known cities in each county in Southeastern Michigan.

The cities featured in this post are

  • Ann Arbor: Washtenaw County
  • Detroit: Wayne County
  • Howell: Livingston County
  • Pontiac: Oakland County
  • Port Huron: St. Clair County
  • Warren: Macomb County

*Note: Information on cities in Monroe County were not part of the report.

Of the nine crimes featured, Detroit had the highest rate of the eight featured crimes for all but one. Conversely, of the nine featured crimes, Howell had the lowest rates for six of them.

Overall, property crimes had the overall highest rates of the crimes discussed in this post while murder and non-negligent manslaughter had the lowest. Property crime rates also had the largest difference between the city with the highest rate (Detroit) and the city with the lowest rate (Howell).

According to the FBI, Detroit had the highest murder and non-negligent manslaughter rates in 2016 of the six cities examined in this post. This rate was calculated to be 44 per 100,000 residents; this was equivalent to 303 murders for a population of about 680,000. Between 2015 and 2016 the murder rate remained the same because the population numbers and the number of reported murders and non-negligent manslaughter crimes (295 reported in 2015) didn’t vary much from year-to-year.

Howell was the only one of the six cities with zero reported murders in 2016, and therefore had a murder rate of zero.

According to the FBI forcible rape is defined as “the carnal knowledge of a female forcibly and against her will.  Attempts or assaults to commit rape by force or threat of force are also included; however, statutory rape (without force) and other sex offenses are excluded.”

In 2016, of the cities highlighted in this post, Port Huron had the highest reported rape rate per 100,000 residents at 163; this was equivalent 48 reported rapes reported to law enforcement for a population of about 60,000. In 2015, the reported rape rate in Port Huron was 104.

Ann Arbor had the lowest rate at 37, which was equivalent to 44 total rapes known to law enforcement. Detroit’s forcible rape rate per 100,000 residents was 85 in 2016, or 579 total rapes known to law enforcement.


According to the FBI robbery is defined as “the taking or attempting to take anything of value from the care, custody, or control of a person or persons by force or threat of force or violence and/or by putting the victim in fear.”

Of the featured cities, Detroit had the highest robbery rate per 100,000 at 430, a decrease from the 2015 rate of 510. According to the data, the number of reported robberies in 2016 were 2,941 in Detroit.

Pontiac had the second highest robbery rate in 2016 at 202 and Howell had the lowest rate at 0.

According to the FBI, aggravated assault is defined as “an unlawful attack by one person upon another for the purpose of inflicting severe or aggravated bodily injury.”

In 2016 Detroit had the highest aggravated assault rate of the cities featured in this post. Detroit’s 2016 rate was about 1,446 per 100,000 residents, a rate that was about 320 points higher than the 2015 rate. In 2016, Pontiac had the second highest rate at 913, which was about the same rate for the city in 2015. Ann Arbor had the lowest aggravated assault rate of the six cities featured at 106.

According to the FBI, property crime “includes the offenses of burglary, larceny-theft, motor vehicle theft, and arson.  The object of the theft-type offenses is the taking of money or property, but there is no force or threat of force against the victims.”

Detroit had the highest property crime rate of the six cities featured at 4,628 per 100,000 residents in 2016; this was an increase from the 4,092 rate Detroit had in 2015. The city with the second highest property crime rate was Warren at 2,607 per 100,000. Howell had the lowest rate of the featured cities at 1,304; this rate decreased by about 200 from the year before. There was a 3,324 point difference between Howell and Detroit, making this the largest rate difference of the featured cities.

According to the FBI burglary is defined as, “the unlawful entry of a structure to commit a felony or theft.  To classify an offense as a burglary, the use of force to gain entry need not have occurred.”

Detroit’s burglary rate per 100,000 residents in 2016 was 1,286, making it the highest of the featured cities. Additionally, similar to what the data was shown for the other categories in this post, Detroit experienced rate increase for burglary from 2015 to 2016. In 2015 the burglary rate for Detroit was 1,164 and in 2016 it increased to 1,286.

Howell again had the lowest rate of the cities at 189. Although Howell’s rate was significantly lower than the City of Detroit’s, Howell also experienced a burglary rate increase between 2015 and 2016.

According to the FBI, larceny theft is defined as “the unlawful taking, carrying, leading, or riding away of property from the possession or constructive possession of another.”

Detroit had the highest larceny-theft rates of the featured cities in 2016 at 2,039 and Port Huron came in second at 1,735.

Detroit’s rate was equivalent to 13,938 reported crimes for a population of about 680,000 while Port Huron’s rate was equivalent to 510 reported crimes for a population of about 29,000. Howell again had the lowest rate at 1,104; this was equivalent to 105 reported crimes for a population about about 9,600.

According to the FBI, motor vehicle theft is defined as “the theft or attempted theft of a motor vehicle.”

The highest motor vehicle theft rate of the featured cities was 1,303 per 100,000 residents for the City of Detroit, nearly a 530 point rate increase from 2015. This rate was equivalent to 8,905 motor vehicle thefts for a population about 680,000. The city with the second highest motor vehicle theft rate was Warren with a rate of 379. In 2016 Warren had 512 reported motor vehicle thefts for a population of about 135,000. Ann Arbor had the lowest motor vehicle theft rate of 95 per 100,000 residents in 2016 of the featured cities.

According to the FBI, arson is “any willful or malicious burning or attempting to burn, with or without intent to defraud, a dwelling house, public building, motor vehicle or aircraft, personal property of another, etc.”

Detroit had 554 reported arsons in 2016, giving it the highest rate at 81, while Ann Arbor had 10 reported arsons for a rate of 8.


Healthcare, Technology, Business Expected to Add Most Jobs in Detroit

News recently broke that the City of Detroit did not make the short list as a possible location for the second Amazon Headquarters. The reason why? Some said it was concern over the region’s ability to attract talent in a sustainable and long-term way and lack of a robust transit system. While Amazon may not be moving to Detroit, this post highlights what talent the Metro-Detroit Region is expected to foster through 2024.

The data in this post is from the Michigan Department of Technology, Management and Budget and highlights what industries and occupations that Department predicts will grow and lose positions between 2014 and 2024 in the Detroit Metro area.

The data below shows expected growth rates, by percentage and numbers, for all the major industries. According to the data, the construction industry is expected to the experience the overall largest growth rate in the Metro-Detroit region at 14 percent. When digging deeper into the data we see that the sub-industries of heavy civil engineering construction and specialty trade contractors had among the highest projected growth rates at 23.1 percent and 12.5 percent, respectively (see Chart 2).   The professional and business services industry is projected to have the second highest growth rate at 13 percent. This growth is largely supported by the 17.2 percent growth rate projected for the professional, technical and scientific sub-industry, which is categorized under professional business services. Just as heavy civil engineering construction ranked atop the projected growth list for the sub-industries, the professional, technical and scientific sub-industry ranked second (see Chart 2).

When examining the raw numbers, professional and business services is expected to add the largest number of industry jobs at about 48,000. The professional, technical and scientific sub-industry makes up about 32,000 of these positions. As shown in Chart 3 though, professional, technical and scientific sub-industry ranks second when examining the numbers, the health care and social assistance industry ranks at the top with an anticipated number of about 33,000 positions to be added.

The only major industry in the region that is expected to experience a loss is government. The data projects a 3 percent loss of positions between 2014 and 2024. When looking at the sub-industry data we see that that loss is anticipated to come from the federal government side, as highlighted in the Chart 3. The Postal Service is expected to experience a 21.1 percent loss, or about 2,000 jobs, and the federal government is expected experience a 3.5 percent loss, or about 2,600 jobs (see Chart 5). The only government sub-industry that is projected to experience growth between 2014 and 2024 is local government; this sub-industry is expected to have a 2.2 percent growth rate.

In addition to examining industry growth in Metro-Detroit we are also looking into occupational growth. The first chart below, Chart 4, shows the projected percentage growth, or decline, of each major industry as defined by the the Michigan Department of Technology, Management and Budget. The Computer and Mathematical Occupations has the highest projected rate of growth at about 18 percent and among the highest number of anticipated jobs to be added at about 11,600 (Chart 6).

The Healthcare Support Occupations has the second highest anticipated growth rate at 16 percent, but it is the Healthcare Practitioners Occupation that is expected to add the most number of positions, as shown in Chart 7, at 12,785. For the Computer and Mathematical Occupations category, the sub-occupations of Statistician and Operations Research Analyst ranked among the highest for project growth at 41 and 37 percent, respectively, but combined these two occupations are expected to add a total of 470 jobs. As shown in Chart 9, Mechanical Engineers (5,280), Home Health Aides (4,815) and Customer Service Representatives (4,735) are the top three sub-occupations expected to add the highest number of positions between 2014 and 2024 (the number of positions expected to be added through sub-occupations combined are the total number of positions expected to be added to the occupation categories).

The sub-occupation that ranked highest for expected rate of growth was credit councilor, which has a projected growth rate of 41.7 percent, as shown in Chart 8. Credit Councilors fall under the Business and Financial Operations Occupation and are expected to add 340 jobs.

The final two charts in this post show that the occupations with the largest anticipated rate of decline are those that are becoming obsolete, largely due to technology. For example, in Chart 9, the percentage of telephone operators needed between 2014 and 2024 is expected to decline by 48 percent and the percentage of photographic processors is expected to decline by 38 percent. When examining just the numbers, as shown in Chart 10, bookkeeping, accounting and auditing clerks are expected to lose the largest total number of positions at 1,245, followed by postal service mail carrier (900) and press machine setters and operators (840).

Overall, this data set shows that healthcare and business, including computer technologies, and construction are the industries expected to support predicted job growth in Metro-Detroit through 2024, with the occupations that support these industries expected to follow similar growth.

It is important that numbers versus percentages be paid attention to when understanding the economic future of Detroit, because, as our post shows, percentage of growth for certain occupations may be high but a further look at the numbers shows that the total number of positions currently available and expected to be offered in the future remain small in some of these categories with high percentage increases.

But, both the raw numbers and percentages for healthcare, business and computer and construction industries and occupations give some idea of the future of jobs in the Detroit area over the next six years.