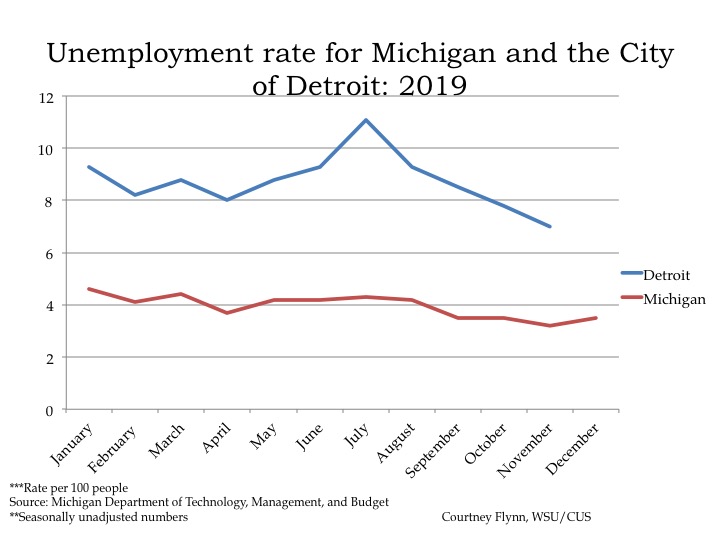
In December of 2019 the unemployment rate for the State of Michigan was 3.5, which is 0.6 percentage points lower than what it was in 2018 (4.1), according to the most recent data provided by the Michigan Department of Technology, Management and Budget. The State unemployment rate of 3.5 in December was the same as it was in September and October of 2019. However, it was 0.3 points higher than it was in the previous month.
December unemployment data at the local level is not yet available from the Michigan Department of Technology, Management and Budget, but the November 2019 unemployment rate for the City of Detroit was 7 percent, which is the lowest it was all year. The November unemployment rate was 0.8 percentage points lower than the October 2019 unemployment rate (7.8 percent) and also 0.8 percentage points lower than the November 2018 Detroit unemployment rate.
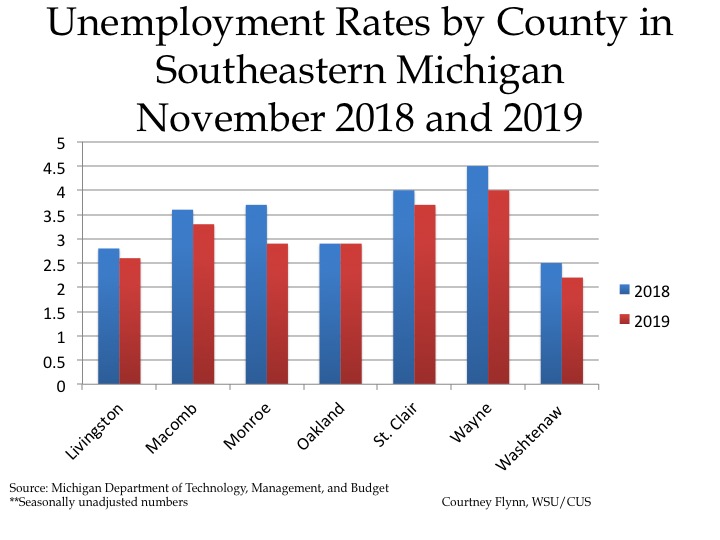
The chart above displays the unemployment
rates for each of the seven counties in Southeastern Michigan for November
of 2018
and 2019. In November
of 2019
Wayne County had the highest unemployment rate at 4. Washtenaw
County had the lowest unemployment rate at 2.2.
Between November of 2018
and 2019 each county in the region had a lower unemployment rate in 2019 than
the previous year,
with the exception of Oakland County. In both November of 2018 and 2019 Oakland
County had an unemployment rate of 2.9. In that same time span Monroe County
had the largest difference in unemployment rates. In November 2018 the Monroe
County unemployment rate was 3.7 and in November 2019 the unemployment rate was
2.9.
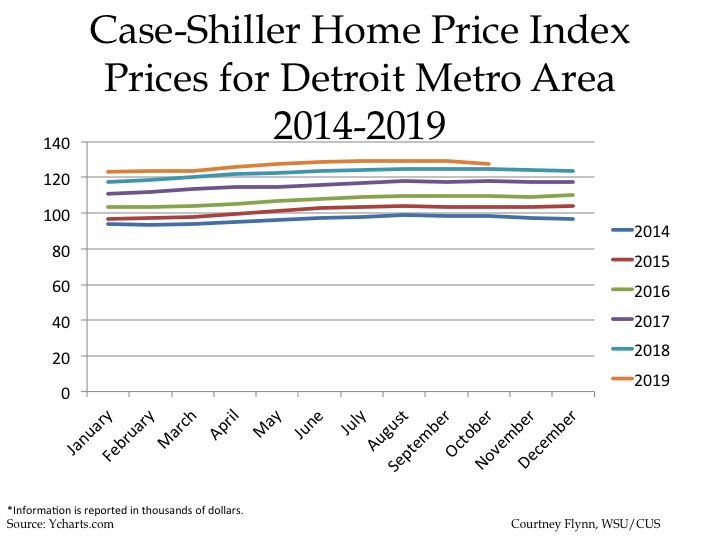
The above chart shows the Standard and
Poor’s Case-Shiller Home Price Index for the Detroit Metropolitan Statistical
Area. The index includes the price for homes that have sold but does not
include the price of new home construction, condos, or homes that have been
remodeled.
According to the index, the average price
of single-family dwellings sold in Metro Detroit was $129,250
in October
2019;
this was $1,540
lower
than the
average family dwelling price in September. The September 2019 price
was an increase of $3,170 from October
of 2018
and an increase of $9,860 from October
of 2017,
an increase of $17,920
from October
of 2016
and increase of $24,440
from October
of 2015
and, finally, an increase of
$29,490 from October
of 2014.
For our cities to function effectively, taxes must be levied
to support services vital to their survival. Here we examine the same
hypothetical Eastpointe property discussed last week to portray what additional
taxes—beyond general school, city and county operating millages—are levied to
provide services to this city’s residents.
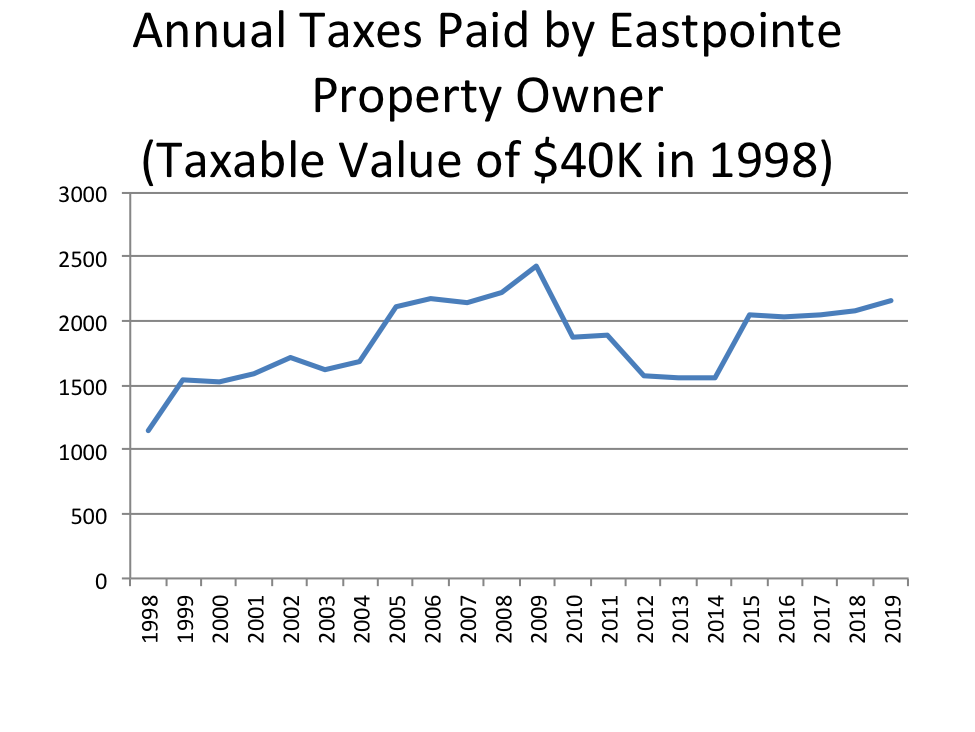
The first chart below shows that from 1998 to 2009, the
total dollar amount this hypothetical property owner was paying in taxes
gradually increased. This can be attributed to two factors. First, both the
assessed and taxable value of the property (shown in Chart 3) gradually
increased during that time, meaning more property tax revenue for local
governments. Second, voters approved at least one new major tax levy during
that time. This major tax was approved in 2005 and allowed the city to collect
a special levy of up to 7 mills for public safety. For this hypothetical
household, that levy equaled $327.94 in 2005. In contrast, a decade later, that
same special levy brought in $219.08. The decline was due to the fact that the
taxable value of the property plummeted, along with the assessed value, in the
wake of the Great Recession.
As shown in Chart 1, the amount of taxes this hypothetical
property owner paid peaked in 2009 ($2,432.30), which corresponded with the peak
taxable value of this home ($53,599). The subsequent decline in tax bills
occurred despite new service assessments approved by Macomb County voters. For
example, it was in December of 2008 when the regional millage for the Detroit
Zoo began to appear on the tax bills for this property, which by then had a
taxable value of $51,340.41, costing the homeowner $5.13. Tax data from the
City of Eastpointe also shows that this new assessment was much lower than
existing county assessments such as the Huron-Clinton Metroparks millage, costing
this hypothetical property owner $11.01 in 2009,and the Suburban Mobility Authority
for Regional Transit (SMART) millage, which cost the homeowner $30.29 that year.
Chart 2 below presents a timeline of the changes in county-wide and city millages
that affected Eastpointe taxpayers.
Chart 1
**(Note-all taxes on the Eastpointe
tax bill are included in the graph above)
Chart 2: Timeline of Eastpointe, Macomb County Millages and Increased
Millage Renewals
1995
Suburban Mobility Area Transit Authority
(SMART): 1 mill (quadrennial countywide renewals approved at varying rates; the
most recent was narrowly approved in 2018)
2005
Eastpointe Public Safety: 7 mills (part of
general city operating millage starting in 2016)
2008
Detroit Zoo: 0.1 mill (2008-present; renewal
approved in 2016)
Macomb County Veteran Millage: 0.4 mills
(2008-present; increase approved in 2016)
2011
Recreation Authority of Roseville and Eastpointe:
1 millage (2011-Present)
2012
Detroit Institute of Arts: 0.2 mills (2012-2022;
renewal question on March 2020 ballot)
2015
South Macomb Oakland Regional Services Authority
(SMORSA): 14 mills (2015-present)
**The Huron Clinton
Metropark Authority millage has been levied since the 1940s***
Chart 3
The trend of decreased property values and the addition of
special assessments to tax bills continued in the wake of the Great Recession. In
2011, residents in Eastpointe and Roseville approved a 1-mill levy to fund the newly
created Recreational Authority of Roseville and Eastpointe (RARE). Later,
voters in Macomb, Oakland and Wayne counties approved a 10-year, 1 mill tax for
the Detroit Institute of Arts (DIA), which appeared on tax bills in December of
2012. The largest increase came in 2015, when Eastpointe and Hazel Park voters
approved the creation of the South Macomb Oakland Regional Services Authority
(SMORSA), to provide a new revenue source for public safety services in both
cities; this regional authority levies 14 mills annually. Macomb County voters
also approved a 0.069 mill veterans millage in 2016, a slight increase from an
earlier 0.04 millage rate. In addition,
residents of Eastpointe have regularly renewed a millage to support their local
library.
Between 1998 and 2019, the timeline for the data in this
post, the amount in taxes paid reached a high in 2009 at $2,432.30 (when the
taxable value of the property was at its highest) and a low in 2014 at
$1,563.50 (when the taxable value was at its lowest). Due to the limitations of
Michigan’s Proposal A, which only allows annual taxable value increases of 5
percent or the rate of inflation (unless the property is sold), the taxable
value of this hypothetical property rose only about 7.4 percent over the next
five years (2015-19). However, due to these new assessments, the hypothetical
property owner paid about 38 percent more in total property tax during that
timeframe—roughly equal to the rate of the home’s assessed value increase.
Eastpointe’s case reveals that local governments have had
some success in combating the fiscal consequences of the decline of general
operating tax revenue with voter-approved special assessments for the
county-level service authorities, and especially with SMORSA. Voter support for
these services has been there in recent years, but it remains to be seen
whether it will persist in the coming years.
This year, property owners across Macomb County may see some
additional changes to their tax bills. In March, the DIA will ask voters to
renew a 10 year, 1 mill tax renewal; if voted down in any particular county, the
DIA assessment in that county will fall off the tax rolls in 2022. Voters will
also be asked to approve a 1.9, 10-year millage on the March ballot to support
classroom operations through the Macomb Intermediate School District (MISD);
this proposed millage is different from the general operating millages currently
levied by the MISD and local school districts.
Later, in August, Macomb County voters will also be asked to approve a
millage for a yet to be determined amount and length to support either building
a new county jail or renovating the current one. The Regional Transit Authority
(RTA) may also be considering a millage proposal in 2020; although at this time
it appears Macomb County voters will not be asked to support the proposal to
support this.
This post is the first of many that will
demonstrate the difference between the taxable and assessed values in
communities throughout Southeastern Michigan and explain the various taxes
levied in these communities and their use. We will highlight at least one
community in each county in the region and this post discusses Eastpointe in
Macomb County. Eastpointe, formerly known as East Detroit, has a population of
about 32,000, a median income of about $46,000 and a median home value of
$64,700, according to the U.S. Census Bureau.
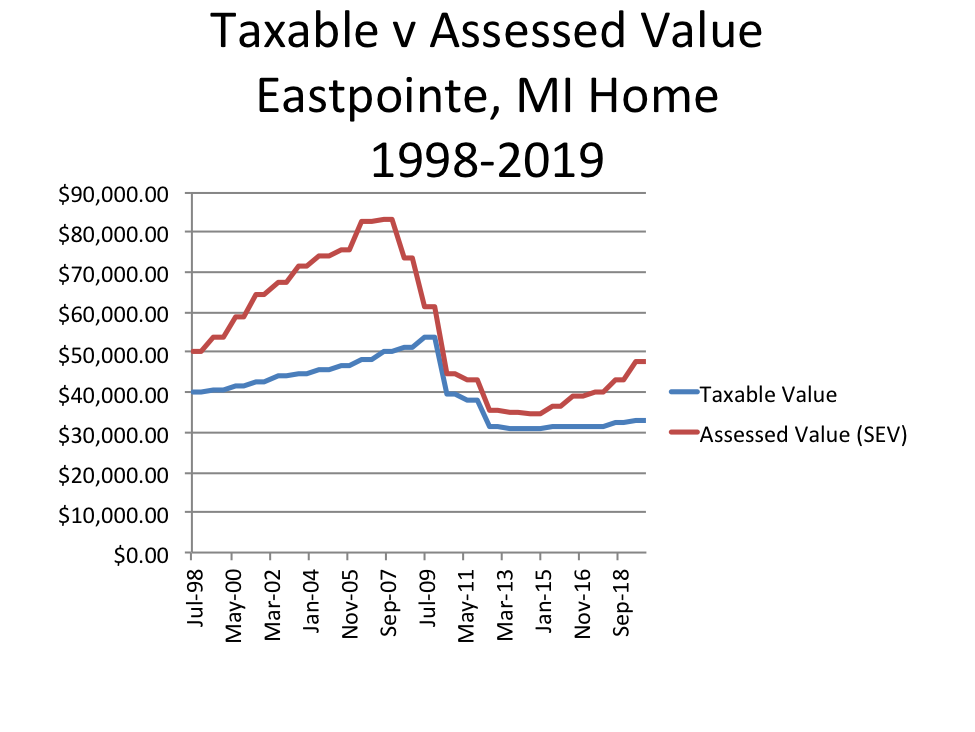
The chart below shows the taxable value
and assessed value of a
hypothetical
Eastpointe home, beginning in July of 1998 through December of 2019. The
taxable value is the value used to calculate a property’s taxes, and each year
it can only increase by 5 percent or the rate of inflation, whichever is less.
This number may be equal to the property’s state equalized, or assessed value,
but not more than those values. Such limits on tax growth, or lack thereof, is
a result of Proposal A, a state constitutional amendment approved by voter referendum in 1994.
The assessed value of a property, or the state equalized valued (SEV), is
usually about half of a property’s true cash value, and the true cash value is
the fair market value of the property.
In 1998 the taxable value of the
Eastpointe property examined was $40,000 and the assessed value was $50,000. In
July of 2007 the assessed value of the property peaked at $83,252 but the
taxable value was only at $50,186. By 2008 the Great Recession hit Southeastern
Michigan and both the assessed values and taxable values of properties began to
decline. Between July of 2007 and July of 2010 the assessed value decreased
from $83,252 to $40,700, or more than 50 percent ($40,000). The
annual declines continued after the recession, and the assessed value of the
property reached its lowest point in July of 2014 at $34,641, a nearly 60%
decline from its peak.
Since
July of 2014 the assessed value of the property has increased to $47,840.
As noted, the taxable value of the
property was $40,000 in July of 1998, but it did not increase nearly as much as
the assessed value did, because it cannot rise more than
the rate of inflation or 5 percent from year-to-year. As a result,
the
taxable value of the property did not peak until July of 2009 ($53,599).
A year later though, in July of 2010, the taxable value plummeted to $39,749. A
property’s taxable value can decrease in such a way if there is a physical loss
to the property and/or if the property is sold in the previous tax year. The
Great Recession began in 2008 and by 2010 the taxable value of properties were
on the decline, ultimately
affecting
governmental budgets, and services.
In
July of 2013 the taxable value of this Eastpointe property reached its low
point at $30,804. Since then the taxable value of the property has only
increased to $33,095.
Due to economic trends and the way taxable values and assessed values are calculated under Proposal A of, the assessed value of a property is nearly always higher than the taxable value. For this specific property, the only time the taxable value and assessed value were nearly the same was in July of 2009, whenthe taxable value was $39,749 and the assessed value was $40,700. In addition, while the gap between the two values has not been nearly as large as it was prior to the recession, since 2016 that gap has been widening.
As noted earlier, our various forms of
government rely on property taxes to function, primarily our local governments
(municipalities and school districts). The chart above shows that just because
the local economy is recovering since the Great Recession, the budgets of local
governments are not necessarily reaping the benefits. According to a recent
report by the Michigan Municipal League, 173 cities in Michigan have
experienced a 2 percent or less revenue growth in the last 15 years and an
additional 52 have experienced a budget growth of 3 percent or more. For
Eastpointe, according to the a recent report released by the Michigan Municipal
League, the total revenue for the city in 2002 was $22.3 million, and in 2017
it was $25.8 million. While the total revenue for Eastpointe has increased by
16 percent the revenue generated by property and income taxes declined by 23
percent. However, while the effects of limited property tax have
negatively
affected municipalities across the state, the slow growth of such taxes has
benefitted for
the property owners. According to a September 2018 Detroit Free Press article
while
income growth in the state has increased since the last recession, household
incomes prior to the recession have not yet been recouped. Since incomes are
also recovering at a slower rate, it can be viewed that the slow growth rate of
property tax revenue is allowing property owners to better stay afloat
economically.
It should be noted though that a, at least in Southeastern Michigan,
local tax bills have become gradually more complicated as voters approve additional
tax
levies, to help make up for the loss in
revenue as a result of the recession, and the loss in revenue due to the
limited growth
of
taxable
values.
Next week we will examine the various taxes levied for this hypothetical
Eastpointe property, including what they are for, what additional ones have
been added over time and how the overall tax amount for the property has either
increased, or decreased, over time.
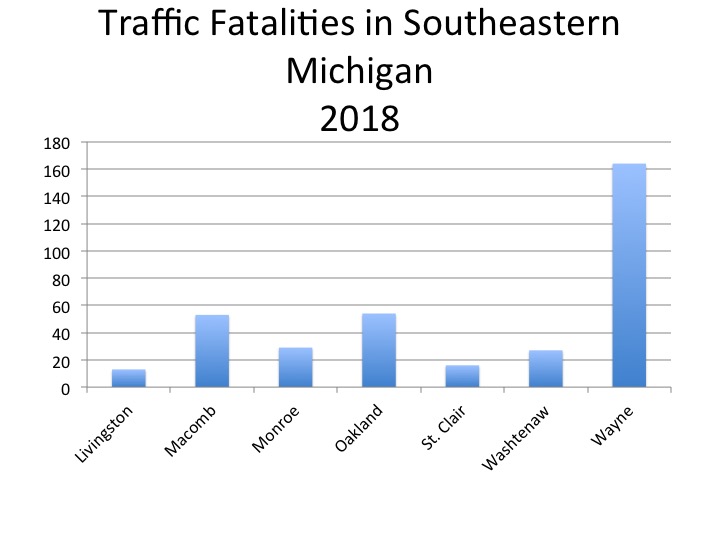
Traffic fatalities in Michigan totaled
just under 1,000 in 2018, a number that officials from the Michigan State
Police said is too high. However, that number was below the 2016 and 2017
traffic fatality numbers which rose above 1,000. Below we examine the number of
traffic fatalities and injuries in Southeastern Michigan, along with the number
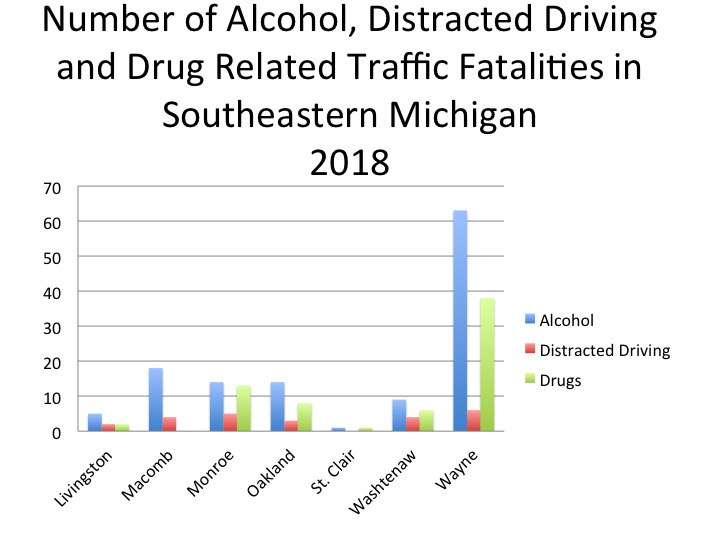
of fatalities and injuries related to alcohol, distracted driving and drugs. As
the charts show, of the factors examined, alcohol is the largest contributor to
traffic fatalities in the region.
Wayne County, which is also the largest
county in the state, had the highest number of traffic fatalities at 164, 63 of
which were alcohol related. Distracted driving contributed to 6 of the164
deaths and drugs contributed to 38. Oakland and Macomb counties had the second
and third highest number of traffic fatalities in the region at 54 and 53. In
Oakland County, of the 54 traffic fatalities, 13 were alcohol related, 3 were
related to distracted driving and 8 were related to drugs. For Macomb County, alcohol
contributed to 18 of the 53 traffic deaths and distracted driving contributed
to 3 of the deaths; there were not any drug related traffic deaths.
When looking at the percentage of alcohol
related traffic deaths compared to the total number of traffic deaths, Monroe
County had the highest rate. Of the 29 traffic deaths in Monroe County in 2018,
48 percent of them (14) were alcohol related. St. Clair County had the lowest
percentage at 6 percent. In 2018 there were 16 traffic deaths in St. Clair
County and 1 was alcohol related. With those two exceptions, the percentage of
alcohol related traffic deaths ranges between 24 and 38 percent.
Of the other two factors, drugs contributed more to traffic fatalities than distracted driving.
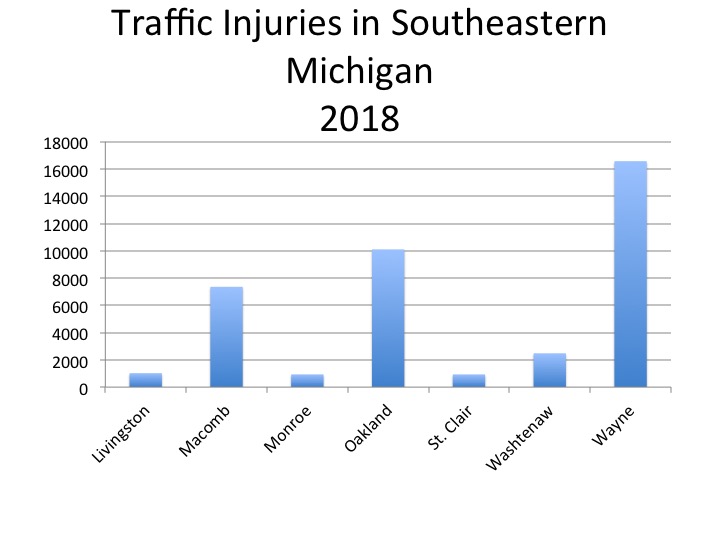
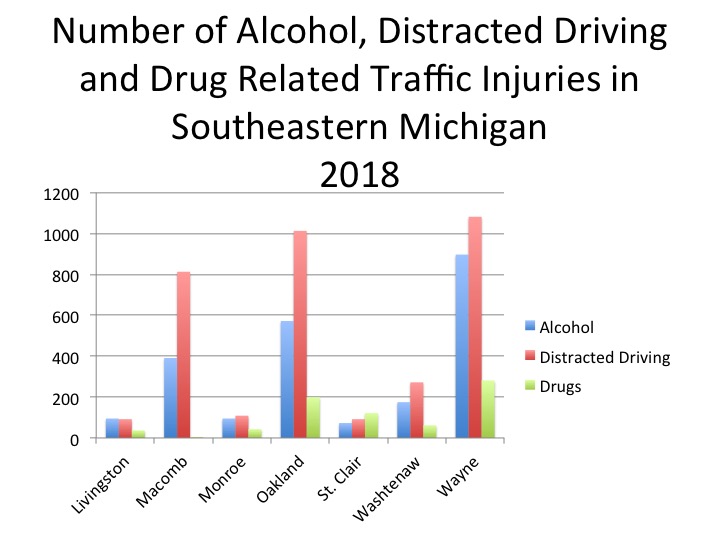
Injuries related to vehicle accidents are
higher than fatalities and while Wayne, Oakland and Macomb still had the
highest numbers in the region, the data shows that distracted driving was
reported to be the largest contributor of the factors examined. Overall, data
indicated that distracted driving contributed to an average of 10 percent of
the traffic related injuries in Southeastern Michigan in 2018. In Macomb C,
Monroe and Washtenaw counties distracted driving contributed to 11 percent of
the traffic related injuries and in Wayne County distracted driving contributed
to 7 percent.
Although Wayne County had the lowest percentage of distracted driving related traffic injuries in the region, it had the highest number at 1,082 (there were 16,578 total injuries). Alcohol was related to 897 traffic injuries in Wayne County and drugs were related to 281 injuries. In Oakland County there were 10,105 total traffic related injuries, 572 of which were alcohol related, 1,013 of which were related to distracted driving and 199 of which were related to drugs. In Macomb County there were 7,360 traffic related injuries, 391 of which were related to alcohol, 813 of which were related to distracted driving, and none of which were related to drugs. And, while Macomb County did not report any drug related traffic injuries in 2018, St. Clair County was the only county in the region where there were more drug related traffic injuries than alcohol or distracted driving injuries. In 2018 there were 931 traffic injuries in St. Clair County, 122 of which were related to drugs.
While the full 2019 Michigan State Police
Report on traffic fatalities and injuries has not been released, officials
maintain that they continue to strive for fewer than 1,000 fatalities each
year. Additionally, officials have said they believe the lower 2018 number is
related to additional efforts made to educate drivers and stricter enforcement.
The 2019 numbers will be released in March, and at that time we will examine
the new data and compare it to historical data.
In Southeastern Michigan there are 14 wastewater treatment
plants that did, and plan to again, participate in a real time water monitoring
system. This real time water monitoring system would span from Port Huron to
Monroe, from where Lake Huron meets the St. Clair River down to Lake Erie. The
purpose of the system is to better ensure the water basin that provides
drinking water to more than 3 million people remains clean, and if there is
contamination, those who run the water plants could shutoff intake to ensure
contaminants do not enter the drinking water.
Current events in Southeastern Michigan, such as the
collapse of a site into the Detroit River that is potentially contaminated with
uranium and the leaking of green hexavalent chromium ooze onto I-696 near stormwater
drains, are a reminder of just how easily our waterways can become contaminated.
While steps certainly need to be taken to avoid contaminants entering our
waterways, a full scale real time water monitoring system is also vital for
public health. However, that has not always been a priority.
The real time water monitoring system was first established
in 2006 with $3.5 million in funding provided by the federal government; local
governments at the county and municipal level also initially chipped in.
However, by 2011 the system was no more as funding dried up. The reasons?
According to a 2016 MLive article, local communities did not have the funds to
allocate toward the operation and maintenance of the system and would not pass
the operational charges along to the ratepayers. Additionally, a 2012 Municipal
and Sewer Magazine article stated that some of the communities along the Huron
to Erie water real time water monitoring system corridor were concerned about
the data the system was producing and wanted to invest money in their own
systems, not a regional one.
Since 2011 the region has been left without a real time
water monitoring system due to lack of and interest in funding. That is until
in 2017 when then Gov. Rick Snyder allocated $375,000 in his budget. The
Southeastern Michigan Council of Governments (SEMCOG) has since been charged
with procuring and installing the water monitoring system. According a SEMCOG
representative, the updated installation of the system is near completion and
they hope to have real time data from it pushed to public in the near future. In
December they gave no indication that any of the stations were running, just
that a stakeholder meeting would be happening in the near future.
While the re-investment in the system gives way to updated
infrastructure needed to protect our waterways and public health, as the story
of the system’s past shows, regional investment and collaboration will be
necessary for its success. As of the
beginning December, no funds beyond the 2017 investment by the state had been
allocated to the system and staff at the Michigan Department of the
Environment, Great Lakes and Energy were unaware of the system and its funding.
Funding options may vary in keeping the system operating-whether it be
surcharges passed on to ratepayers, additional taxes levied or additional funds
found in government budgets. However the funds are found, they need to be
allocated to protect the public health of the region and cleanliness of our
greatest natural asset.
If the communities along the Huron-to-Erie water basin don’t
come together to collaborate at a regional level to keep this system running,
history could repeat itself leaving the region without a system to protect our
health.
The image below was provided by SEMCOG and shows the locations where the real time water monitoring system sites will operate from, which are water treatment plants throughout the region. These sites were also part of the original system that was established in 2006.