Part I: Metro-Detroit’s shift toward regionalism starts with Metroparks, speeds up with economic downturn

Regionalism in Southeastern Michigan began to take shape in the 1930s, but it was not until the financial decline of Detroit and the broader region, that multi-jurisdictional authorities truly began to take over an array of services.
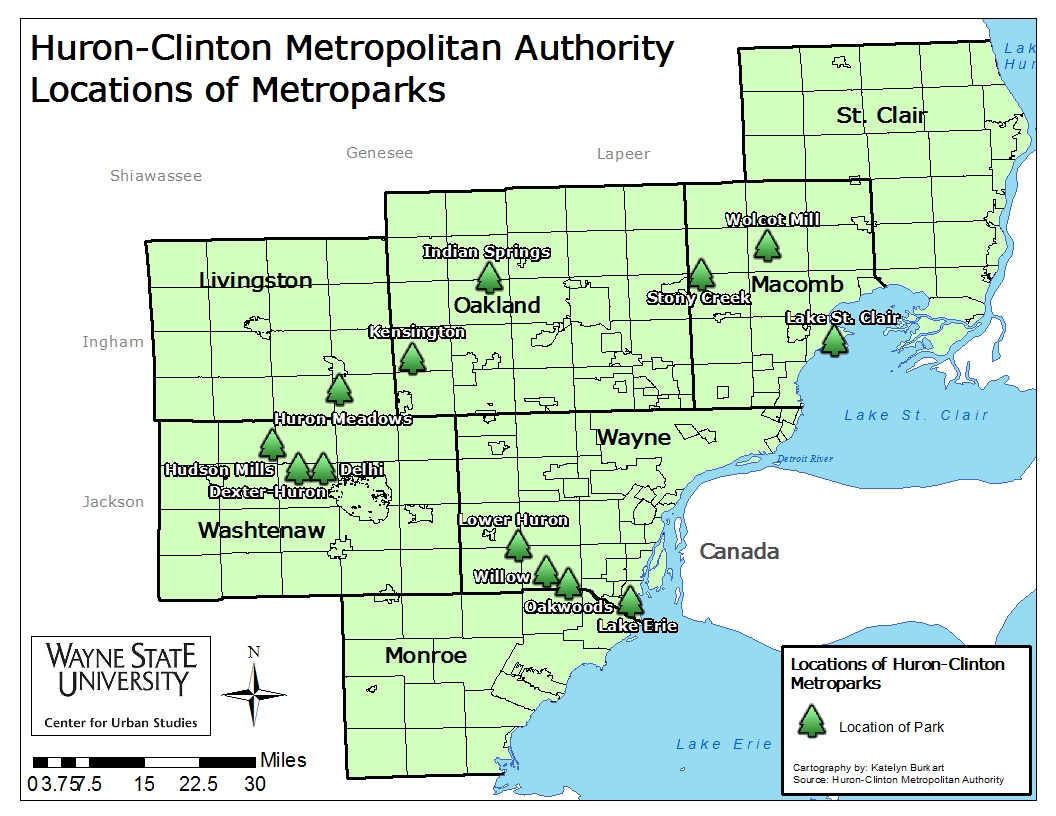
The oldest extant regional entity formed in Southeastern Michigan is the Huron-Clinton Metropolitan Authority. Enabled by the Michigan State Legislature in 1939 by Public Act No. 147, the residents of Livingston, Macomb, Oakland, Wayne and Washtenaw counties approved the authority the following year. In 1942, funding for the parks became available, according to the authority’s history. Since that time the authority has grown to oversee 13 metroparks, which together encompass more than 25,000 acres. The Huron-Clinton Metropolitan Authority is governed by a seven-member board; two members are appointed by the governor and the other five are appointed by the Board of Commissioners of the member counties. Currently, all of the metroparks are supported by a 0.2146 mill levy on the residents of Livingston, Macomb, Oakland, Wayne and Washtenaw counties. This levy is equivalent to $10.73 for a home valued at $100,000 ($50,000 taxable value).

Metroparks

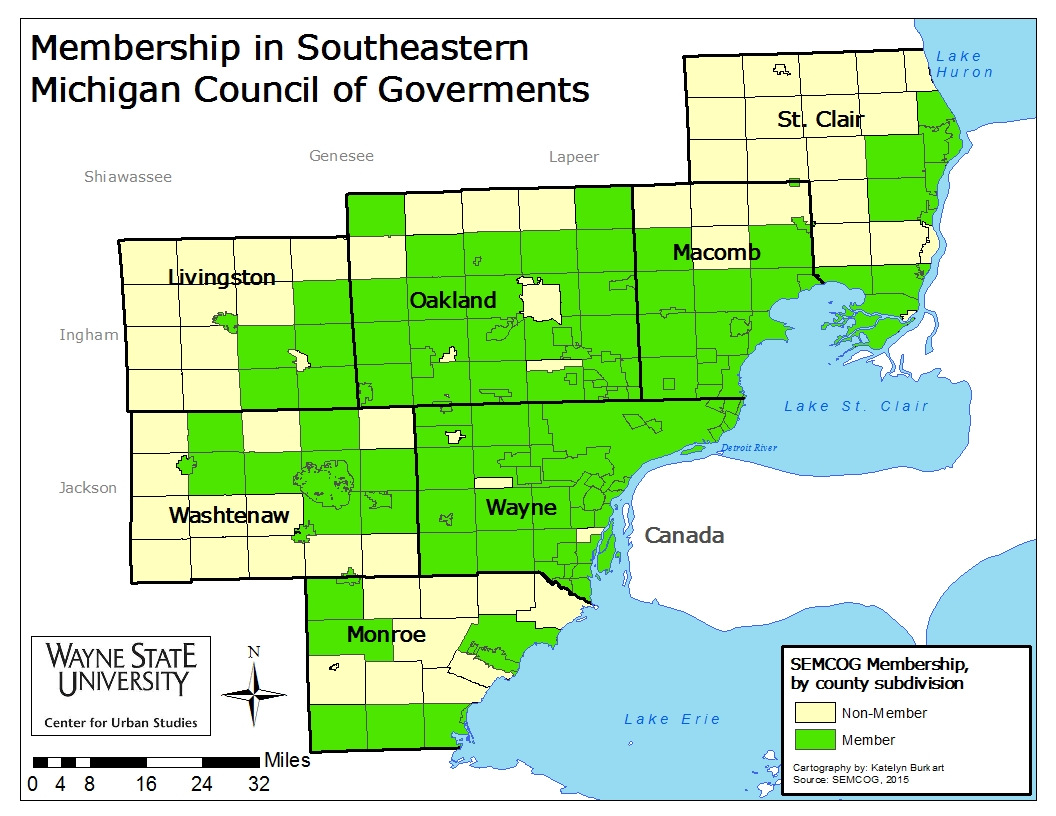
Southeast Michigan took an additional step toward regional cooperation more than 25 years later (1968) by establishing the Southeastern Michigan Council of Governments (SEMCOG). This regional planning entity, along with other regional planning organizations in the state of Michigan, was authorized by Public Act 281 of 1945.

According to its website, SEMCOG partners with local government entities—ranging from villages to cities to counties to community colleges—to better improve the area’s waterways, transportation systems and economic vitality. In addition, according to the Clean Air Act and the Water Pollution Control Act, SEMCOG is the region’s planning agency for water and air quality. SEMCOG has also been responsible for the region’s transportation planning.

For SEMCOG, communities choose whether or not they want to be members of regional planning entity. As of the end of 2015 there were 168 different government entities that were SEMCOG members. In Macomb County, Ray Township, along with the townships of Armada, Bruce and Richmond are not SEMCOG members despite their neighbors like Washington and Macomb townships being members. In Oakland County, Pontiac is not a SEMCOG member despite it being surrounded by members.

SEMCOG_members

Despite the existence of regional entities, cooperation among cities and counties in Southeastern Michigan was very limited during much of the 20th century. But Michigan’s economic downturn in the 2000s weakened some of the region’s strongest institutions as they began to face financial problems. One of the first organizations to seek public support through a regional millage was the Detroit Zoo. Once completely owned and operated by the city of Detroit, zoo operations were transferred to the Detroit Zoological Society in 2006. This decision came after the city voted to close it for financial reasons, and the Michigan Legislature promised to provide $4 million to the society for operational aid, according to a 2005 Crain’s Detroit article. Then in 2008, the Michigan Legislature approved Public Act 49, allowing counties to establish a zoological authority and contract for zoological services. The act also gives the counties the authority to levy up to 0.1 mill, with voter approval, for such services. In the same year Public Act 49 was passed (2008), the voters of Wayne, Oakland and Macomb counties were asked to approve a 10-year 0.1 millage, which equals to $5 a year for a home valued at $100,000 (taxable value of $50,000). All three counties approved the millages:

  • Wayne County: 73.15% yes
  • Oakland County: 74.88% yes
  • Macomb County: 66.5% yes

Each of the three counties has its own zoo authority, whose members are appointed by their county commissions or by the county executive office. In Oakland County, the board of commissioners appoints the members; in Macomb County the County Executive makes the appointment recommendation but the Board of Commissioners must confirm; and in Wayne County the executive makes the appointment. Each authority is charged with administering the funds levied from the millage to the Detroit Zoo.

The successful 2008 request for financial support was not the first time the Detroit Zoo sought public assistance through tax dollars, though. In 2000 and 2002 millages were placed on the ballot; Wayne County supported those requests and Oakland County did not, causing them to fail. Macomb County did not participate.

The 2008 millage, which was passed to support operations at the zoo, contributed to 36 percent of the organization’s operational budget in 2014, according to its 2014 financial report. The breakdown of the percentage of millage funds provided to the zoo from each county in 2014 were as follows:

  • Wayne County: 13%
  • Oakland County: 16%
  • Macomb County: 8%
  • (64% funds earned revenue and through fundraising)

Following the regional support for The Detroit Zoo another regional authority was created—this one intended to support Detroit’s Cobo Hall. In September of 2009 the Detroit Regional Convention Facility Authority was formed through passage of Public Act 554 in 2008, which allowed the creation of regional convention facility authorities. This regional authority was formed at a time when the North American International Auto Show threatened to abandon Cobo Hall and Southeast Michigan due to the facility’s size and aging infrastructure, according to a New York Times article. Detroit could no longer financially maintain the convention center at a level that would allow it to host such an international attraction.


When the Detroit Regional Convention Facility Authority was formed, so was a governing body to oversee the regional authority. The governing body is a five-member board with representatives from the City of Detroit, Wayne, Oakland and Macomb counties and an appointee from the Governor’s Office. This body oversees the 30-year capital lease of Cobo Hall (the facility is leased from Detroit), which includes a $299 million expansion/upgrade project. The Detroit Regional Convention Facility Authority receives funding from revenues at Cobo Center as well as support from the state’s Convention Fund.

The Detroit Institute of Arts (DIA) authorities (one each in Wayne, Oakland and Macomb) were also created during the 2008 economic downturn to help establish a more reliable base for operations funding for the Detroit Institute of Art. Public Act 296 of 2010 gave each of the three counties the ability to levy up to $10 for a home valued at $100,000 (taxable value of $50,000), with the support of voters, to support “an encyclopedic [comprehensive] art museum whose primary art collection and facility. . . are owned by a municipality located in the state.” Similar to the Detroit Zoo authorities, each county board and/or executive appoints members to its respective authority to oversee the funds brought in through the millage.

In November of 2012 majority of Wayne County (67%), Oakland County (64%) and Macomb County (50.5%) approved the 10-year, 0.2 mill proposal that allows free general admission to residents of the tri-county area. Other benefits of the now-established regional authority include free bussing for school field-trips and senior citizen trips, along with the Inside-Out Program, which brings reproduced pieces of art to area communities.

The approval of the millage meant increased funding for the DIA, along with increased attendance. In 2014, according to the DIA’s Community Relations Report, the institute has about 300,000 total visitors from the tri-county area. The breakdown is as follows:

  • Wayne County: 141,659 = 47% of total visitors
  • Oakland County: 106,433 = 36%
  • Macomb County: 51,834 = 17%

While the DIA millage may still seem to receive the most attention, with concerns over raises and transparency, it certainly was not the end of Southeastern Michigan’s increased shift toward regionalism. Over the next two weeks we will also explore the region’s history of fragmented regional transportation and shift from the region’s reliance on Detroit for water and sewer services to a more collaborative approach.

Washtenaw County gains 770 residents while Livingston loses more than 1,000

Last week, we explored migrations in and out of the tri-county region using 2012-13 IRS tax returns. This week, we highlight the remaining four counties in Southeastern Michigan (Livingston, Monroe, St. Clair and Washtenaw) where there was a total net gain of 32 residents. All counties, except Livingston, experienced net gains. Washtenaw County had the highest net gain of residents at 770, while Livingston County had a net loss of 1,085. Even with such gains and losses, the data presented in this post shows that majority of the migration in and out of a these counties occurred within the state’s boundaries.

WashtenawCountInMigration

WashtenawCountyOutMigration

Washtenaw County experienced a net increase of 770 new residents, according to 2012-13 tax returns. The IRS data shows that, there were 9,596 tax returns filed by new Washtenaw County residents and 8,826 filed by former Washtenaw County residents. Former Wayne County residents contributed the most to the population influx with 2,529 of them moving to Washtenaw County. Oakland County contributed the second highest number of new residents at 891, followed by Livingston County at 649. In total, of the 9,596 new residents who moved into Washtenaw County, 5,881 were from other Michigan counties. From outside of Michigan, Cook County, Illinois (where Chicago is located) contributed the highest number of new residents at 344; Los Angeles County in California contributed 130 new residents to Washtenaw County.

When viewing the number of residents who left Washtenaw County for elsewhere, 2,225 residents moved to Wayne County (Washtenaw County had a net gain of 304 residents from Wayne County). Additionally, Washtenaw County lost 915 residents to Oakland County (a net loss of 24), and 536 residents to Livingston County (a net gain of 113). In total, Washtenaw County lost 5,785 residents to other Michigan counties, for a net gain of 96.

From outside of Michigan, Washtenaw County lost 284 residents to Cook County, Illinois (net gain of 58). Washtenaw also lost 142 residents to Los Angeles County, California (a net loss of 12).

LivingstonCountInMigration

LivingOut

Livingston County lost 4,452 residents, according to 2012-13 IRS data, while gaining 3,367, for a net loss of 1,085 residents. Among the new Livingston County residents, 1,027 were from Oakland County, 536 from Washtenaw County, and 469 from Wayne County. In total, 3,285 Michigan residents moved to Livingston County during the 2012-13 time frame. Cook County, Illinois contributed the highest number of new residents to Livingston County, at 44 from an out-of-state county.

While Livingston County gained the largest number of residents from Oakland County, it also lost the most residents to the same county: it lost 1,292 residents, for a net loss of 265 residents to Oakland County. Livingston County lost 903 of its residents to Wayne County (a net loss of 434) and 649 of its residents to Washtenaw County. In total, 4,157 former Livingston County residents moved elsewhere in the state, for an in-state net loss of 872. Outside of Michigan, Cook County, Illinois gained former Livingston County residents at 37, for a net loss of 7.

MonroeCountyInMigration

MonroeOut

Monroe County had a net gain of 143 residents, according to 2012-13 IRS tax returns. This rural county lost 2,350 residents to other counties while gaining 2,493 new residents. Monroe County’s largest population gain came from Wayne County at 852 residents; its second largest gain was from Lucas County, Ohio (Lucas County, which borders Monroe County, is home to Toledo) at 738. Wayne County and Lucas County were also the two counties that gained the most former Monroe County residents. Monroe lost 879 residents to Wayne County (net loss of 27) and 694 residents to Lucas County (a net gain of 141).

In total, Monroe County gained 1,564 residents from other Michigan counties and lost 1,485 residents to other Michigan counties for a net gain of 79 residents.

StClairCountyInMigration

StCOut

St. Clair County lost 2,232 residents and gained 2,192 residents, according to 2012-13 tax returns. The highest population gain for the county came from Macomb County with 1,001 residents, followed by Oakland County at 249. There were 141 former Wayne County residents who moved to St. Clair County. Pasco County, Florida (Tampa Bay area) contributed the largest number of new out-of-state residents to St. Clair County (28).


More former St. Clair County residents moved to Macomb County than anywhere else (1,194), resulting in a net loss of 193 residents to Macomb County. Oakland County gained the second highest number of St. Clair County residents at 210 (net gain) of 39. In total, 2,034 residents moved to St. Clair County from other Michigan counties and while 2,124 moved out, for a net loss of 90 residents. Maricopa County (Phoenix area), Arizona was the out-of-state county that gained the highest number of former St. Clair County residents at 25.

Overall, across Southeastern Michigan, there was a net gain of 5,770 residents. However, majority of the migration in and out of each county in the seven county region occurred between neighboring counties.


IRS Tax returns show Wayne County nets population gain

At first glance of filed 2012-13 IRS tax returns, it appears that, combined, Wayne, Oakland and Macomb counties gained about 5,500 residents. However, a deeper look into this information shows that majority of those leaving one county for another are actually just moving over the county line. Of the three counties, Wayne County was the only one to experience a net gain, while Oakland County was nearly equal in the number of residents leaving and moving in and Macomb County experienced a net loss.

The information provided in this post is from 2012-13 filed IRS tax returns.

Wayne County In Migration

Wayne County Out Migration

According to the 2012-13 tax returns, Wayne County lost 26,264 residents and gained 34,320, for a total net gain of 8,056. Former Oakland County residents were responsible for majority of the gain at 10,402, followed by Macomb County residents at 6,625 and Washtenaw County at 2,225. From out of state, Illinois’ Cook County (where Chicago is located) contributed the most number of new residents to Wayne County at 449.

While Wayne County gained the most number of Oakland County residents, it also lost majority of its residents to Oakland County as well. Wayne County lost 8,074 to Oakland County. Macomb County gained the second largest number of former Wayne County residents at 4,407. Outside of Michigan Cook County, Illinois gained the largest number of Wayne County residents at 355. Other counties across the country that gained more than 100 Wayne County residents were Clark County, Nevada (Las Vegas area, 126 people), Los Angeles County, California (172), San Diego County, California (138), Broward County, Florida (Ft. Lauderdale/Miami metropolitan area, 113) and Maricopa, Arizona (Phoenix area, 211 former Wayne County residents).

Oakland County in migration

Oakland County out migration

Oakland County lost nearly as many residents as it gained in 2012, according to the 2012-13 tax returns. According to the data, there were 29,124 tax returns filed by new Oakland County residents and 30,001 filed by former Oakland County residents. Of those that left, Wayne County received the most at 10,402, followed by Macomb County at 5,499. In terms of out-of-state migration, Cook County again received the highest number of residents at 600. Additionally, Los Angeles County, California (251) and Maricopa County, Arizona (214) also received a high number of residents from Southeastern Michigan. While Oakland and Wayne County residents had similar migration patterns when they left Michigan, we do see that there was a greater presence of Oakland County residents in northern California and Oregon.

Of the 29,124 residents gained in Oakland County, former Wayne County residents contributed to about a third of that number (8,074) and Macomb County residents contributed and additional 5,688 residents. From out of state, there were 592 former Cook County, Illinois residents who moved to Oakland County.

Macomb County in migration

MacOut

According to 2012-13 filed tax returns Macomb County had a net loss of 1,452 residents, with 15,925 new tax returns being filed for the county and 17,377 being filed by former residents. Wayne County received the highest number of former Macomb County residents at 6,625, followed by Oakland County at 5,668. Cook County, Illinois and Maricopa, Arizona were the only two counties outside of Michigan to receive more than 100 former Macomb County residents (140 and 129, respectively).

Macomb County gained more Oakland County residents than Wayne County residents, according to 2012-13 filed tax returns. During this time period 5,499 former Oakland County residents relocated to Macomb County and 4,409 former Wayne County residents relocated there. From outside of Michigan, Maricopa County, Arizona contributed the most number of residents at 160, followed by 145 Cook County, Illinois. Macomb County experienced a net gain of residents from both Maricopa County, Arizona and Cook County, Illinois.

While majority of the migration within the tri-county region took place between neighboring counties, the 2012-13 tax returns do show that Michiganders were leaving the state, particularly to places like Arizona, Florida, California and Illinois. However, the information also shows that there was out-of-state migration in the tri-county region at that time too, and in some cases it meant there was a net gain.

Next week, we will examine migration patterns for the remaining counties that make up Southeastern Michigan.

Southeastern Michigan’s average income above nation’s; Detroit’s income continues to lag

Southeastern Michigan has a median household income of about $57,000, $4,000 above the national average (about $53,000), but there are multiple communities in the region with median household incomes far below the local average. Communities within the region with the lowest median household incomes included Highland Park, Detroit and Hamtramck.

Metro-Detroit median household income

SEMichigan Median Household income 2014

In 2014 Highland Park had the lowest household median income in the region at $19,391; this is a decrease from a median household income of $21,469 in 2009. This neighbor to the City of Detroit also had 49 percent of residents living below the Federal Poverty Level ($23,850 for a family of four) in 2014. Similar to the decreased median household income for Highland Park in recent years, there has been an increase percentage of residents living below the Federal Poverty Level.

In 2014 Hamtramck had roughly the same percentage of residents as Highland Park living below the Federal Poverty Level at 49 percent, this too being an increase from 2009. It also had one of the lowest median household incomes in the region in 2014 at $25,183. The city’s 2014 median household income is about a $5,000 decrease from $30,346 in 2009. Detroit, which will be discussed further later, had a household median income above both of these cities in 2014 at $26,095. However, this median household income is still far below the average for the region, state and nation.

In 2014 the median household income for Lake Angelus was $167,083. Between Highland Park, which had the lowest median household income in the region in 2014, and Lake Angelus, which had the highest median household income, there was more than a $130,000 difference; according to our previous post, in 2009 Lake Angelus’ median household income was about $131,000. Bloomfield Township, also located in Oakland County, was another suburban community that experienced an increase in its median household income between 2009 and 2014. In 2014 Bloomfield Township’s median household income was $108,235, in 2009 it was $104,988. Other communities in the region that had a median household income above $120,000 in 2014 were Novi Township ($125,000), Bloomfield Hills ($163,462) and Orchard Lake Village ($152,625).

Despite such high median household incomes it wasn’t Oakland County with the highest median household income of the seven counties in the region, rather it was Livingston County. In 2014, Livingston County had a median household income of $73,994; Oakland County’s median household income was $66,436. Conversely, Wayne County had the lowest median household income $41,421.

Although Livingston County did not have any communities with a median household income above $120,000, 10 of 18 communities (data was not available for Fenton) had median household incomes above $70,000. Brighton Township had the highest median household income in Livingston County at $94,611 and the Howell had the lowest at $43,482. In Oakland County median household incomes ranged, by community, from $27,632 (Pontiac) to $167,083.

Detroit Median Income

Detroit’s median household income in 2014 was $26,905, a decrease from $33,754 in 2009. With incomes decreasing, the percentage of individuals living below the poverty line increased from 33.2 percent in 2009 to 39.4 percent in 2014 in Detroit.

Despite there being a median income of $26,905 in Detroit there are neighborhoods in the city where the median household income ranges up to about $103,000. The neighborhoods with the highest median household incomes in Detroit are Palmer Park, Rosedale Park and Indian Village. On the opposite end of the spectrum, there are several Census Tracts where the median household income in 2014 ranged between $8,733 and $15,000. The majority of these Census Tracts were located in the eastern part of the city, around lower/middle Woodward and Rosa Parks. There were also a few near Brightmoor and Chandler Park.

Overall, we see that while regionally Southeastern Michigan had a median household income above the state and national average in 2014 there are several impoverished communities in the region where the median income not only continues to decline, but the poverty rate continues to rise. Although there are pockets of wealth and poverty both located within the region, the majority of the region has a median household income between $30,000 and $90,000.