Livingston County has Lowest Unemployment Rate in Southeastern Michigan

  • The unemployment rate decreased at the State and local levels(monthly);
  • Regionally, Livingston County’s unemployment rate remains the lowest;
  • The Standard and Poor’s Case-Shiller Home Price Index for the Detroit Metropolitan Statistical Area shows home prices continue to increase monthly and annually while national mortgage rates are lower than those throughout the State and the City of Detroit.

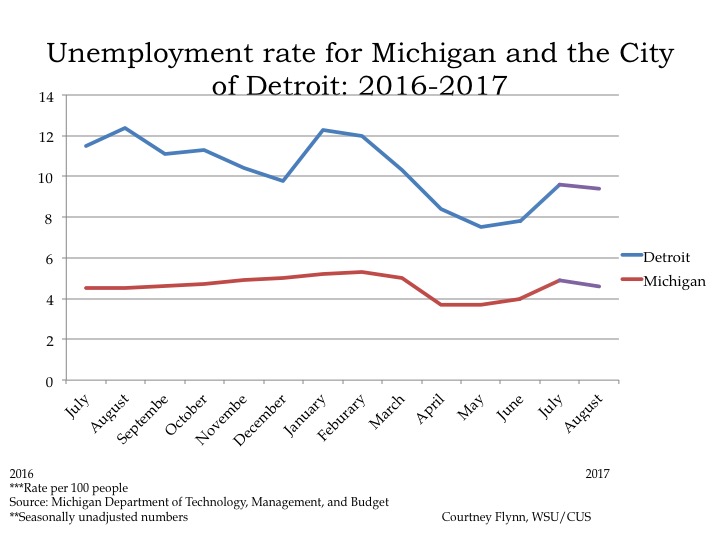
In August of 2017 the unemployment rate for the State of Michigan was 4.6, a slight decrease from the July unemployment rate of 4.9, according to the most recent data provided by the Michigan Department of Technology, Management and Budget. The State unemployment rate for August is about on par with what it was reported to be in August of 2016 which was 4.5.

The City of Detroit unemployment rate was reported to be 3 points lower in August of 2017 than what it was reported at in August of 2016. For August of this year the City’s unemployment rate was reported at 9.4; in 2016 it was reported to be 12.4.

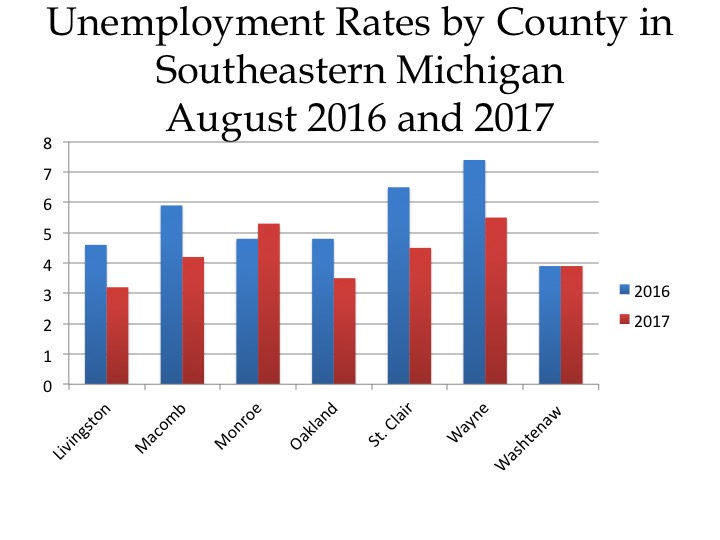
The chart above displays the unemployment rates for each of the seven counties in Southeastern Michigan for August of 2016 and 2017. Wayne County had the highest unemployment rates for both 2016 and 2017 (7.4 and 5.5 percent, respectively). In August of 2017, Livingston County had the lowest unemployment rate at 3.2 while Washtenaw County had the lowest rate in 2016 at 3.9 (Washtenaw County’s rate remained at 3.9 in August of 2017 too).

Wayne and Monroe counties were the only two in the region with unemployment rates above 4.6 percent in 2017. In 2016 though, Washtenaw County was the only one in the region that had an unemployment rate below 4.5.

St. Clair County had the largest unemployment rate decrease between June 2016 and 2017 at 2 and Wayne County had a decrease of 1.9.

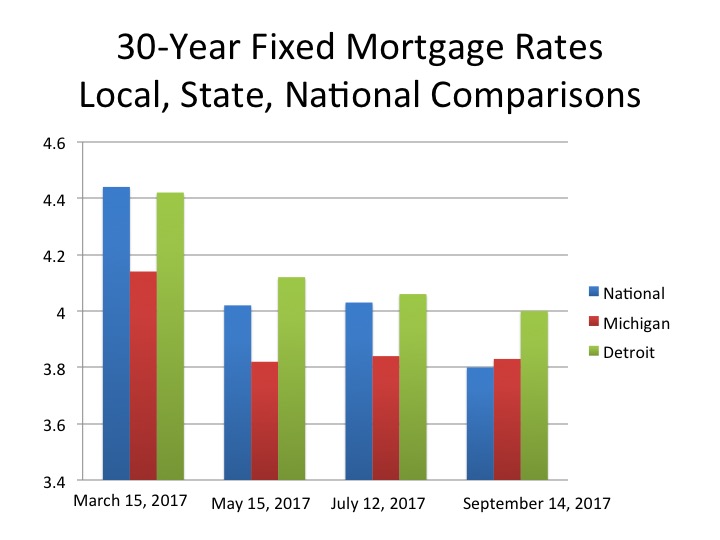
Above are three average 30-year mortgage interest rates at the national, state and local levels. These rates were provided by bankrate.com, which does a national survey of large lenders on a weekly basis. As a 30-year fixed rate mortgage is the most traditional type of home financing this was chosen to show the rate differences.

It was the national interest rate with the lowest average for the week of September 14, 2017 at 3.8, which was 0.23 points lower than the last time we examined this data. This is the first time in the four months we have examined this data that the national interest rate average was lower than the State of Michigan’s.

Also during the week of September 14, 2017 Detroit’s average 30-year fixed mortgage interest rate was 4, a rate that was higher than both the national and state averages. This was the lowest we have reported it to be since March.

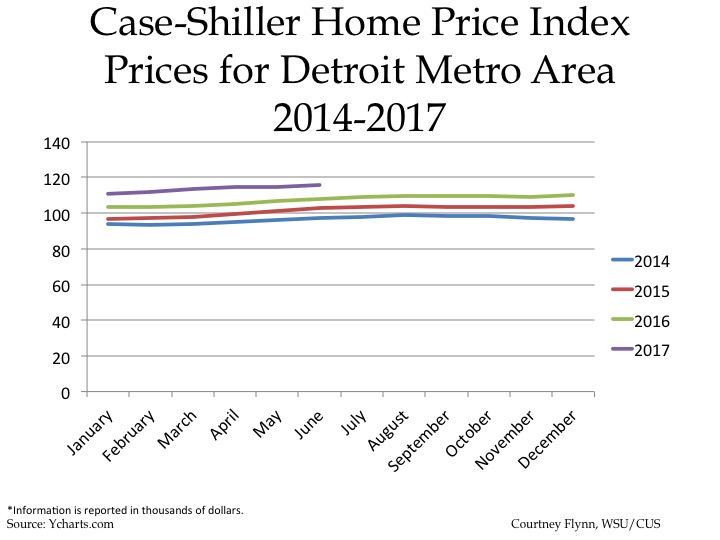
The above charts show the Standard and Poor’s Case-Shiller Home Price Index for the Detroit Metropolitan Statistical Area. The index includes the price for homes that have sold but does not include the price of new home construction, condos, or homes that have been remodeled.

According to the index, the average price of single-family dwellings sold in Metro Detroit was $116,030 in June 2017; this was $1,170 higher than the average family dwelling price in May. Also, the June 2017 price was an increase of $8,130 from June of 2016 and an increase of $13,320 from June of 2015 and an increase of $18,690 from June of 2014.

Community Comparison:Bloomfield Hills, Highland Park

As we’ve been highlighting over the last several weeks in a series of posts focused on median income, poverty levels, housing and educational attainment, it is no longer just the traditionally economically depressed communities that are still feeling the effects of the Great Recession. From the rural communities on the outskirts of the region to the middle-class communities that make up much of Southeastern Michigan, economic recovery has been slow. Of course, some communities continue to fare worse than others throughout the region, and in Southeastern Michigan one community that has suffered a great deal is Highland Park. With a median income of $17,250, an 11 percent increase in the adult poverty level since 2000 and a 36 percent homeownership rate, Highland Park remains one of the most, if not the most, economically depressed community in the state. And, just 20 miles north is the City of Bloomfield Hills, where the median income is nearly 10 times that of Highland Park, the percentage of adults in poverty is about 15 times less, and the homeownership rate is at about 90 percent. The community comparison shown above is simply another visual of the class segregation that exists throughout the region. Despite such a short geographical distance existing between these two communities the socioeconomic differences could not make them seem any farther apart. These vast differences can be, at least in part, attributed to decades of policy decisions that have affected flight from the region’s hub(Detroit and its inner-ring suburbs), homeownership, economic growth, stable education systems, proposed public transportation systems and the lack of effective government responses and collaborations.


**All data in the infographic is from the 2015 American Community Survey**

Strong Correlations Exist For High Education Levels and High Incomes Throughout Most of Southeastern Michigan

In our last post we showed there is an area of overlapping high median incomes and high educational attainment running through Washtenaw County, western Wayne County, southern Oakland County and western Macomb County with nearly the opposite—lower median income and lower educational attainment–south of that in the region. In this post, we discuss explicitly the correlation between the levels of education examined in the last post (less than high school education, high school education, associate’s degree or some college education, bachelor’s degree, and graduate/professional degrees) and median incomes. The correlations are calculated for medians and percentages of municipalities across the region.

A correlation is statistical technique that can be used to describe the relationship between two variables. The correlation coefficient, often expressed as ‘r,’ is a numerical value that is always between +1 and -1. When r is closer to +1, it implies a positive correlation; as one variable increases, the other does as well. When r is closer to -1, it implies an inverse correlation; as one variable increases the other decreases. When the value of r is closer to 0 the implication is that there is no relationship between the two sets of data.

Educational Attainment Correlation Value
Achieved less than a high school diploma -0.74
Achieved only a high school diploma -0.71
Achieved some college or an associate’s degree -0.57
Achieved only a bachelor’s degree 0.75
Achieved a graduate or professional degree 0.77


Looking first across the region incomes tend to be lower for those municipalities with a higher percentage of people who do not have a high school degree, with a correlation of -0.74. This tends to indicate that less education leads to lower incomes. At the same time, it could mean that people with lower incomes have less of chance of completing their education. For those with a high school diploma the effect was slightly smaller, with a correlation of -0.71, and similarly for those with some college or an associate’s degree the correlation was -0.57.

For those at the upper end of education distribution the opposite holds true—there is a positive correlation between higher educational levels and higher incomes. Across Southeast Michigan for the municipalities with a higher percentage of people with a bachelor’s degree, incomes tend to be higher, with a correlation of 0.75. The relationship between income and educational attainment is even stronger for those who have attained graduate or professional degree, with a correlation of 0.77.

Next we examined these relationships at the county level—for all municipalities in a county. Of the seven counties in the region, Wayne County had the strongest correlations of (0.91) in relation to those with bachelor’s degrees and the median income. For those with graduate or professional degrees in Wayne County the correlation was 0.90 percent.  Monroe County had the weakest correlation value between those with bachelor’s degrees and the median income, with a correlation value of 0.22; it also had the weakest correlation between income and those with graduate or /professional degrees, with a correlation value of at -0.13 percent. Such values for Monroe County indicate that the relationship between higher levels of education attainment and higher median incomes are weakened or reversed in that largely rural setting. For several of the other counties, the correlation between these variables was much greater. In addition to Monroe County having a weak relationship between median income and those with a bachelor’s degree, there was also a weak relationship between those same two variables for St. Clair and, surprisingly, Washtenaw counties. For Washtenaw, it may occur because there are many students with higher education who are still pursuing degrees and have relatively lower incomes.

At the other end of the education spectrum, there exist a strong tendency for lower incomes to be associated with lower levels of education. Each county has either a moderate to strong correlation between incomes and lower levels of education. Monroe County again had the lowest correlations between median income and educational attainment for attainment, this time for less than a high school education and up to a high school education.

Overall, these analyses show a range of correlations across counties between higher median incomes and higher levels of educational attainment, some high and positive, others weak. Monroe County stands out as the only county one where there was a weak correlation between median income and all levels of educational attainment. It could be speculated this is because it is a more rural county and much of the work there relates to agriculture, work that is often learned at home within families.  In southeastern Michigan as a whole, there are relatively strong positive and inverse correlations between incomes and education attainment. There is a positive correlation between those who have achieved a graduate or professional degree and incomes–people with higher education tend to have higher incomes.  There is an inverse relationship between those who have not achieved a high school diploma and incomes–those with less education tend to have lower incomes.

Median Income, Educational Attainment Highlight Segregated Classes in Southeastern Michigan

Using Census data, this post examines the visual correspondence between income and educational attainment across the region. It clearly portrays the continuing association between these two critical variables with one region of high income and high educational achievement arching across the region from Washtenaw County, through Western Wayne County and up through Oakland County and western Macomb County. South of this is a region of lower income and educational attainment with a few islands of higher income and achievement. In all, this represents a strong and largely consolidated portrait of segregated classes in this region.

In Southeastern Michigan the City of Highland Park had the lowest median income at $17,250, with 33 percent of the adult population only having a high school diploma. In terms of educational attainment in Highland Park, those who had some college education or an associate’s degree represented the highest percentage of residents, as opposed to the other categories (less than high school, high school education, bachelor’s degree, graduate or professional degree). On the opposite end of the spectrum, the City of Bloomfield Hills had the highest median income at about $173,000, with the largest percent of its adult population having a graduate or professional degree (38%). Such trends are not unique to Highland Park or Bloomfield Hills.

Above the maps show what the median income of each community is with an overlay that shows what the percentage of educational attainment is at five different levels. These levels are: graduate degree, bachelor’s degree, associate’s degree or some college, high school diploma or an equivalency and less than a high school diploma. The overall purpose of each map is to present an image on how educational attainment and at each level may, or may not, relate to the median income.

When looking at the maps above we see that the communities that have more than 18 percent of its adult population with graduate or professional degrees tend have median incomes above $77,000. In total, there were only 10 communities, out of 46, where more than 18 percent of its adult population had graduate or professional degrees but the median income was below $77,000. Of those 10 communities, the City of Ypsilanti had the lowest median income at about $31,000 and 18 percent of its adult population had a graduate or professional degree. The community with the highest percentage of adult residents with a graduate or professional degree  is Ann Arbor, where both the University of Michigan and the University of Michigan Hospital are located. The median income for Ann Arbor in 2015 was $103,000. There was no community in Southeastern Michigan where more than 30 percent of the adults had a graduate or professional degree and had a median income below $95,000.

On the opposite side of the spectrum, there are 154 communities in Southeastern Michigan where 10 percent or more of the adult population had less than a high school education in 2015. The City of Hamtramck had the highest percentage of adults without a high school education at about 31 percent; the City’s median income was about $23,000. There are nine communities in the region where 20 percent or more of the population had less than a high school education. Of those nine communities, with the exception of Lincoln Park, none had a median income above $33,000. The median income in Lincoln Park was $41,000 in 2015. The City of Detroit is included in that list of nine communities, with a median income of about $26,000 and about 22 percent of its adult population having less than a high school education. Additionally, in Detroit, about 32 percent of the adult population had a high school education, and about 32 percent had some college education or an associate’s degree.

The percentage of Detroit residents with a bachelor’s degree was far lower than any of the statistics mentioned above. In Detroit, about 8 percent of residents had a bachelor’s degree in 2015. In terms of the percentage of residents throughout Southeastern Michigan with a bachelor’s degree, the average percentage was 18 percent and the median income was about $66,000.

Regionally, the community with the highest percentage of residents with a bachelor’s degree was the Village of Grosse Point at about 62 percent; the city had a median income of about $139,000. The City of River Rouge had the lowest percentage of adults with a bachelor’s degree at about 4 percent; it had a median income of approximately $26,000. In total, there were 46 communities in Southeastern Michigan where less than 10 percent of the population had a bachelor’s degree. Exeter Township, located in Livingston County, had the highest median income of the 46 communities that had less than 10 percent of its adult residents with a bachelor’s degree. The median income in Exeter Township was about $68,000.

Overall, this post shows that there is a correlation between median incomes and educational attainment, a deeper conversation that we will dive into next week. The maps and the data show that it is the communities with the higher percentage of residents with a bachelor’s degree and/or a graduate degree that have amongst the highest median incomes.