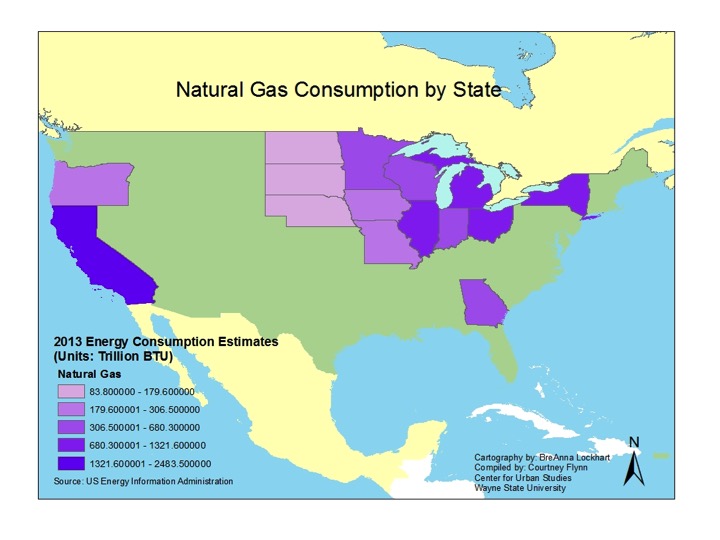
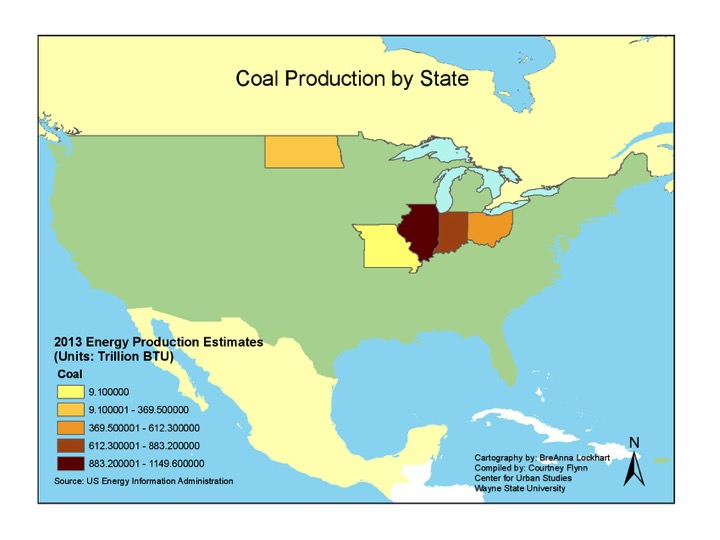
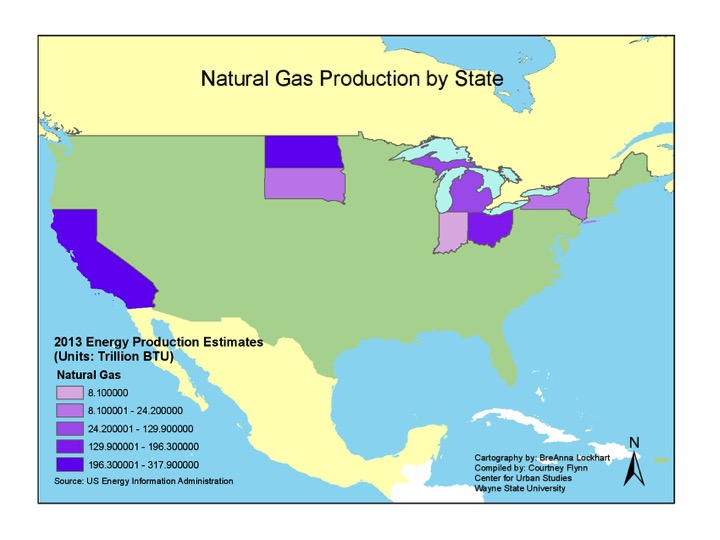
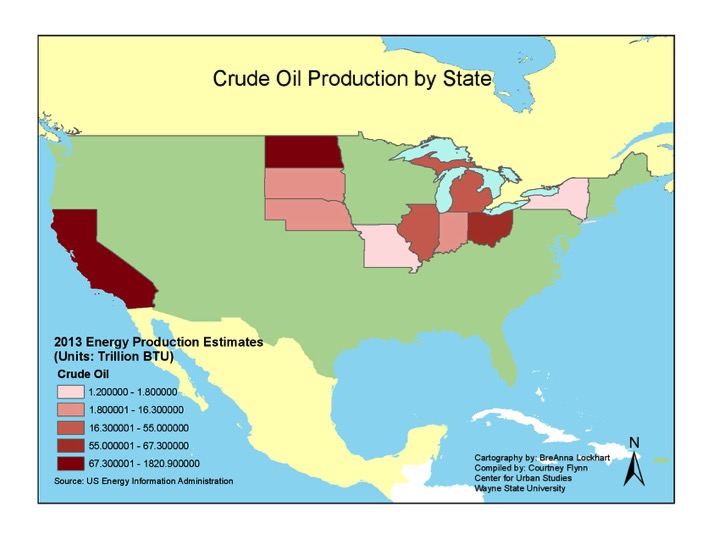
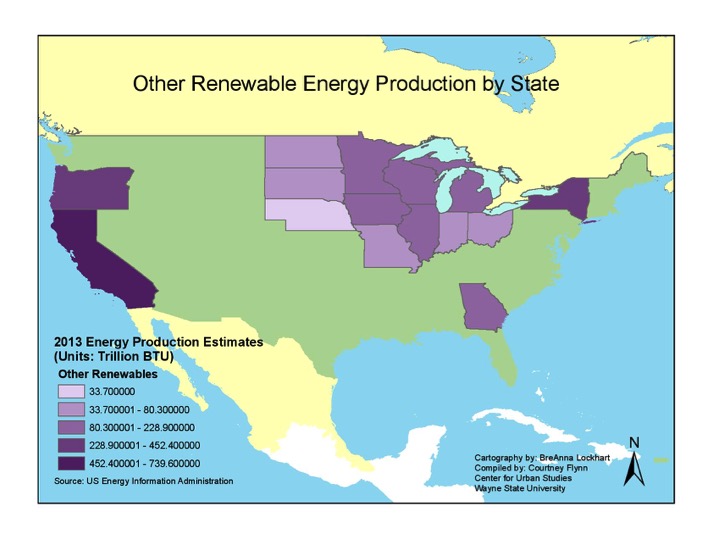
While there has been a shift toward renewable energy sources over the last 10 years, there has also been an increase in usage of natural gas as an energy source. According to the U.S. Energy Information Administration, Michigan, California and New York all shifted away from oil and coal as sources for energy consumption and instead increased their usage of renewable energy sources. California and New York also increased their usage of natural gas as an energy source. The shift toward natural gas usage began in 2009 when the price gap between coal and natural gas production narrowed because of the increased supply of natural gas extracted from shale, according to the U.S. Energy Information Administration. Another, secondary, reason the shift occurred on a national basis, according to the U.S. Energy Information Administration, is because the generation of coal-powered energy has been declining as a result of stricter regulations by the U.S. Environmental Protection Agency.
In this post energy consumption and production between 2003 and 2013 is compared for Michigan, New York and California.
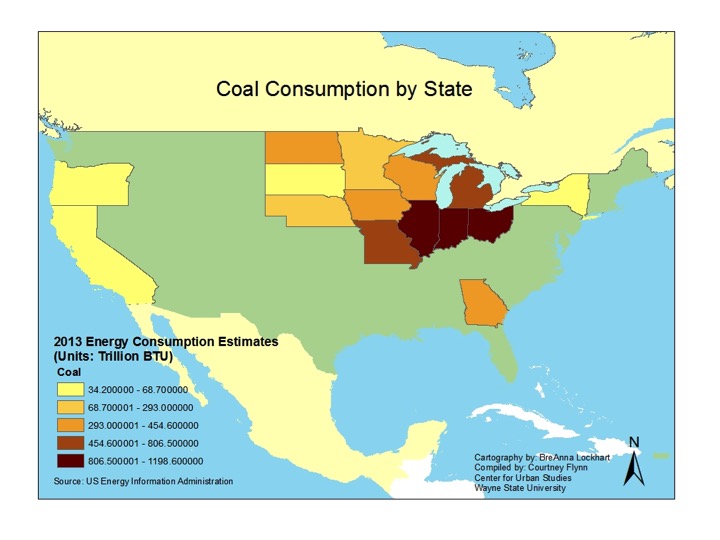
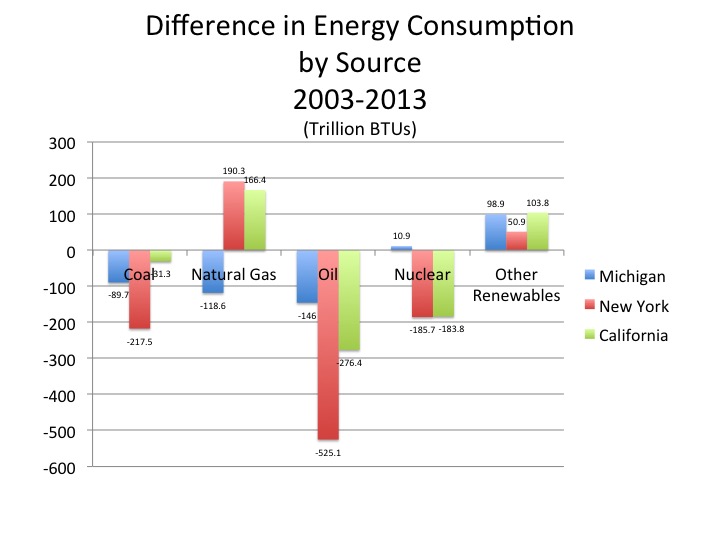
Between 2003 and 2013 New York’s consumption of coal as an energy source decreased the most of the three featured states by 217.5 trillion BTUs. This decrease was made up, and then some, by increased usage of natural gas (190.3 trillion BTUs-the highest of the three states) and renewable energy (50.9 trillion BTUs). Natural gas and renewable energy were the only two energy sources for which New York increased consumption of between 2003 and 2013. According to U.S. Census data, residents of the state of New York are increasingly relying on natural gas as a heat and electricity source. In the last 10 years that reliance on natural as a heating source has increased by about 500,000 households, according to Census data. New York also had the largest decrease in usage of oil between this time at 525.1 trillion BTUs.
In California natural gas consumption increased by 166.4 trillion BTUs between 2003 and 2013. According to the state, the increased consumption is, in part, being used as an alternative for petroleum in cars, trucks and buses as the use of alternative transportation options grow. Additionally, two-thirds of households in California use natural gas to heat their home, according to the U.S. Energy Information Administration.
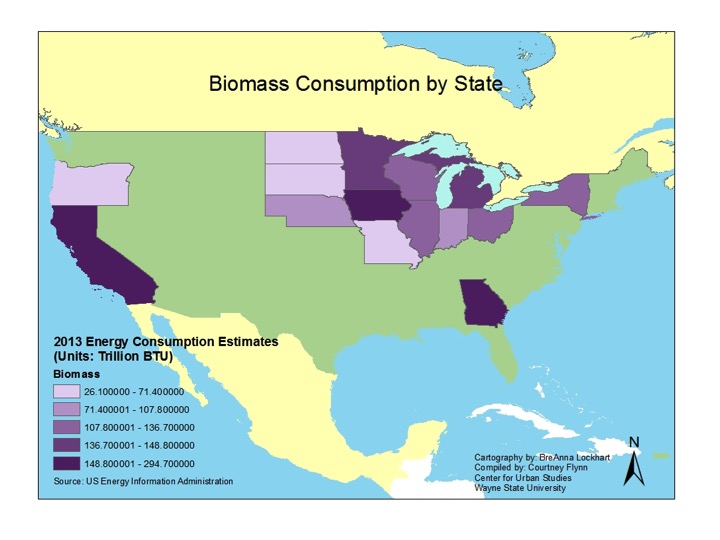
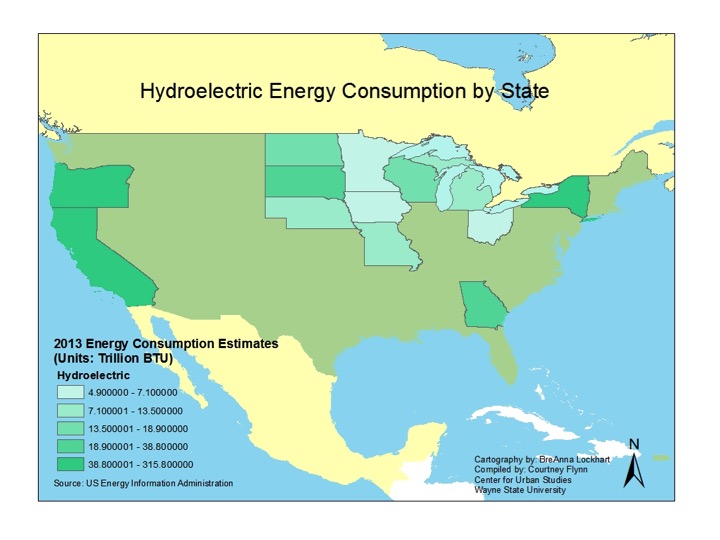
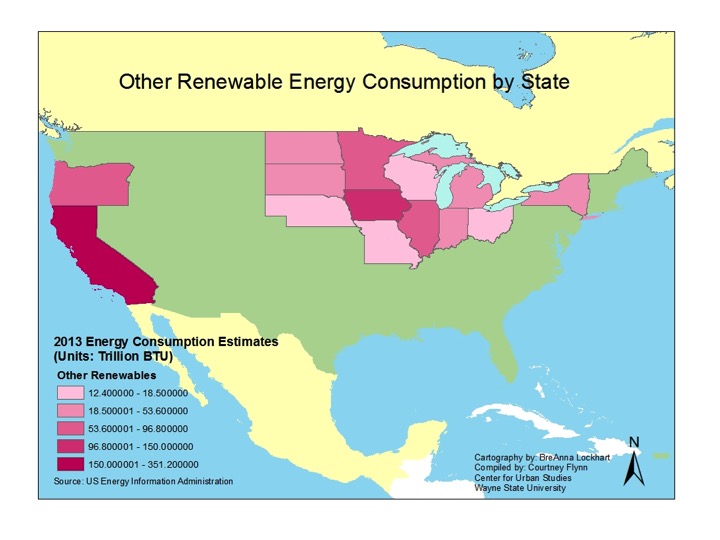
California experienced the largest increase of renewable energy usage between 2003 and 2013 at 103.8 trillion BTUs. This increase, according to the U.S. Energy Information Administration, can be attributed to the state’s policies that made it the first state in the country to receive 5 percent of its utility-scale electricity from solar power and partially because of its mandate to reduce green house gas emissions through various efforts.
Michigan experienced an increase of its usage of renewable energy by 98.9 trillion BTUs between 2003 and 2013. Like California, Michigan also passed a mandate for increased renewable energy usage. The Clean, Renewable, Energy Efficiency Act stated that by 2015 utility providers must obtain at least 10 percent of the energy they sell from renewable sources.
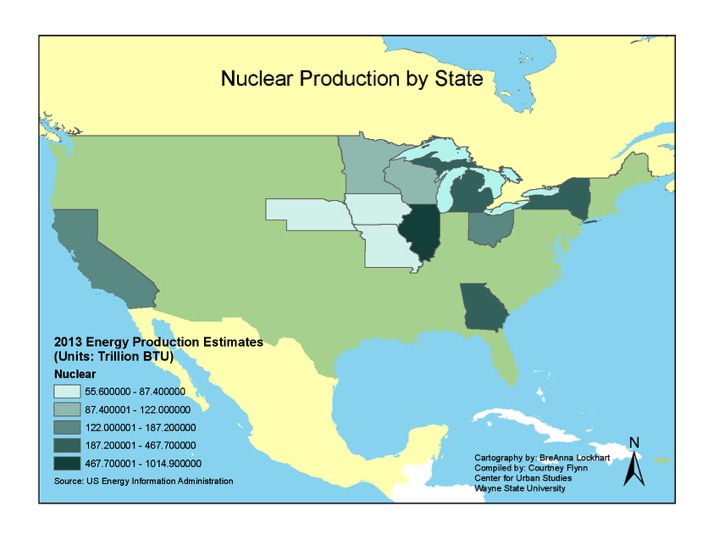
With Michigan’s increased usage of renewable energy sources, and a small amount of nuclear power, it experienced a decrease in coal, natural gas and oil consumption.
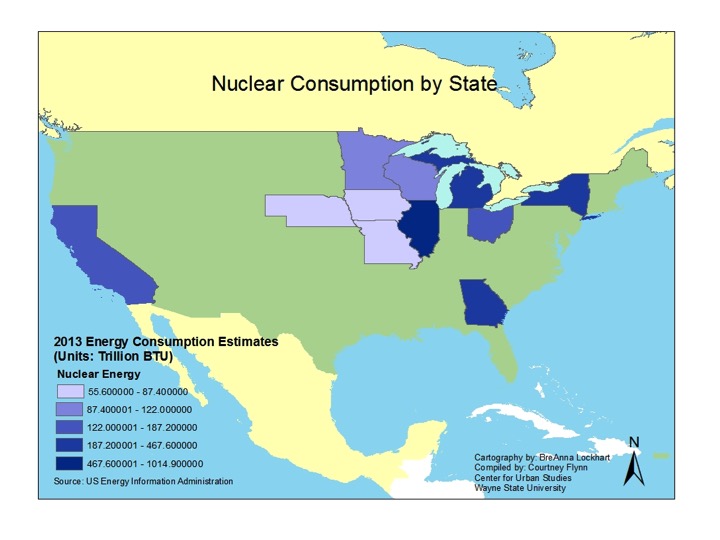
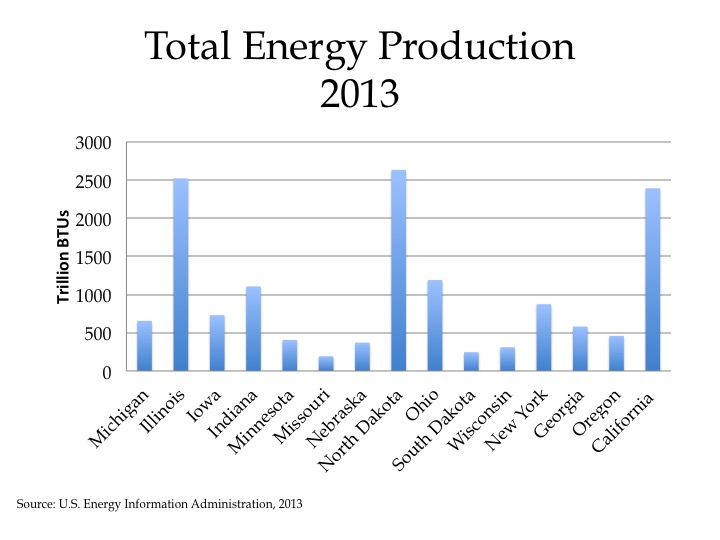
Of these three states though, Michigan was the only one to experience an increase in nuclear energy consumption (10.9 trillion BTUs) and a decrease in natural gas consumption. As can be seen in the production comparison chart, this is related how much of each energy source was produced in Michigan between 2003 and 2013. Although Michigan is consistently one of the top five states in the country to consume natural gas as an energy source, its production has been declining for the last 30 years, according to the U.S. Energy Information Administration.
All three states also experienced a substantial overall decline in energy consumption from 2003 through 2013, probably because of conservation and the severe impacts of the Great Recession on the state and its industrial production.
Between 2003 and 2013 New York’s consumption of coal as an energy source decreased the most of the three featured states by 217.5 trillion BTUs. This decrease was made up, and then some, by increased usage of natural gas (190.3 trillion BTUs-the highest of the three states) and renewable energy (50.9 trillion BTUs). Natural gas and renewable energy were the only two energy sources for which New York increased consumption of between 2003 and 2013. According to U.S. Census data, residents of the state of New York are increasingly relying on natural gas as a heat and electricity source. In the last 10 years that reliance on natural as a heating source has increased by about 500,000 households, according to Census data. New York also had the largest decrease in usage of oil between this time at 525.1 trillion BTUs.
In California natural gas consumption increased by 166.4 trillion BTUs between 2003 and 2013. According to the state, the increased consumption is, in part, being used as an alternative for petroleum in cars, trucks and buses as the use of alternative transportation options grow. Additionally, two-thirds of households in California use natural gas to heat their home, according to the U.S. Energy Information Administration.
California experienced the largest increase of renewable energy usage from 2003 and 2013 at 103.8 trillion BTUs. This increase, according to the U.S. Energy Information Administration, can be attributed to the state’s policies that made it the first state in the country to receive 5 percent of its utility-scale electricity from solar power partially because of its mandate to reduce green house gas emissions through various efforts.
Michigan experienced an increase of its usage of renewable energy by 98.9 trillion BTUs between 2003 and 2013. Like California, Michigan also passed a mandate for increased renewable energy usage. The Clean, Renewable, Energy Efficiency Act stated that by 2015 utility providers must obtain at least 10 percent of the energy they sell from renewable sources.
With Michigan’s increased usage of renewable energy sources, and a small amount of nuclear power, it experienced a decrease in coal, natural gas and oil consumption.
Of these three states though, Michigan was the only one to experience an increase in nuclear energy consumption (10.9 trillion BTUs) and a decrease in natural gas consumption. As can be seen in the production comparison chart, this is related to how much of each energy source was produced in Michigan between 2003 and 2013. Although Michigan is consistently one of the top five states in the country to consume natural gas as an energy source, its production has been declining for the last 30 years, according to the U.S. Energy Information Administration.
All three states also experienced a substantial overall decline in energy consumption from 2003 through 2013, probably because of conservation and the severe impacts of the Great Recession on the states and its industrial production.
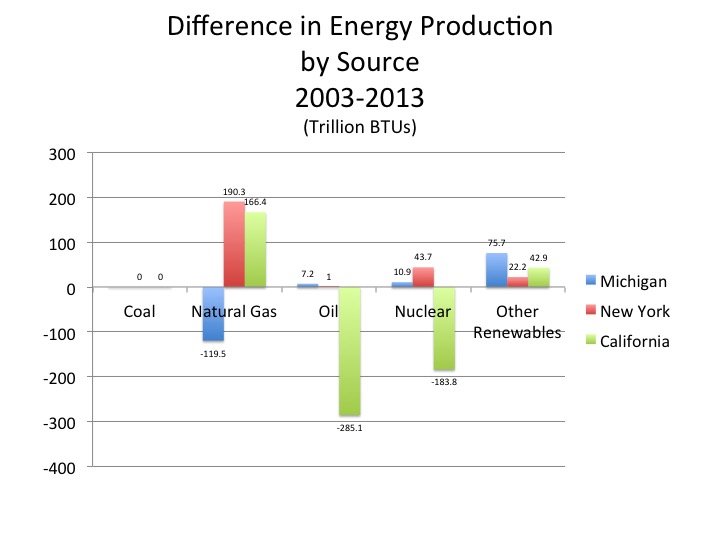
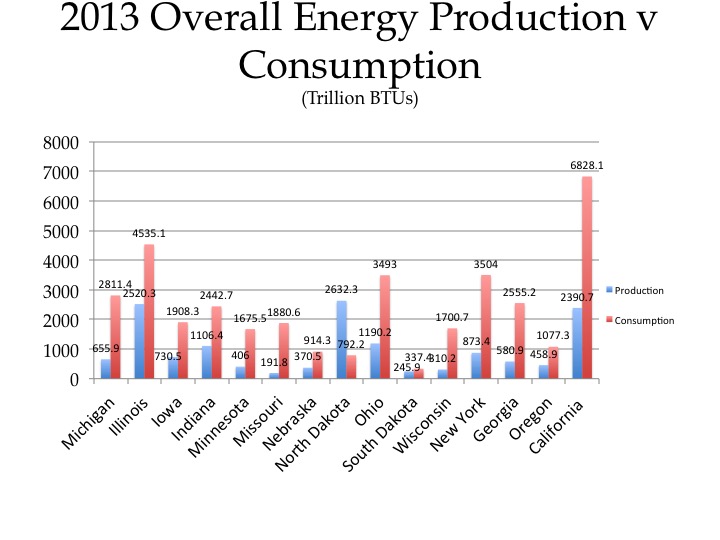
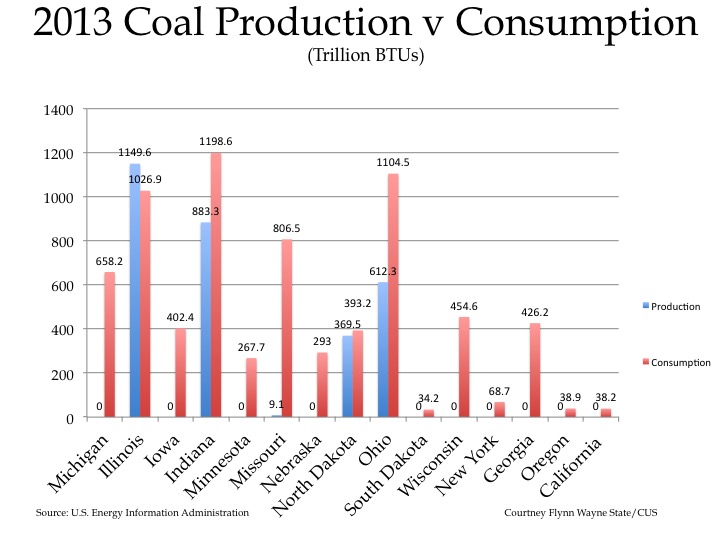
The below charts show the change in consumption and production of energy sources between 2003 and 2013.
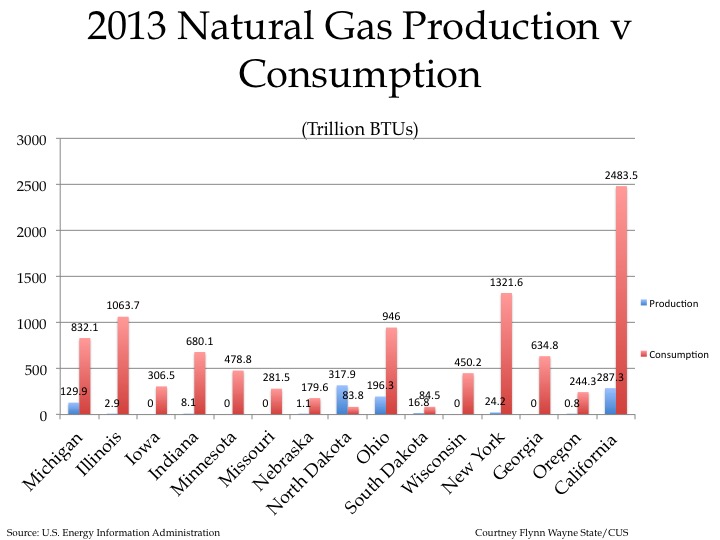
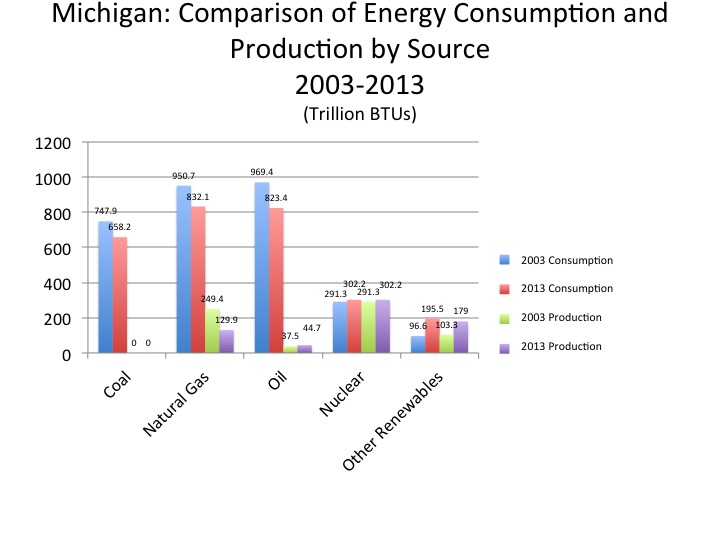
In Michigan, we see there was a decrease in natural gas, oil and coal consumption between 2003 and 2013. At the same time, the amount of energy consumed through all three of these sources heavily outweighed the amount produced in both 2003 and 2013. The chart also shows how in 2003 oil was the most relied upon energy source (969.4 trillion BTUs) but in 2013 that shifted to natural gas (832.1 trillion BTUs of natural gas and 823.4 trillion BTUs of oil), despite the fact that natural gas consumption and production in the state is decreasing. The amount of which natural gas usage decreased between 2003 and 2013 was almost entirely replaced by the increased usage of renewable energy (118.6 decreased natural gas usage) and 103.8 trillion BTUs increased renewables, respectively). The decreased production of natural gas (119.5 trillion BTUs) was not entirely replaced by the production of renewable energy sources (75.7 trillion BTUs) though.
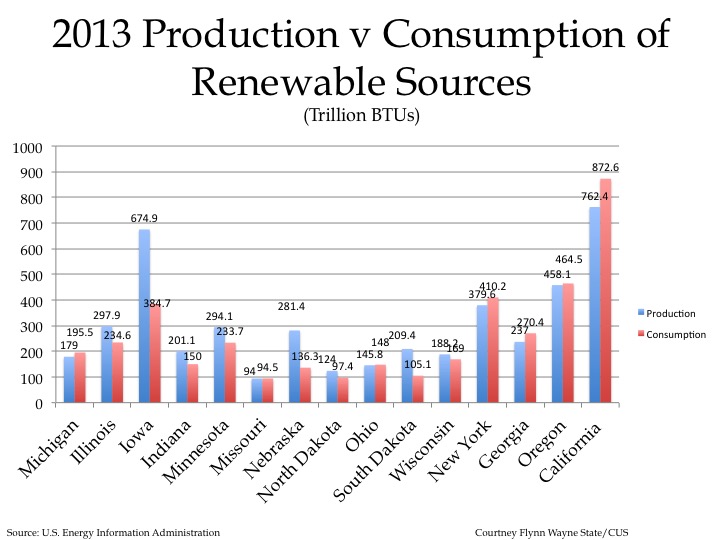
The consumption of renewable energy is increasing faster than the rate of production. As noted earlier though, wind produces ones of the largest amounts of renewable energy in Michigan (consumption of wind power energy is equivalent to the amount produced), and the number of wind farms in the state is expected to grow from 21 to 27, as six additional farms are in the process of being developed, according to the state of Michigan.
Production and consumption of nuclear energy in the state varied the least in the state between 2003 and 2013.
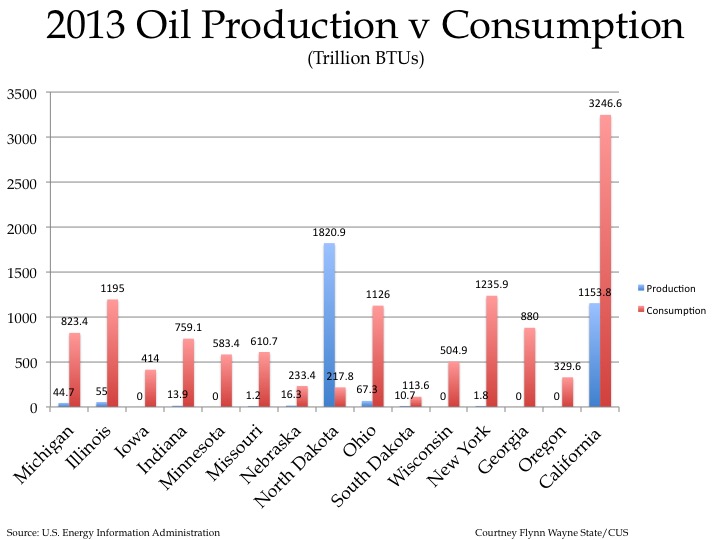
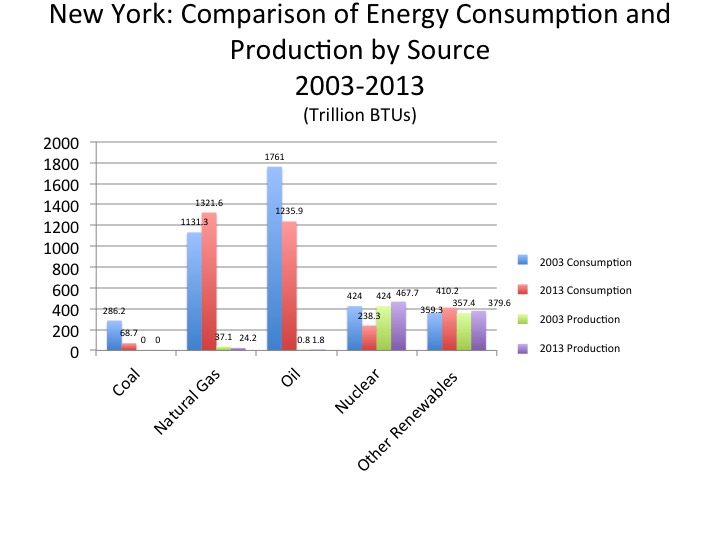
Just as with Michigan, the chart below shows New York’s shift from oil to natural gas for consumption between 2003 and 2013. In 2003 1131.3 trillion BTUs of natural gas was consumed in New York and 1761 trillion BTUs of oil. By 2013 though, the natural gas used increased to 1321.6 trillion BTUs and, the amount of oil decreased to 1235.9 trillion BTUs.
For renewable energy, consumption increased from 359.3 trillion BTUs to 410.2 trillion BTUs. In 2003 in New York, oil, natural gas, nuclear and coal energy sources were all used more than renewable energy sources, despite the fact the amount of renewable energy sources produced in that year was higher than the amount of coal, natural gas and oil produced in the state. By 2013 coal use had declined substantially, while renewable production and use was increasing.
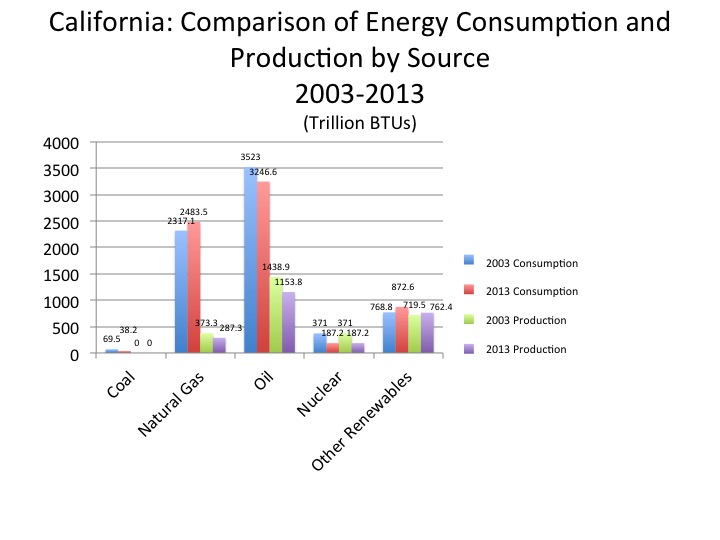
Although California’s consumption of oil decreased between 2003 and 2013, the state still used it more than any other source in 2013. In 2003, 3523 trillion BTUs of oil were consumed, while this declined to 3246.6 trillion BTUs by 2013. The shift toward increased use of natural gas and renewable energy sources can be seen, but those numbers still do not exceed oil consumption. The use and production of renewable energy sources in California has continuously outweighed that of coal and nuclear energy. But the increased use and production of renewable energy sources still falls short of the use and production of natural gas. Between 2003 and 2013 the use of natural gas increased by 166.4 trillion BTUs and the use of renewable energy increased by 103.8 trillion. Production of natural gas increased by 166.4 trillion BTUs and production of renewables increased by 42.9 trillion BTUs.
In sum, the shift toward utilization and production of renewable energy sources is evident. With regulations on coal and oil growing stronger, and policies continuing to shift toward increased production and use of renewables, there is a definite move toward renewable energy. For now, however, the bigger move is that these states are substituting natural gas for oil and coal.
It is encouraging and fascinating, however, that there are substantial overall reductions in energy usage with New York clearly the leader.