Parks Need Priority in Funding to be Sustained

While park land is plentiful in Southeastern Michigan, its upkeep and protection is something necessary to keep it accessible to the public. As noted in our last post, park land throughout Michigan, and Southeastern Michigan, is made accessible through government entities, non-profits and/or private organizations. The funding of park lands and public spaces by non-profit and private organizations is at the will of the organizations’ board members and owners. However, funding and protecting park land through government entities is often more complex.

Government owned and operated parks throughout Michigan are funded primarily through tax dollars, but user fees, grants and donations also aid in their funding. At the state level, according to the Michigan Department of Natural Resources (MDNR), about 97 percent of funding for parks operations and maintenance is generated by user fees and royalty revenues. According to the MDNR, the breakdown is as follows:

  • 51%: Camping and lodging reservation fees
  • 26%: Recreation Passport sales
  • 15%: State-owned, oil, gas and mineral royalty revenues – which feed the Michigan State Parks Endowment Fund – (15%)
  • 5%: Concessions, shelter reservations and miscellaneous sources

Michigan’s General Fund tax dollars provide the remaining three percent of state parks funding.

At the County level, funding differs from one county to the next. For example, in Wayne County there is a millage (0.2459 mills) that funds county parks and distributes money to local communities for their parks. This millage means that the County’s general fund is not expected to make room for parks funding, but if those elected to represent Wayne County residents chose to do so in the general fund they can. Instead, through this additional millage that was voted on by the people (in 2016 and renewed in 2020) there is a dedicated funding source for a guaranteed amount of time. Through a parks millage, funding is dedicated to the creation, operation and/or upkeep of a park. When parks are funded through just the general fund the amount of money allocated to the parks, the programs and/or upkeep can vastly differ from year-to-year depending on the priorities of the elected bodies.

By simply putting a parks millage on the ballot, Wayne County showed that park improvements were a priority of theirs, and with 76 percent of voters supporting the 2020 ballot initiative this also showed that Wayne County residents also view parks as a priority.

In addition to Wayne County having a millage that helps support its parks and recreation opportunities so does Oakland, Washtenaw and St. Clair counties. In Southeastern Michigan, Monroe, Macomb and Livingston counties do not have additional funding mechanisms to support their parks.

Despite Monroe, Macomb and Livingston counties not having county-wide millages to help fund parks, there are cities in Livingston and Macomb counties that have millages to help support their parks.

For example, in Livingston County the Howell Area Parks and Recreation is supported by a 0.75 millage. This millage not only created the recreation agency that services Genoa, Marion, Oceola and Howell townships it also finances the parks and services the residents of these townships use and rely on.

In Macomb County, the cities of Roseville and Eastpointe created a joint recreation authority through a 1 mill tax levy that was originally approved by voters 2011. This millage allows the authority to operate, offer services (which produce revenue, also allowing the authority to operate) and maintain and update facilities and parks. Municipalities such as Washington and Macomb townships also have millages (one for each township, they do not have a joint authority) that support their parks and their recreation opportunities.

So, while tax dollars are a primary source of funding for our parks, and the opportunities they provide, the commitment to their allocation varies. Additionally, commitment to the funding of public parks comes from other sources as well. For example, there are the revenues generated from their use (fee structures differ from one park to the next, one program to the next and one municipality to the next), donations offered from various people and groups and grants that municipalities receive.

The grants that municipalities can apply for to support their parks are rather plentiful; the MDNR, the Southeastern Michigan Council of Governments, Ralph C. Wilson Jr. Foundation are just some of many organizations that allocate grand fund to support parks and recreation opportunities. However, grants are often a one-time allocation of funds and cannot be relied on to ensure a park, its staffing, its programs and more will continue from one year to the next.

To ensure the park land, and the programs associated with it, we all benefit from remains accessible and useable we must create dedicated funding mechanisms. Millages are one source, but must be approved by voters. And, while general fund dollars flow into a municipality on an annual basis, the allocation of those funds differs annually.

Ten Things Joe Biden and Kamala Harris Should Do for Detroit

There are two reasons Detroit should have a special place in President-elect Joe Biden’s heart. First, because Detroit needs real help–now. And second is because Detroit is one of the key places that brought his victory. Detroiters voted in massive numbers for him and Vice President-elect Kamala Harris, and Democrats will need Detroit voters to win again. As the saying goes, you need to dance with the ones who brung you.

Here, then, are ten agenda items Biden and Harris should prioritize—giving back to a City that helped bring them into office.

1.Make plenty of vaccine doses available. Unemployment linked to COVID-19 closures have hit the poor and those in service jobs far harder than other industries. Unemployment numbers are more than double in Detroit than in Michigan. More vaccines mean it’s safer to go back to work, and Detroiters need that work and the accompanying income now. That will improve many other things mentioned here, including reducing violence.

2. Reduce the violence. We’ve seen major increases in murders and shootings. On surveys through the years, Detroiters have consistently said public safety is at the top of their agenda, but that does not translate to a desire for heavy duty police enforcement across the board. Rather than defund the police, Biden should talk about demilitarizing the police and making them responsive to the true needs of the community. Detroit citizens want tough action against the repeated violent offenders, but they want first time offenders and others diverted out of stigmatizing court process into community service, education and job training programs. For example, police regularly stop hundreds of people and arrest them for carrying illegal weapons. We need to divert these citizens into training programs that teach them about the risks of violence. We need to use conflict deflectors and de-escalators to reduce violence. Increased participation in youth sports and utilization of open community centers will also help deter violence. While many of these outlets have been closed and cancelled due to COVID restrictions, we must find ways to continue to offer such opportunities.  

3. Reduce domestic violence. Domestic violence, already high in Detroit, has increased under COVID-19, and the enforcement of parole violations for domestic violence offenders by Michigan Department of Corrections has declined.

Detroit has far fewer shelter beds than surrounding communities for survivors of domestic violence (DV) or intimate partner violence (IPV). This needs to be corrected immediately. Beyond that, survivors need to have far more access to advocates who can help them navigate the complex legal and support systems that do exist. They need more financial help to pay for things like moving to safe locations and serving Personal Protection Orders that are intended to help shield survivors from further violence.

4. Increase jobs for youth.  Detroit youth have extraordinary unemployment levels, well above the already high adult unemployment levels. This is a crisis, especially because we know that this will affect their lifetime earnings and connection to the workforce. Such high levels have led to challenges to democracy itself in other times and countries.

We need broad, youth employment programs funded by the federal government and operated by non-profits that do real work to help improve Detroit.  These jobs must create job ladders for youth so they have a future in which to invest.

5.Increase support for youth to go to college, apprenticeships, and training at community colleges. Many youth have no real way to pay for college.

We need to increase Pell Grants very substantially so youth who want higher education can get it without having a lifetime of debt, as so many do now. Apprenticeships and training in the skilled trades also often lead to good jobs with benefits and high wages—sometimes higher than college-educated jobs. These opportunities also need more funding so the youth have access to an even wider range of skills and jobs.

6.Fully fund special education. In Michigan, charter schools are implemented in a manner where they generally recruit higher performing students from the public schools, leaving the public schools with fewer higher performing students—who tend to cost less to educate. In major urban areas, charter schools proliferate and the public schools end up with a disproportionate share of special education students, which the charter schools avoid. These students cost more to educate. Because special education is not fully funded by the federal government, the costs are off loaded onto urban school districts in Michigan. These costs drive urban school districts into debt and decline. None of this makes it onto the debate stage, but this is the crucial work that needs to be completed to help Detroit and other cities like it. More federal funding is needed for special education students.

7.Invest massively in home repair. Detroit’s housing is crumbling with 63% of the housing units having at least one major health hazard. Lead paint, lack of heat, flooding, asbestos, Volatile Organic Compounds (VOCs), structural hazards, fire hazards—these are all present across the range of homes in Detroit both for homeowners and renters.

Detroiters don’t have the money to pay for all these repairs, and Community Development Block Grant dollars continue to decrease. Money for repairs of existing homes is needed to make them safe and to protect existing residents from disease, injuries and break-ins. This will also protect them from gentrification.

8.Protect homeowners from foreclosure. This is a perennial issue in Detroit that turns into a crisis with every recession. In the Great Recession, many thousands of homes were wrenched from homeowners. Now foreclosures are high again.

Short term cash and longer term re-writing of mortgage agreements are critical to short circuiting this endless cycle of foreclosures that has already made Detroit a majority renter city. This too will protect existing homeowners from gentrification.

9.Invest heavily in weatherization. One the highest costs that Detroiters face are their utility bills, both for renters and homeowners. Leaky old houses mean huge heating bills that often take up a large part of the budgets of low and moderate income households. In neighborhoods like Southwest Detroit, where industry and traffic pollute the air, this weatherization should also include air filters to clear the air that people breathe most of the time (Americans typically spend 80% of their time in their homes).

The Obama Administration initiated a large weatherization program but the budget for that got nixed by the GOP in Congress. Now is the time to move forward with this both for the sake of everyday Detroiters and the sake of the planet.

10.Build Community Solar. Unlike many cities, Detroit has lots of open space that could be used for solar energy production. DTE, our local utility, mainly produces electricity from coal, which hurts the planet and the lungs of Detroiters. And, Michigan produces none of this coal. Another way to help Detroiters reduce their utility cost is use some of the massive amount of vacant land in the city for building community solar installations. With investment from the federal government, these could be owned by Community Development Corporations or others who could sell the solar power at cost to homeowners nearby. Investing in these small-scale production facilities would produce installer jobs for Detroiters, increase reliance on alternative sources of electricity, cut costs for citizens and make appropriate use of vacant land.

Problem Solving Courts Aim to Address Substance Use and Mental Health Illnesses

In Michigan there are specific courts known as “Problem Solving Courts” that are designed to address an offender’s problem. These courts often serve as an alternative to an individual serving time in jail or prison and, typically, focus on offenders with substance use and/or mental health illnesses. The different types of Problem Solving Courts are adult and juvenile drug courts, adult and juvenile mental health courts and veteran courts. These court programs are offered at the circuit court level and the district court level. In this post we will show what Problem Solving Courts exist in each county and where.

These Problem Solving Courts are additional dockets added on to a judges’ normal caseload, and running them at the district and circuit court levels does not cost locals more, beyond the need for secure internet, according to the State Court Administrator’s Office. It is through this office that additional support and training is offered. In addition to these programs providing resources for individuals to regain sobriety and a more stable life, these courts are also viewed as a cost saving measure to communities because they keep individuals out of jail. 

In total, in 2018, there were 128 drug/sobriety treatment courts in Michigan, and about 3,000 people were discharged from one of these programs. These courts do not all follow the same model, as some only accept offenders with driving under the influence charges, and others target offenders with drug related felonies. They all, though, adhere to specific guidelines to help offenders attain long-term sobriety.

Of that 128 drug/sobriety courts in the state, 31 of them were located in Southeastern Michigan, seven at the circuit court level and 24 at the district court level. Looking further into these drug courts, there are five just focused on offenders with driving under the influence charges, and two that are solely focused on juveniles. When looking at the location of the courts, Wayne County had the most drug treatment courts in 2018 at 11 followed by Oakland County with 10.  St. Clair and Monroe counties did not have any drug treatment courts.

According to the state, 65 percent of the participants throughout Michigan successfully graduated from a drug/sobriety court and 29 percent were unsuccessfully discharged due to non-compliance, absconding or a new offense.

Mental Health Courts are another type of Problem Solving Court offered in Michigan, and in 2018 there were 33 total mental health courts. In Southeastern Michigan there were 11 different mental health courts, one of which was for juveniles in Wayne County. There were four total mental health courts in Wayne County in 2018, two in Macomb County, and one each in the five other counties in the region.

According to the state, of the 1,414 participants in the mental court program 57 percent successfully completed the program. Additional data shows that unemployment for adult participants in circuit court mental health programs decreased by more than 50 percent, and unemployment decreased by more than 66 percent for participants at the district court level. Information from the state court system also showed that graduates were half as likely to commit another crime within three years of being admitted into a mental health court program.

Veteran Treatment Courts are another type of Problem Solving Court in Michigan, and in 2018 there were 25 across the state with 596 active participants. Of the active veterans involved in the program, 71 percent successfully completed their programs in 2018.  In Southeastern Michigan there were 14 Veteran Treatment Courts with five located in Wayne County, four in Oakland County, two in Macomb County and one each in Livingston, Monroe and Washtenaw counties.

Prison Most Common Sentence for Felony Assaults

As part of the annual Michigan Department of Corrections report assaultive felony offensives are also examined to better understand what percentage of the  offenders are sentenced to either prison, jail, probation, community service or another combination. According to the data, prison sentences tended to be the most common. Monroe County had the highest percentage of felony assault offenders sentenced to prion at 39.6 percent. Wayne County had the second highest sentencing rate at 36.6 percent and Macomb County had the lowest rate at 27.5 percent.

For the jail category, St. Clair County had the highest sentencing rate for felony assault offenders at 38.8 percent; this was 10 percent higher than those in St. Clair County who were sentenced to prison for felony assault charges. Oakland County had the second highest at 23.3 percent. Wayne County had the lowest percentage of felony assault offenders sentenced to jail at 6 percent; the county with the second lowest sentencing rate was Monroe County at 11.7 percent.  

For a sentencing combination of jail and probation, Monroe County had the highest sentencing rate for felony assault offenders at 48.1 percent; Livingston County had the second highest rate at 44 percent. Wayne County was the only county in the region to have a jail and probation combination sentencing rate below 20 percent. According to the data, 15.1 percent of felony assault offenders in Wayne County were sentenced to a jail/probation combination.

Livingston, Monroe, Oakland and St. Clair counties all sentenced less than 5 percent of felony assault offenders to probation, with Monroe County having the lowest sentencing rate at 0.6 percent. Conversely, Wayne County had the highest probation sentencing rate at 42.3 percent, a trend we’ve seen throughout this series. Wayne County’s probation sentencing rate was nearly 20 percentage points higher than the county with the second highest rate (Washtenaw County had a rate at 24 percent).

No county in the region sentenced more than 2 percent of the felony assault offender population to community service, restitution, fines and/or costs.

Prison appears to be the most common sentencing type for felony assault offenders, except for Wayne County where nearly half the felony assault offender population was sentenced to probation.  

Jail, Probation Combination Most Common Sentence for Felony Drug Offenders

When examining only felony drug offenders as part of the 2017 Michigan Department of Corrections annual report, St. Clair County had highest percentage of individuals who were sentenced to prison at 19.5 percent. Monroe and Oakland counties were the only other two counties regionally to have more than 10 percent of felony drug offenders sentenced to prison in 2017. Monroe County had 13 percent of felony drug offenders sentenced to prison and Oakland County had 12 percent. Macomb County had the lowest percentage of felony drug offenders sentenced to prison at 3.6 percent. In Wayne County 5.7 percent of felony drug offenders were sentenced to prison.

For the jail category, St. Clair County again had the highest sentencing rate for felony drug offenders at 40.1 percent, with Washtenaw County having the second highest at 31.4 percent. Macomb and Oakland counties also had more than 20 percent of felony drug offenders sentenced to jail in 2017. Wayne County had the lowest percentage of offenders sentenced to jail at 14.6 percent. For the jail/probation category Wayne County also had the lowest percentage of felony drug offenders sentenced at 16 percent; Washtenaw County had the second lowest percentage of offenders sentenced at 31.4 percent. In contrast, Monroe County had the highest percentage of felony drug offenders sentenced to jail/probation at 71.9 percent.

Remaining in line with trends we’ve seen from Wayne County thus far in this series, of the felony drug offenders in Wayne County in 2017, 63.5 percent were sentenced to probation. Of all the sentencing options, this was clearly the most highly utilized for felony drug offenders in 2017. Macomb and Washtenaw counties both had 31 percent of its felony drug offenders sentenced to probation in 2017, nearly half of the percentage sentenced in Wayne County. Monroe County had the lowest percentage of felony drug offenders sentenced at 2 percent.

None of the counties in the region sentenced 1 percent or more of the felony drug offender population to community service, restitution, fines and costs.

As the data shows, jail/probation sentences tended to be the most common for felony drug offenders in Southeastern Michigan, with the exception of Wayne County, where just probation was the most common.

Southeastern Michigan Experiences Decrease in Felony Offenders

Last week’s blog focused on what sentencing types felony offenders received in 2016 for the Southeastern Michigan region. That information is valuable in understanding if one sentencing type, such as prison, jail or probation, is more common than other regionally and from county-to-county. This, week the data digs further to see if there is any type of trend in sentencing types at the state level and at the county level in Southeastern Michigan. Additionally, the data in this post shows the sheer number of felony offenders who were sentenced in total and to prison or jail between 2012 and 2016. One important note is that those sentenced to prison are sentenced to spend more than a year in jail/prison.

In the first chart below, the data shows there has been a decrease in the number of people charged as felony offenders and sentenced to anything ranging from prison to jail to probation, or even community service. In 2012 there were 49,201 felony criminal offenders and by 2016 that number decreased to 47,347. This is a trend similar throughout Southeastern Michigan, with Wayne County having the highest number of felony criminal offenders and also the largest difference of those being sentenced between 2012 and 2016. In 2012 there were 10,103 felony criminal offenders in Wayne County and in 2016 that number decreased to 9,315. Of the seven counties in the region, Monroe County was the only one to experience an increase in the number of criminal felony offenders between 2012 and 2016. In 2012 there were 631 felony offenders sentenced and in 2016 that number increased to 744. Livingston County has had the lowest number of criminal felony offenders sentenced each year between 2012 and 2016 in the region.

Although there has been a gradual decrease in the number of felony criminal offenders sentenced to prison in Southeastern Michigan between 2012 and 2016 the percentage sentenced to prison has not followed that exact pattern. At the state level, there were 10,732 felony criminal offenders sentenced to prison in 2012, and by 2016 that number decreased to 9,648. On a percentage basis, 21.4 percent of the felony criminal offenders were sentenced to prison in 2012 and in 2016 that number was 20.4. Regionally, Livingston and Monroe counties had the highest percentage of felony criminal offenders sentenced to prison between 2012 and 2016, but by the numbers Wayne County had the highest number of offenders sentenced to prison (2,329 and 1,867, respectively). In 2012, 25.3 percent of felony criminal offenders were sentenced to prison in Livingston County and for Monroe County that number was 24.1 percent. Respectively, those numbers decreased to 24.5 percent for Livingston County and increased to 26.5 percent for Monroe County.

As noted above, Wayne County had highest percentage of felony criminal offenders sentenced to prison between 2012 and 2016, but in terms of the percentage sentenced to prison as opposed to other sentencing options, Wayne County has consistently remained in the middle of all seven counties in the region and has experienced an overall decrease in the percentage sentenced from 23.1 percent in 2012 to 20 percent in 2016. Overall, Macomb County has consistency had the lowest percentage of felony criminal offenders sentenced to prison, with the exception of 2015. Macomb County has also experienced a decrease in the percentage and number of felony criminal offenders sentenced to prison. In 2012, there were 710 felony criminal offenders sentenced to prison in Macomb County, which made up 16.5 percent of felony criminal offenders sentenced that year. In 2016 the number of felony criminal offenders sentenced to prison decreased to 572, and the percentage decreased to 13.9 percent.

The chart below shows the number of felony criminal offenders sentenced to jail throughout Southeastern Michigan. In 2012 Oakland County there were 1,059 felony criminal offenders sentenced to jail, and in 2016 there were 1,367 felony criminal offenders sentenced to jail. For Wayne County, there were 887 felony criminal offenders sentenced to jail in 2012 ,and in 2016 there were 767 sentenced.

These numbers for Wayne County reflect where the county lies amongst the other counties in the region in terms of the percentage of felony criminal offenders sentenced to jail between 2012 and 2016. As the second chart below shows, with the exception of 2014, Wayne County has the had the lowest percentage of felony criminal offenders sentenced to jail regionally between 2012 and 2016. In 2012 11.4 percent of criminal offenders were sentenced to jail in Wayne County in 2016 that number was 8.2 percent. On the opposite side of the spectrum, St. Clair County has consistently had the highest percentage of felony criminal offenders sentenced to jail out of all seven counties in the region; its number have also been above the state’s number as well. In 2012, 36 percent of felony criminal offenders in St. Clair County were sentenced to jail and in 2016 that number increased to 40.5 percent. Even though the percentage of felony criminal offenders sentenced to jail in St. Clair County is increasing, the total number of offenders sentenced to jail decreased from 908 in 2012 to 840 in 2016.

The above charts focus on the number and percentage of individuals sentenced to prison and jail in Southeastern Michigan, showing that, in general, there has been a decrease in those two sentencing options

Below, the chart shows the percentage of felony criminal offenders sentenced to probation. Oakland and St. Clair counties experienced the largest decrease in the percentage of felony criminal offenders sentenced to probation. In 2012, 7.6 percent of felony criminal offenders were sentenced to probation in St. Clair County and 6 percent of the offenders in Oakland County were sentenced to probation that same year. In 2016 that number decreased to 4.2 percent for St. Clair County and 5.1 percent for Oakland County. Oakland County has experienced an increase in the percentage of felony criminal offenders sentenced to jail between 2012 and 2016 and St. Clair County has experienced an increase in the percentage of felony criminal offenders sentenced to jail and prison in between 2012 and 2016.

Washtenaw and Wayne counties have experienced the largest increase in the percentage of felony criminal offenders sentenced to probation between 2012 and 2016. In 2012, 29.3 percent of felony criminal offenders were sentenced to probation in Washtenaw County and 52.1 percent were sentenced to probation in Wayne County. By 2016 that number increased to 34.1 percent for Washtenaw County and 56.7 percent for Wayne County. The percentage of individuals sentenced to probation for Wayne County has consistently been the highest in the region.

Overall, this post shows that there has been an overall decrease in the number of felony criminal offenders between 2012 and 2016, and with that a decrease in the number of such offenders sentenced to prison. The percentage of individuals sentenced to prison in Southeastern Michigan has generally decreased as well, with the exception of counties such as St. Clair and Monroe.

Oakland County experienced one of the highest percentage increases in the number of felony offenders sentenced to jail; the number increased too. As these numbers and percentages sentenced to prison increase, they decrease for the number of felony criminal offenders sentenced to probation.

Counties such as Wayne, Washtenaw, and even Macomb, have been using probation more as a sentencing option since 2012 (Wayne is in the upper 50%). By contrast, Monroe and St. Clair use probation for small proportions of offenders–less than 10 percent.   Clearly, the type of sentencing a felony criminal offender receives varies substantially across counties. There could be many reasons for this. It is possible decisions might be related to cost of sentencing an individual to jail or prison and the number of offenders already being housed in a jail or prison. For example, Macomb and Wayne counties have well publicized overcrowding issues at their jails, and Wayne County also has budget issues. This could help explain the trend toward increased probation and decreased jail.


Wayne County Has Highest Percentage of Criminal Offenders on Probation


The Michigan Department of Corrections releases a report annually that details, among other information, the percentage in which felony offenders are sentenced to prison, jail, jail and probation, probation and other (community service, restitution fines and costs) for all offenses, drug offenses and assaultive offenses. The post highlights those breakdowns by county in the seven county region.

When examining the overall breakdown between the five categories above, Monroe County had highest percentage of felony offenders sentenced to prison over any other sentence type. In 2016, 26.5 percent of the felony offenders in Monroe County were sentenced to prison. Livingston County was the only other county in the region where more than 20 percent of felony offenders were sentenced to prison; this number was 24.5 percent. Macomb County had the lowest percentage of felony offenders sentenced to prison at about 14 percent. The largest difference between prison and jail is the length of stay for an offender; traditionally if an offender is sentenced to serve time for longer than a year they are sentenced to prison.

In the jail category for all criminal felony offenders, St. Clair County had the highest percentage of offenders sentenced to only jail at 40.5 percent. Oakland County had the second highest percentage of felony offenders sentenced to only jail time at about 28 percent. Wayne County had the lowest percentage at 8.2 percent. Wayne County also had the lowest percentage of felony offenders sentenced to jail and probation at 14.9 percent. For the jail/probation sentencing category, Monroe County had the highest percentage of felony offenders sentenced to that category at 60.5 percent. Overall, the jail/probation category had the highest percentage of sentencing for all felony criminal offenses in the region, with the exception of Wayne County. According to the data, in Wayne County in 2016 56.7 percent of criminal felony offenders were sentenced to probation; the county with the second highest probation sentencing rate was Washtenaw County 34. 1 percent. Livingston County had the lowest probation rate at 7.6 percent.

The maps below portray for those sentenced for drug offenses the percent of the correctional population in different settings.


When examining only felony drug offenders, St. Clair County had highest percentage of individuals who were sentenced to prison at 16.8 percent. Monroe County had 16.7 percent of its felony drug offenders sentenced to prison. Washtenaw County had the lowest percentage of felony drug offenders sentenced to prison at 4 percent.

For the jail, jail/probation and probation sentencing categories St. Clair County also had the highest percentage of felony drug offenders sentenced to jail at about 44 percent. The county that had the second highest percentage of felony drug offenders sentenced to jail was Oakland County at 33.6 percent. Monroe County had the lowest percentage of felony drug offenders to jail at 11.9 percent and the highest percentage of offenders sentenced to jail and probation at 68.7 percent. Wayne County had the lowest percentage of felony drug offenders sentenced to jail and probation at 15.2 percent but had the highest percentage of offenders sentenced to only probation at 66.5 percent. That sentencing category had the greatest difference between the highest percentage of offenders sentenced to probation and the lowest percentage sentenced. While Wayne County had 66.5 percent of offenders sentenced to probation, only 2.4 percent of felony drug offenders were sentenced to probation in 2016 in Monroe County.

When examining the percentage of felony criminal offenders sentenced for assaultive offenses in 2016, the range in the percentage of individuals sentenced to prison was the narrowest amongst all seven counties. Monroe County had the highest percentage of felony criminal offenders sentenced for assaultive offenses at 41 percent while Oakland County had the lowest percentage at 31.6 percent. The range for those sentenced to jail was a bit wider, with St. Clair County having the highest percentage of felony assault offenders sentenced to jail 35.5 percent. Wayne County had the lowest percentage of felony assault offenders sentenced to jail at 5.2 percent. For the jail/probation sentencing category Monroe County had the highest percentage of offenders sentenced at 48.5 percent and Wayne County had the lowest percentage sentenced at 14.1 percent. While Wayne County had the lowest percentage of felony assault offenders sentenced to jail and jail/probation it had the highest percentage of offenders sentenced to just probation at 41.9 percent. See maps below.

One of the main takeaways from this post is that Wayne County regularly has the highest percentage of offenders sentenced to only probation and the lowest percentage sentenced to any length of a jail stay. The reason for this could be because probation is traditionally less expensive for a government entity than sentencing someone to jail. Capacity issues at county jails could also play a role in this decision. Next week, we will examine how the numbers of offenders in each county in Southeastern Michigan has changed over the years, a set of data that could further support the observations above.

By the Numbers: Detroit Burglaries by Neighborhood

Five neighborhoods in Detroit had 150 burglaries ore more in 2017, according to public crime data from the City of Detroit. Warrendale, Regent Park, Franklin Park, Bagley, Cornerstone Village and Brightmoor were these neighborhoods. Warrendale, Franklin Park and Brightmoor are located on the west side of the City while Bagley is closer to the Palmer Park area. Regent Park and Cornerstone Village are on the east side.

By the Numbers:

  • Warrendale: 255
  • Regent Park: 209
  • Franklin Park: 157
  • Bagely: 155
  • Cornerstone Village: 153
  • Brightmoor: 150

**The reported burglaries and the associated geocoding for the maps below are from the City of Detroit’s public open data portal.

In total, there were 8,299 reported burglaries in 2017.

While these five neighborhoods stand out on the map below, what also stands out is the number of neighborhoods with 51 or fewer burglaries in 2017. In total, there were 83 different neighborhoods in the City with 51 or fewer burglaries in 2017. The neighborhoods are primarily located in the central portion of the City, which includes the Downtown and Midtown areas, up through New Center and into the Palmer Park area. There were 13 neighborhoods in the City in 2017 with less than 10 reported burglaries.

By the Numbers:

  • Delray: 9
  • Boston Edison: 8
  • Brewster Homes: 8
  • Greenfield Park: 6
  • Joseph Berry Sub: 6
  • Palmer Woods: 6
  • Cultural Center: 5
  • Green Acres: 5
  • Henry Ford: 5
  • Hubbard Richard: 4
  • Wildemere Park: 4
  • Jeffries: 2
  • Conner Creek Industrial: 1

The map below shows the burglaries discussed above, but by Census Tract rather than neighborhood. The same message is conveyed, yet we are able to see even more closely where the burglaries in the neighborhoods are concentrated.

Detroit Tops List of Regional Crime Rates

The Federal Bureau of Investigation recently released data on known criminal offenses for the year 2015. For this post, these criminal offenses have been turned into rates per 10,000 residents to accurately show how reported crimes differ between the some of the most well known cities in each county in Southeastern Michigan.

The cities featured in this post are

  • Ann Arbor: Washtenaw County
  • Detroit: Wayne County
  • Howell: Livingston County
  • Monroe: Monroe County
  • Pontiac: Oakland County
  • Port Huron: St. Clair County
  • Warren: Macomb County

Of the nine crimes featured, Detroit had the highest rate of the seven featured cities for all but one. Conversely, of the nine featured crimes, Howell had the lowest rates for six of them.

Overall, property crimes had the overall highest rates of the crimes discussed in this post while murder and nonnegligent manslaughter had the lowest. Property crime rates also had the largest difference between the city with the highest rate (Detroit) and the city with the lowest rate (Howell).

slide03

According to the FBI, Detroit had the highest murder rate in 2015 of the seven cities examined in this post. This rate was calculated to be 4.4 per 10,000 residents; this was equivalent to 295 murders for a population of about 673,000. Howell, Monroe and Ann Arbor had zero reported murders while Port Huron had a rate of .7 and Pontiac and Warren had rates of .1

slide05

According to the FBI forcible rape is defined as “the carnal knowledge of a female forcibly and against her will.  Attempts or assaults to commit rape by force or threat of force are also included; however, statutory rape (without force) and other sex offenses are excluded.”

In 2015, of the cities highlighted in this post, Pontiac had the highest reported rape rate per 10,000 residents at 11.5; this was equivalent 69 reported rapes to law enforcement for a population of about 60,000. Ann Arbor had the lowest rate at 4.9, which was equivalent to 58 total rapes known to law enforcement. Detroit’s forcible rape rate per 10,000 residents was 7.8 in 2015, or 530 total rapes known to law enforcement.

slide07

According to the FBI robbery is defined as “the taking or attempting to take anything of value from the care, custody, or control of a person or persons by force or threat of force or violence and/or by putting the victim in fear.”

Of the featured cities, Detroit had the highest robbery rate per 10,000 at 51 and Ann Arbor had the second highest at 35. In total, Detroit had 3,457 reported robberies while Ann Arbor had 42. Howell had the lowest rate at 2 with two reported robberies.

slide09

According to the FBI, aggravated assault is defined as “an unlawful attack by one person upon another for the purpose of inflicting severe or aggravated bodily injury.”

In 2015 Detroit had the highest aggravated assault rate of the cities featured in this post. Detroit’s 2015 rate was about 112.5 per 10,000 residents, and Pontiac had the second highest rate at 90.5. Ann Arbor had the lowest aggravated assault rate of the seven cities featured at 10.8.

slide11

According to the FBI, property crime “includes the offenses of burglary, larceny-theft, motor vehicle theft, and arson.  The object of the theft-type offenses is the taking of money or property, but there is no force or threat of force against the victims.”

Detroit had the highest property crime rate of the seven cities featured at 409 per 10,000 residents. The city with the second highest property crime rate was Pontiac at 258 per 10,000. Howell had the lowest rate of the featured cities at 152.7. There was a 257 point difference between Howell and Detroit, making this the largest rate difference of the featured cities.

slide13

According to the FBI burglary is defined as, “the unlawful entry of a structure to commit a felony or theft.  To classify an offense as a burglary, the use of force to gain entry need not have occurred.”

Similar to the property crime rate standings, Detroit and Pontiac had the highest rates of the featured cities. Detroit’s property crime rate per 10,000 residents in 2015 was 116 while Pontiac’s was 93. Howell again had the lowest rate of the cities at 12.5 with Ann Arbor coming in just above it at 23.1.

slide15


According to the FBI, larceny theft is defined as “the unlawful taking, carrying, leading, or riding away of property from the possession or constructive possession of another.”

Detroit had the highest larceny-theft rates of the featured cities in 2015 at 215.7 and Monroe had the second highest rate at 185. Monroe’s rate was equivalent to 373 reported crimes for a population of 20,074 while Detroit’s rate was equivalent to 14,523 reported crimes for a population of about 673,000. Howell again had the lowest rate at 132.9; this was equivalent to 128 reported crimes for a population about about 9,600.

slide17

According to the FBI, motor vehicle theft is defined as “the theft or attempted theft of a motor vehicle.”

The highest motor vehicle theft rate of the featured cities was 77 per 10,000 residents for the city of Detroit. This rate was equivalent to 5,216 motor vehicle thefts for a population about 623,000. The city with the second highest motor vehicle theft rate was Warren with a rate of about 39. In 2015 Warren had 521 reported motor vehicle thefts for a population of about 135,000. Ann Arbor had the lowest motor vehicle theft rate of 6 per 10,000 residents in 2015 of the feature cities.

slide19

According to the FBI, arson is “any willful or malicious burning or attempting to burn, with or without intent to defraud, a dwelling house, public building, motor vehicle or aircraft, personal property of another, etc.”

Ann Arbor had five reported arsons in 2015, giving it the lowest rate at .5, while Detroit had 842 reported arsons for a rate of 12.5. Port Huron had the second highest rate at 5.2 with 12 reported arsons.

Southeastern Michigan’s Firearm Deaths Ruled Suicide Surpass those Ruled Homicide, Accidental

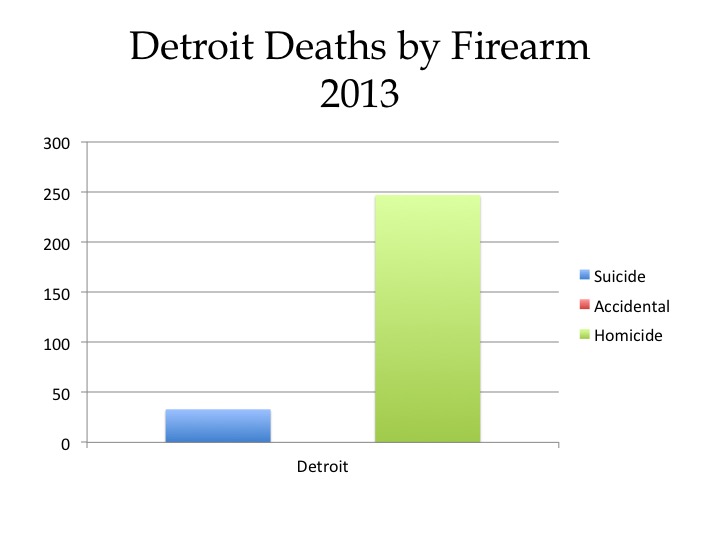
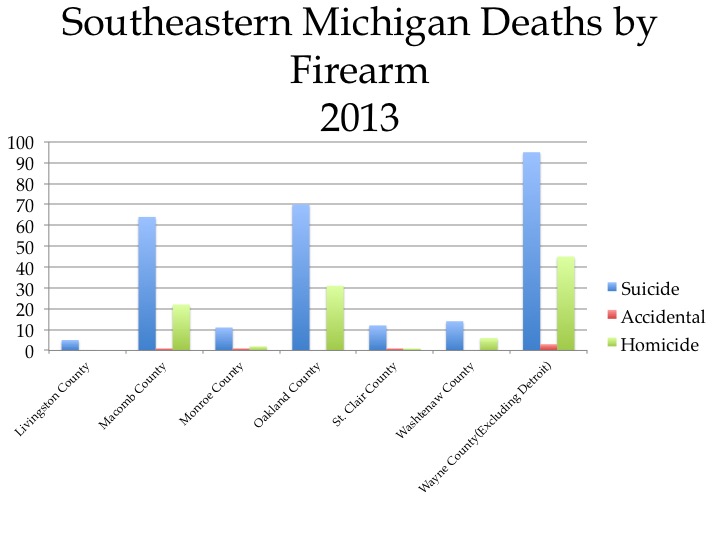
In Detroit, homicides by firearm far outpace suicide, according to the Michigan Department of Health and Human Services 2013 data. Outside Detroit in each of the seven counties in the region, the reverse holds. Suicide by firearm far exceeds homicide by firearm. Accidental deaths by firearm in Southeastern Michigan in 2013 were far lower than either other category. Wayne County, excluding the city of Detroit, had the largest difference between firearm deaths ruled suicide and firearm deaths ruled homicide; there were 50 more firearm deaths ruled homicide. Macomb County had the second largest difference at 42 and Oakland County’s difference was 39.

In Detroit there were 214 more firearm deaths ruled homicide than suicide.

Firearm deaths ruled accidental was the category with the lowest numbers across the region. Wayne County had the highest number of accidental deaths at three while Livingston, Oakland and Washtenaw counties, along with the city of Detroit, had zero.

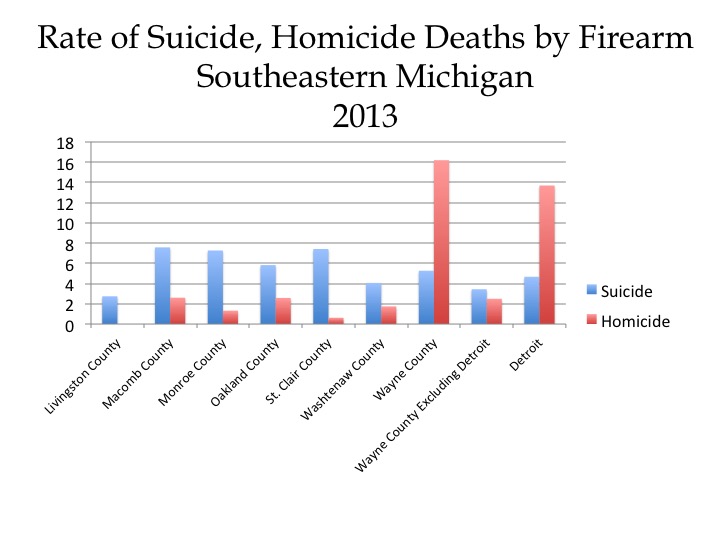
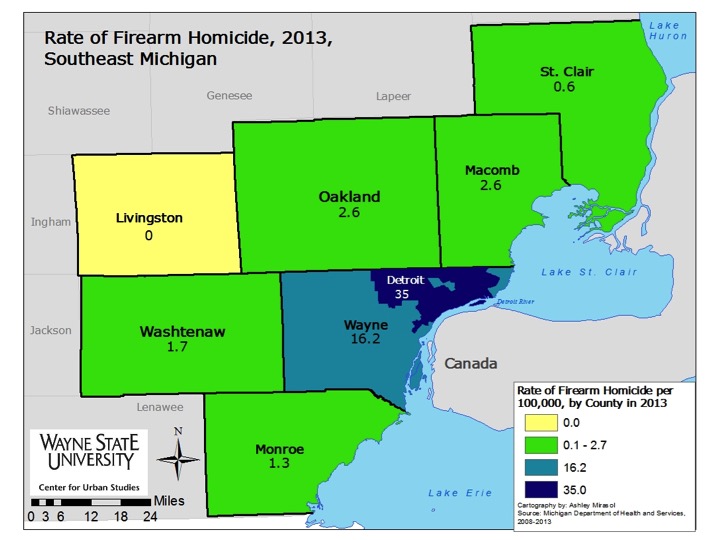
When looking at the rate of suicide and homicide deaths by firearm per 100,000 residents we see that suicide had a higher rate in all counties but Wayne in 2013. However, when the number of Detroit suicide and homicide deaths are removed from Wayne County it was in line with its peers in that its rate of suicide death by firearm was higher than its rate of homicide by firearm. At the county level, Macomb County had the highest rate of suicide by firearm at 7.6 and Livingston County had the lowest at 2.7. When not including the Wayne County rate of homicide by firearm with Detroit numbers included, Oakland County had the highest rate of homicide by firearm per 100,000 residents in 2013 at 2.5.

Detroit’s rate of homicide by firearm per 100,000 residents was higher than its suicide rate by firearm though in 2013; the rate of homicide by firearm was 13.6 while the suicide rate by firearm was 4.7.


Slide3

Southeastern Michigan Firearm Deaths

Rate of Suicide by Forearm

2013 Firearm Homicides

In Detroit, homicides by firearm far outpace suicide, according to the Michigan Department of Health and Human Services 2013 data. Outside Detroit in each of the seven counties in the region, the reverse holds. Suicide by firearm far exceeds homicide by firearm. Accidental deaths by firearm in Southeastern Michigan in 2013 were far lower than either other category. Wayne County, excluding the city of Detroit, had the largest difference between firearm deaths ruled suicide and firearm deaths ruled homicide; there were 50 more firearm deaths ruled homicide. Macomb County had the second largest difference at 42 and Oakland County’s difference was 39.

In Detroit there were 214 more firearm deaths ruled homicide than suicide.

Firearm deaths ruled accidental was the category with the lowest numbers across the region. Wayne County had the highest number of accidental deaths at three while Livingston, Oakland and Washtenaw counties, along with the city of Detroit, had zero.

When looking at the rate of suicide and homicide deaths by firearm per 100,000 residents we see that suicide had a higher rate in all counties but Wayne in 2013. However, when the number of Detroit suicide and homicide deaths are removed from Wayne County it was in line with its peers in that its rate of suicide death by firearm was higher than its rate of homicide by firearm. At the county level, Macomb County had the highest rate of suicide by firearm at 7.6 and Livingston County had the lowest at 2.7. When not including the Wayne County rate of homicide by firearm with Detroit numbers included, Oakland County had the highest rate of homicide by firearm per 100,000 residents in 2013 at 2.5.

Detroit’s rate of homicide by firearm per 100,000 residents was higher than its suicide rate by firearm though in 2013; the rate of homicide by firearm was 13.6 while the suicide rate by firearm was 4.7.

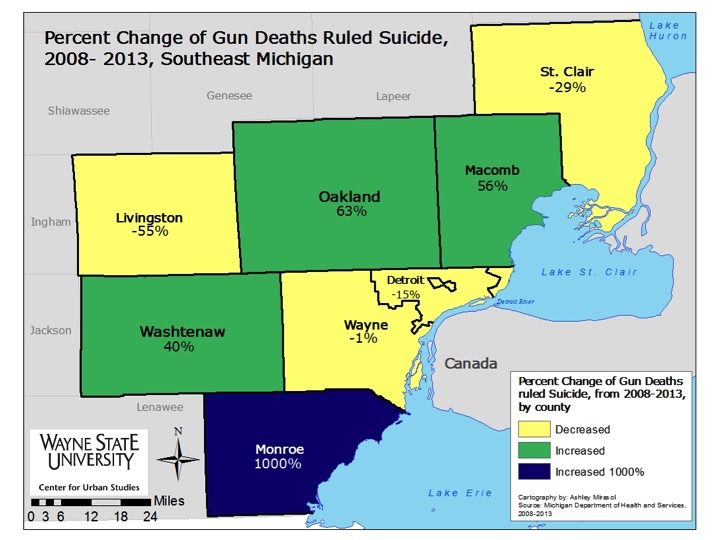
There were four counties with an increase in the percentage of firearm deaths ruled suicide between 2008 and 2013. Monroe County had the largest increase at 1,000 percent, which is representative of an increase of 10 firearm deaths ruled suicide. In 2008 there was one suicide in Monroe County and in 2013 there were 11. The other three counties were Washtenaw, Oakland and Macomb. In terms of sheer numbers, Oakland County had the largest increase of firearm deaths ruled suicide between 2008 and 2013 at 27.

Livingston County had the largest percentage decrease of firearm deaths ruled suicide between 2008 and 2013 at 55 percent. In 2008 in Livingston County there were 11 firearm deaths ruled suicide and in 2013 there were 5.

Change of Gun deaths