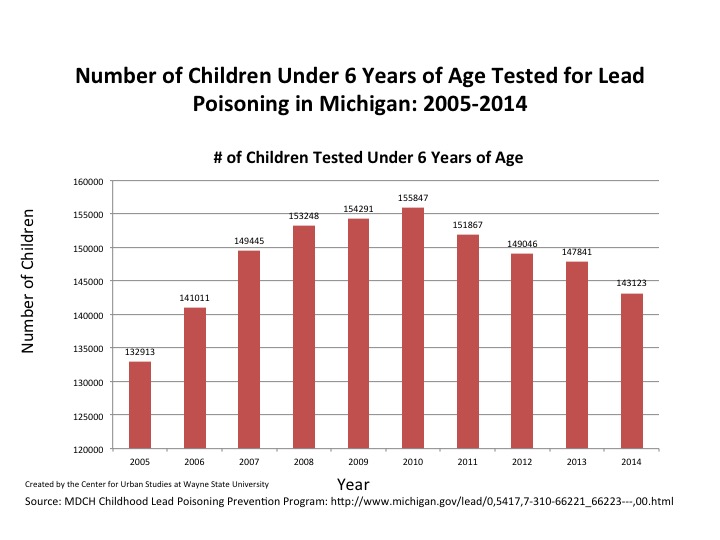
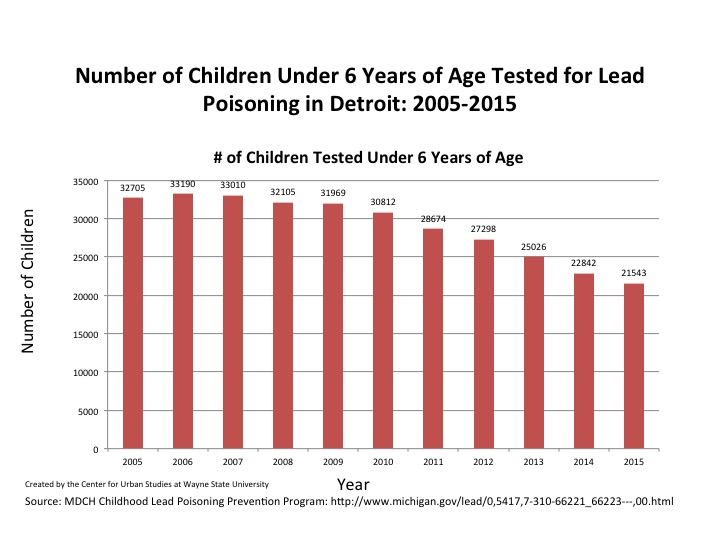
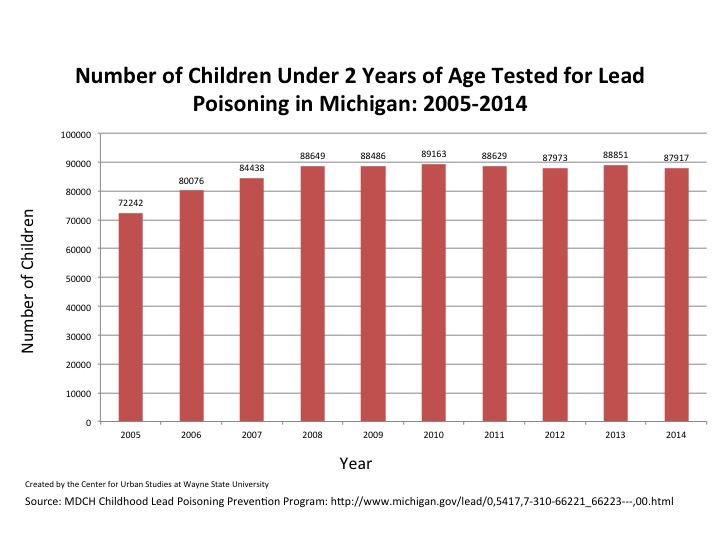
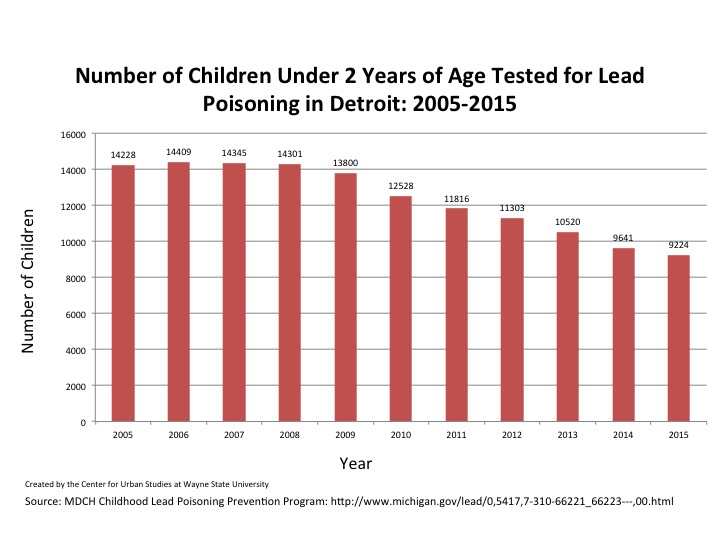
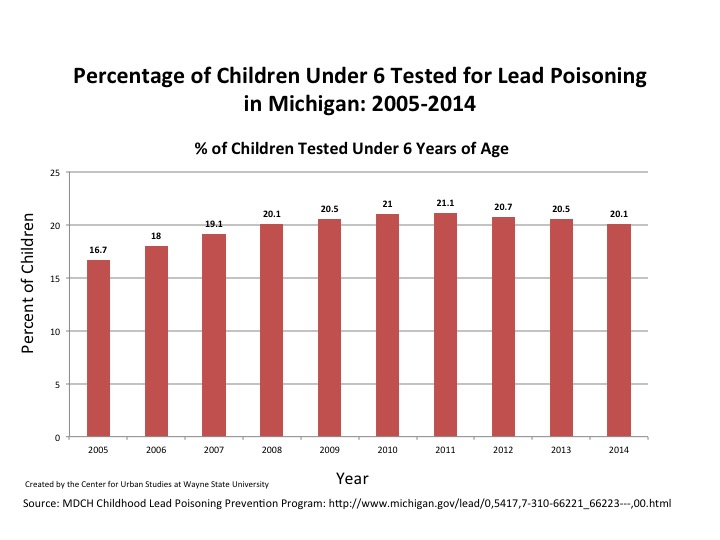
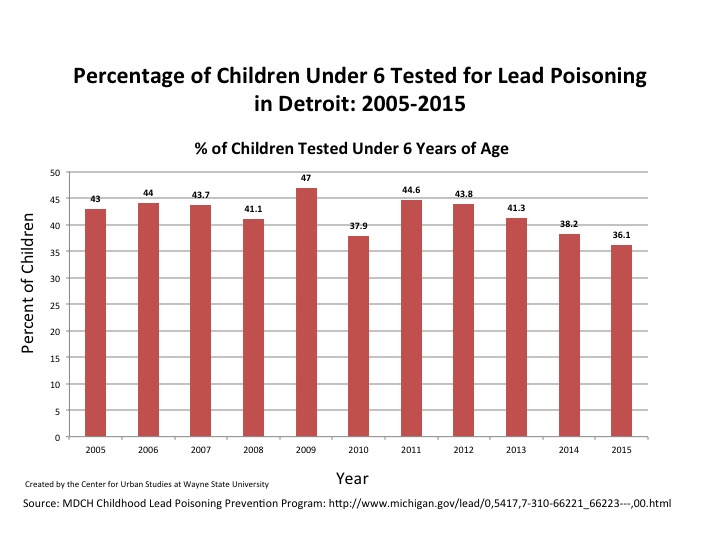
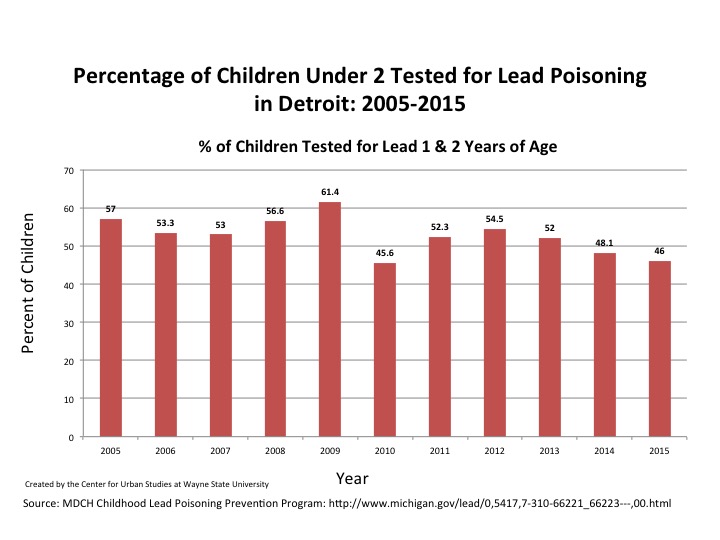
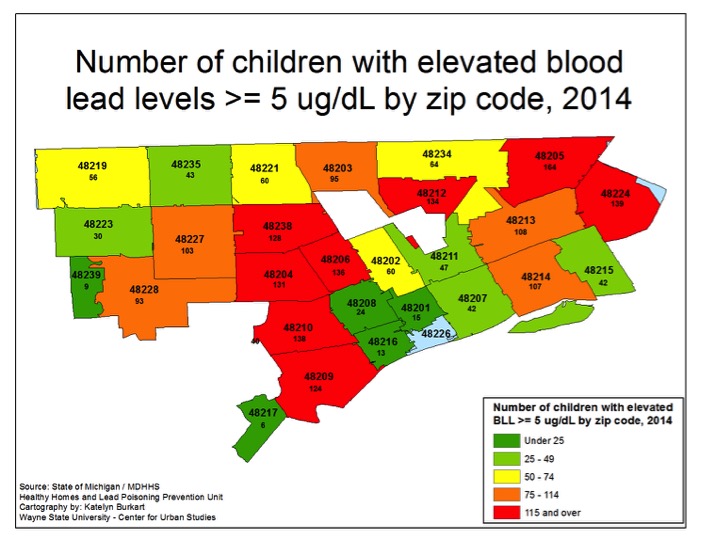
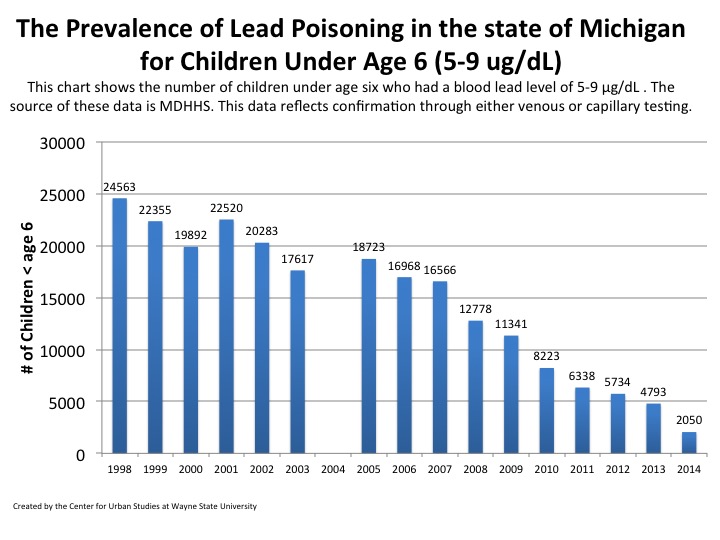
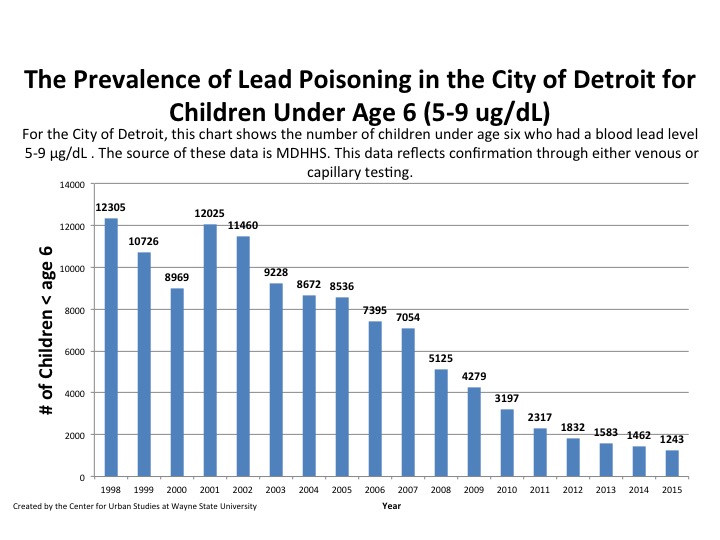
The total number of children with lead poisoning in the state of Michigan and in the city of Detroit under the age of 6 has experience an overall decrease since 1998, according to the Michigan Department of Health and Human Services. In 2014, according to the data, there were 2,050 children under the age of 6 with blood lead levels between 5-9 ug/dL, a significant drop from the previous year’s number of 4,793 . Of the number children under the age of 6 with blood lead levels between 5-9 ug/dL in the state of Michigan in 2014, 71 percent (1,462 children) were from the city of Detroit, according to the data (2015 data for the state of Michigan is not yet available). Some preliminary data from State for Detroit is shown in the charts below, but it is preliminary and not discussed above.
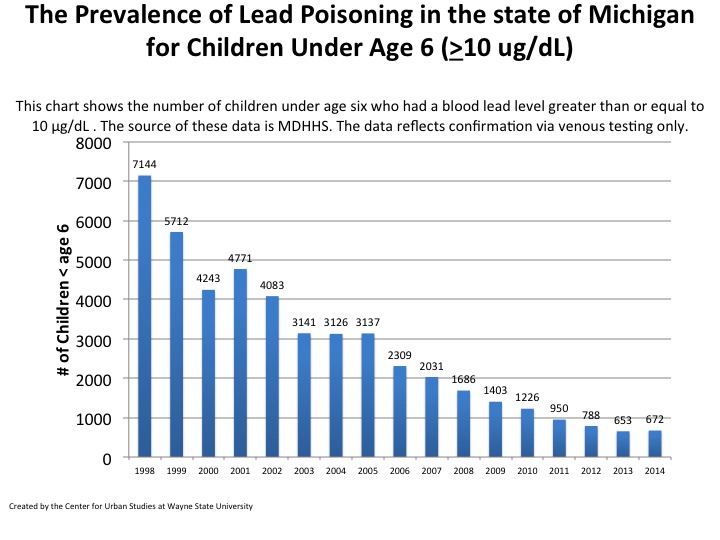
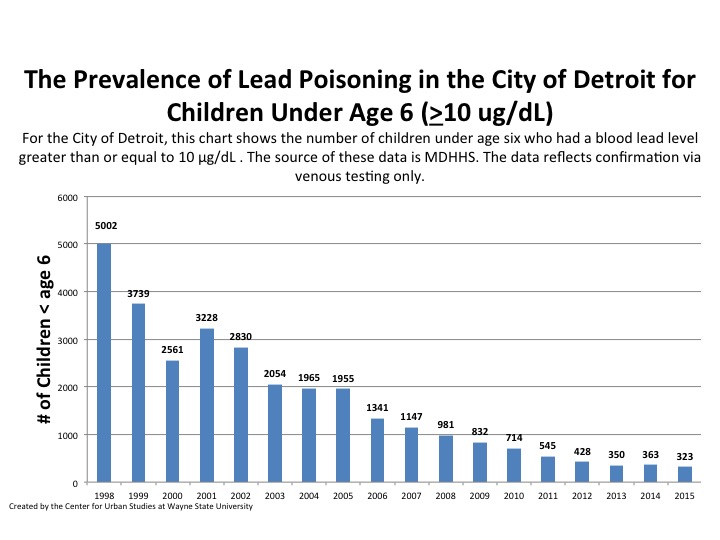
Also in 2014 there were 672 children in the state of Michigan with blood lead levels above 10 ug/dL; this was an increase of 19 from the previous year. Of the 672 children, 54 percent (323 children) of those children under the age of 6 with blood lead levels above 10 ug/dL were from the city of Detroit. Of the data provided, in 1998 the state had the highest number of children with blood lead levels between 5-9 ug/dL at 24,563; this also holds true for children under the age of 6 with blood lead levels above 10 ug/dL. In 1998 there were 7,144 children under the age of 6 with lead levels above 10 ug/dL. At the Detroit level, 1998 also had the highest number of children with blood lead levels between 5-9 ug/dL and above 10 ug/dL. There were 12,305 children under the age of 6 with blood lead levels between 5-9 ug/dL in the city of Detroit in 1998; this was 50 percent of the children state wide. Also in 1998, there were 5,002 children from Detroit under the age of 6 with blood lead levels above 10 ug/dL; the number of Detroit children who tested at the level made up 70 percent of the state total for children under the age of 6 with blood lead levels above 10 ug/dL.
While the number of children under the age of 6 with blood lead levels between 5-9 ug/dL decreased between 1998 and 2014 for the state and the city of Detroit, the percentage of the children from Detroit who made up the state total has increased (50% to 71%). The number of children under the age of 6 with blood lead levels above 10 ug/dL also decreased between 1998 and 2014 in the state and the city of Detroit, as did the percentage of Detroit children who made up the state total.
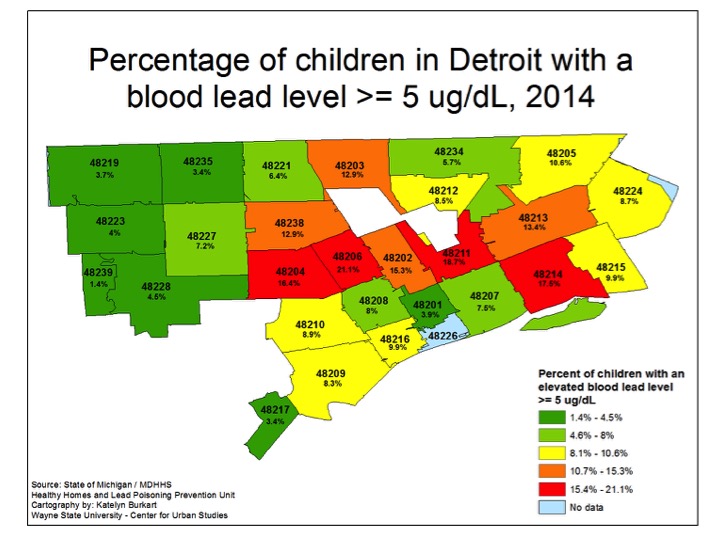
According to the Centers for Disease Control, 5 ug/dL is used a reference level by experts “to identify children with blood lead levels that are much higher than most children’s levels.” The CDC has recommended that public health actions be initiated in children under age 6 with blood lead levels above 5 micrograms per deciliter (µg/dL).1 Babies and young children can be more highly exposed to lead because they often put their hands and other objects that can have lead from dust or soil on them into their mouths.
The total number of children with lead poisoning in the state of Michigan and in the city of Detroit under the age of 6 has experience an overall decrease since 1998, according to the Michigan Department of Health and Human Services. In 2014, according to the data, there were 2,050 children under the age of 6 with blood lead levels between 5-9 ug/dL, a significant drop from the previous year’s number of 4,793 . Of the number children under the age of 6 with blood lead levels between 5-9 ug/dL in the state of Michigan in 2014, 71 percent (1,462 children) were from the city of Detroit, according to the data (2015 data for the state of Michigan is not yet available). Some preliminary data from State for Detroit is shown in the charts below, but it is preliminary and not discussed above.
Also in 2014 there were 672 children in the state of Michigan with blood lead levels above 10 ug/dL; this was an increase of 19 from the previous year. Of the 672 children, 54 percent (323 children) of those children under the age of 6 with blood lead levels above 10 ug/dL were from the city of Detroit. Of the data provided, in 1998 the state had the highest number of children with blood lead levels between 5-9 ug/dL at 24,563; this also holds true for children under the age of 6 with blood lead levels above 10 ug/dL. In 1998 there were 7,144 children under the age of 6 with lead levels above 10 ug/dL. At the Detroit level, 1998 also had the highest number of children with blood lead levels between 5-9 ug/dL and above 10 ug/dL. There were 12,305 children under the age of 6 with blood lead levels between 5-9 ug/dL in the city of Detroit in 1998; this was 50 percent of the children state wide. Also in 1998, there were 5,002 children from Detroit under the age of 6 with blood lead levels above 10 ug/dL; the number of Detroit children who tested at the level made up 70 percent of the state total for children under the age of 6 with blood lead levels above 10 ug/dL.
While the number of children under the age of 6 with blood lead levels between 5-9 ug/dL decreased between 1998 and 2014 for the state and the city of Detroit, the percentage of the children from Detroit who made up the state total has increased (50% to 71%). The number of children under the age of 6 with blood lead levels above 10 ug/dL also decreased between 1998 and 2014 in the state and the city of Detroit, as did the percentage of Detroit children who made up the state total.
According to the Centers for Disease Control, 5 ug/dL is used a reference level by experts “to identify children with blood lead levels that are much higher than most children’s levels.” The CDC has recommended that public health actions be initiated in children under age 6 with blood lead levels above 5 micrograms per deciliter (µg/dL).1 Babies and young children can be more highly exposed to lead because they often put their hands and other objects that can have lead from dust or soil on them into their mouths.