Washtenaw County Sees Highest Percentage on In-State Population Influx

In 2016, Washtenaw County had the highest percentage of residents move into its boundaries in Southeastern Michigan, according to Census data. According to the data, 5.7 percent of the Washtenaw County population (or 20,213 people) was made up of residents who moved there from other counties in the State of Michigan in 2016. The large share of Washtenaw County residents that attend the University of Michigan from other counties in the state may help account for this result.

On the opposite end of the spectrum, Wayne County had the lowest percentage of Michigan residents moving into the county from elsewhere in the state in 2016. According to the data, 1.9 percent of Wayne County’s population was made up of people who moved there from elsewhere in the State of Michigan. But, despite Wayne County having the lowest percentage of residents from elsewhere in Michigan move into its boundaries, it had the second highest overall number of people moving there. In total, there was an estimated 33,148 people who moved to Wayne County in 2016 from other areas in Michigan.

Oakland County was the only county in the region with a higher number of Michiganders who moved inside its boundaries in 2016. According to the Census data, there were 42,748 people from Michigan, outside of Oakland County, who moved to Oakland County in 2016. This number made up 3.5 percent of the Oakland County population.

In terms of sheer volume, Monroe County had lowest number of people move there from elsewhere in the state at 4,004 people; this was equivalent to 2.7 percent of its population.

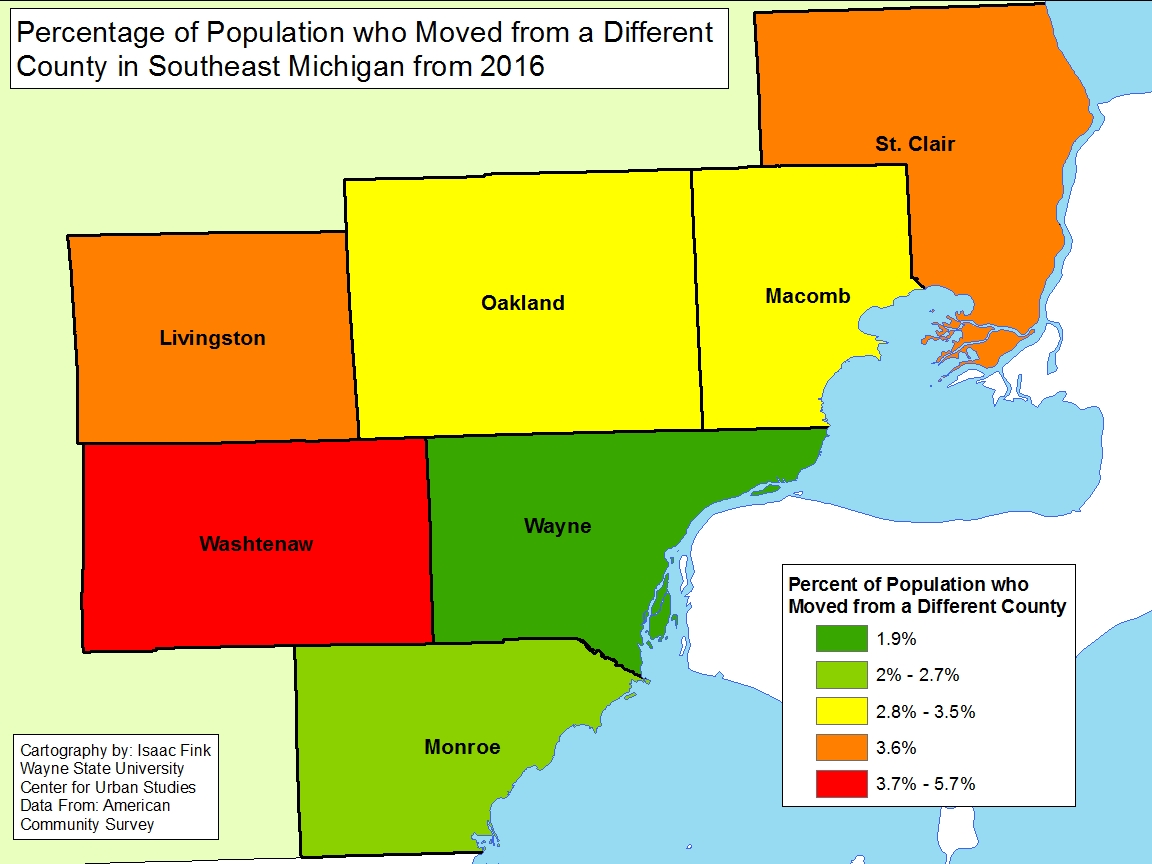
While the map above shows the percentage of Michiganders who moved into a Southeastern Michigan county from elsewhere in the state in 2016, the map does not represent the net gain, or loss, of the migration in each county. Next week we will be diving deeper into the county-to-county migration in Southeastern Michigan to better understand how, and if, counties in the region are growing.

How Detroit is Tackling Rental Code Enforcement, Lead Remediation

The City of Detroit recognizes that lead poisoning prevention is multi-faceted, which is why an Interagency Lead Poisoning Prevention Task Force was created earlier this year, the same time the codes rental properties in the City were tightened. The task force will eventually align future rental code enforcement target ZIP codes with the zip codes where there is a high prevalence of elevated blood lead levels in children. Currently though, the rental code compliance program overseen by the Buildings, Safety, Engineering and Environmental Department (BSEED) is focusing zip codes that do not have among the highest percentage of children 6 years of age and younger with lead poisoning.

The zip codes BSEED is currently enforcing compliance on are: 48215, 48224, 48223, 48219, 48209 and 48210. These six zip codes are the first priorities of the City’s new, stricter rental code ordinance that seeks to ensure all rental properties are properly registered, up to code and have obtained a certificate of compliance. One aspect of the new ordinance is that all rental properties, despite the length of their certificate of occupation, must have annual lead hazard inspections. According to the ordinance, the annual assessment can be waived only if the property owner has taken more long term or permanent measures to abate the lead.


While this ordinance does make lead assessments and abatements a priority for all rental properties, the zip codes identified to have among the highest percentage of children 6 years of age and younger are not included on the initial and current compliance schedule, which is available here (link to BSEED). According to the City of Detroit, the 48210 zip code is to be launched into the new compliance program on Aug. 1, 2018 and is scheduled to have all rental properties in compliance with the new ordinance by Feb 1, 2019. This is certainly a step in the right direction, however, the zip codes with among highest percentage of children with lead poisoning have yet to be placed on the compliance list. The City of Detroit does state though that all rental properties in the City must be in compliance with the new ordinance by the end of 2020.


The zip codes where recent data shows there is the highest prevalence of elevated blood lead levels in Detroit’s children are: 48202, 48204, 48206, 48213 and 48214. According to the City of Detroit Health Department, these zip codes will be included in the new rental property compliance program, but all also be part of the Lead Poisoning Prevention Pilot Program, which is being spearheaded by the Interagency Lead Poisoning Prevention Task Force. As part of this pilot program, there will be door-to-door outreach in the identified zip codes. This outreach will provide occupants, particularly those with children or who are pregnant, with information on how to identify potential lead hazards and protect themselves from the risks. Lead testing will also be provided through this program.

As the information above shows, the City of Detroit has taken steps through both rental code enforcement and direct outreach facilitated through the Health Department. However, direct coordination between the initial enforcement phase of the new rental property compliance ordinance and the Interagency Lead Poisoning Prevention Task Force has yet to fully materialize. The map below highlights just this. The zip codes in red are the ones the City has identified as having the prevalence of elevated blood lead levels in children. The zip codes in blue are the ones that have been identified for the most immediate rounds of registration and compliance for the new rental code.

The information provided in the map below is from the City of Detroit’s website.

Grosse Ile Schools Has Highest Graduation Rate in Southeastern Michigan

For the 2016-17 academic year, Grosse Ile Township Schools had the highest graduation rate in Southeastern Michigan of the school districts in Southeastern Michigan (this excludes charter schools) at 97.6 percent; the district had a 0 percent dropout rate that year as well. Universal Academy and Universal Learning Academy had the highest overall graduation rates in the region at 100 percent; both of these schools are charter schools with Universal Academy being located in Detroit and Universal Learning Academy being located in Westland. The Blanche Kelso Bruce Academy had the lowest graduation rate in the region at 5 percent. This academy is a charter school based in Detroit for youth who have been expelled from or referred by other school districts; according to the school’s website it is closing at the end of the academic year. Clinton Community Schools, a Macomb County School District, had the lowest graduation rate of all school districts (non-charter schools) in the region at 29 percent for the 2016-17 school year.

For the purpose of this post, charter schools were not mapped, only the school districts in the region, which is why you see the lowest graduation rate starting at 29 percent on the first map below. Charter schools are often a single school, and in several cases are online schools, making them difficult to map. Data for this post was provided by the Michigan Department of Education.

In total, there were only eight school districts in the region with graduation rates below 57.5 percent; four of these school districts were in Wayne County. The four school districts in Wayne County with the lowest graduation rates for the 2016-17 academic school year were:

  •             Westwood Community Schools (43.14%)
  •             Redford Union School District (52.9%)
  •             Romulus School District (54.5%)
  •             Harper Woods School District (57.5%)

While Wayne County had the most number of school districts in the bracket with the lowest graduation rates, Oakland County had the most number of districts with graduations rates in the highest bracket, which ranges from 90.8 percent to 97.6 percent. Aside from charter schools in Oakland County, Rochester Community Schools had the highest graduation rate at 96.1 percent in Oakland County. In total, there were 12 school districts in Oakland County with graduation rates between 90.8 percent and 96.1 percent.


The Detroit Public School District had a 72.9 percent graduation rate, with a dropout rate of 11 percent. No school district in the region (this excludes charter schools) had a dropout rate above 31 percent. Westwood Community Schools in Wayne County had the highest dropout rate for the 2016-17 academic year at 31 percent. According to the data, the Westwood Community Schools District had 79 dropouts in the 2016-17 academic year; the total number of students who graduated from that district that academic year was 110.


There were four school districts in the region with a 0 percent dropout rate. As mentioned earlier, Grosse Ile Township Schools was one of these districts, as was Birmingham, Whitmore Lake and Northville school districts.


Evictions Highest in Detroit, Inner-Suburbs

In 2016, the City of Harper Woods just northeast of Detroit, had the highest eviction rate in Southeastern Michigan, according to Eviction Lab. Eviction Lab is a nationwide data base created by Princeton University that shows formal evictions that have taken place throughout the country; these formal evictions are ones that occurred through the court system. In Harper Woods, the eviction rate was 9.9 percent per 100 rental units; this was equivalent to 175 formal evictions in 2016. The City of Dearborn Heights, which is just west of the City of Detroit, had an eviction rate of 9.82 percent per 100 rental units, which was equivalent to 502 total evictions.

The Top 5 Eviction Rates (per 100 rental units) in Southeastern Michigan by City were:

  • Harper Woods: 9.9
  • Dearborn Heights: 9.82
  • Bellevue 9.44
  • Ecorse: 9.29
  • Inkster: 8.18

No data was available for the townships in the above map with the very light green.

While inner-ring suburbs ranked the highest for eviction rates in Southeastern Michigan, the City of Detroit had the most evictions in terms of sheer volume. In total, there were 6,664 formal evictions in the City of Detroit in 2016; this was equivalent to an eviction rate of 5.2 percent per 100 rental units.

When examining eviction rates at a Census Tract level in Detroit, the data shows that there were only four Census Tracts with eviction rates above 11 percent. Two of these Census Tracts were located on the City’s west side and the other two were located on the far east side of the City. The majority of the central part of Detroit, and into Southwest Detroit, did not have formal eviction rates above 5.3 percent in 2016, according to the data. The west of the City had the highest concentration of formal eviction rates above 7.7 percent.

Understanding eviction rates for the City of Detroit, and the region, is important because this data further demonstrates how income inequality affects the citizens of Southeastern Michigan. Evictions occur when a rental tenant is involuntary removed from his or her home. Evictions can occur due to the tenant’s inability to pay rent, along with reasons such as property damage and taking on boarders. Clearly though, there is a relationship between income and evictions. For low-income families, a single monetary emergency can mean a missed rent payment, and ultimately eviction. As can be seen in the first map, many of the cities in Southeastern Michigan with a 0 percent eviction rate are those with higher than average median incomes, such as Bloomfield Hills and Birmingham. Detroit, Ecorse and Inkster are among the cities in Southeastern Michigan that do not have such socioeconomic characteristics. Rather, Detroit, Ecorse and Inkster have among the lowest median incomes in the region and some of the highest eviction and poverty rates.

This discussion on eviction rates will certainly be part of our overall poverty review of Southeastern Michigan, which will also examine median incomes, poverty rates, homeowner status and education levels.

To understand the dynamics and consequences of eviction for the poor, see: Evicted: Poverty and Profit in the American City by Matthew Desmond.


By the Numbers: Detroit Burglaries by Neighborhood

Five neighborhoods in Detroit had 150 burglaries ore more in 2017, according to public crime data from the City of Detroit. Warrendale, Regent Park, Franklin Park, Bagley, Cornerstone Village and Brightmoor were these neighborhoods. Warrendale, Franklin Park and Brightmoor are located on the west side of the City while Bagley is closer to the Palmer Park area. Regent Park and Cornerstone Village are on the east side.

By the Numbers:

  • Warrendale: 255
  • Regent Park: 209
  • Franklin Park: 157
  • Bagely: 155
  • Cornerstone Village: 153
  • Brightmoor: 150

**The reported burglaries and the associated geocoding for the maps below are from the City of Detroit’s public open data portal.

In total, there were 8,299 reported burglaries in 2017.

While these five neighborhoods stand out on the map below, what also stands out is the number of neighborhoods with 51 or fewer burglaries in 2017. In total, there were 83 different neighborhoods in the City with 51 or fewer burglaries in 2017. The neighborhoods are primarily located in the central portion of the City, which includes the Downtown and Midtown areas, up through New Center and into the Palmer Park area. There were 13 neighborhoods in the City in 2017 with less than 10 reported burglaries.

By the Numbers:

  • Delray: 9
  • Boston Edison: 8
  • Brewster Homes: 8
  • Greenfield Park: 6
  • Joseph Berry Sub: 6
  • Palmer Woods: 6
  • Cultural Center: 5
  • Green Acres: 5
  • Henry Ford: 5
  • Hubbard Richard: 4
  • Wildemere Park: 4
  • Jeffries: 2
  • Conner Creek Industrial: 1

The map below shows the burglaries discussed above, but by Census Tract rather than neighborhood. The same message is conveyed, yet we are able to see even more closely where the burglaries in the neighborhoods are concentrated.