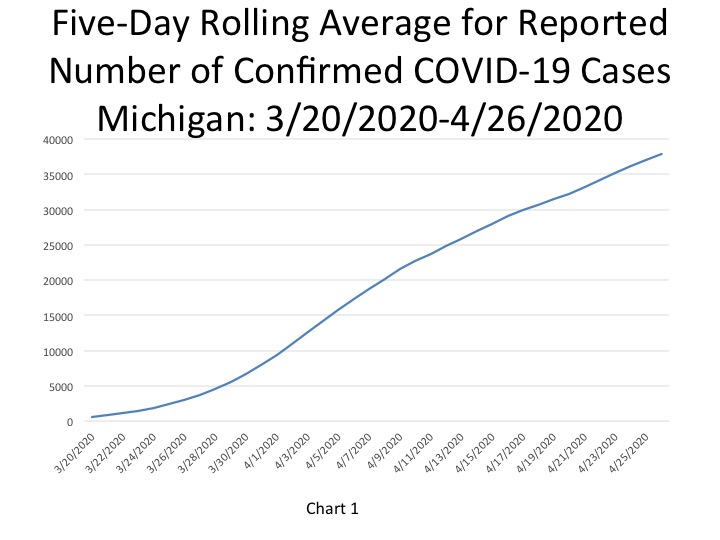
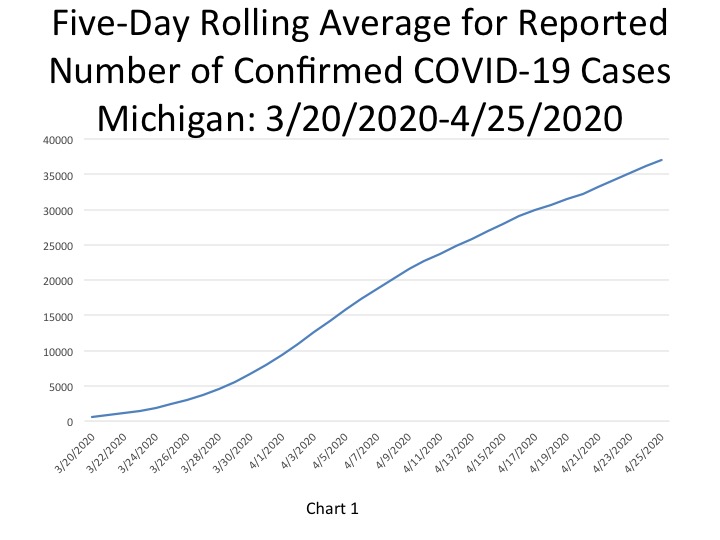
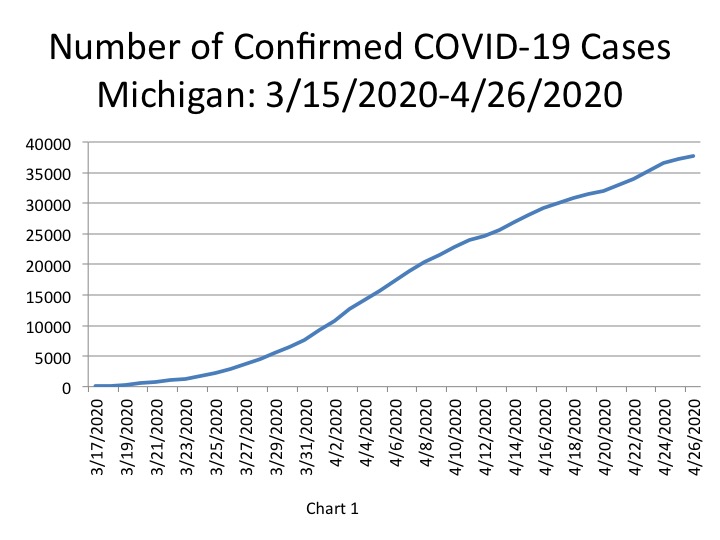
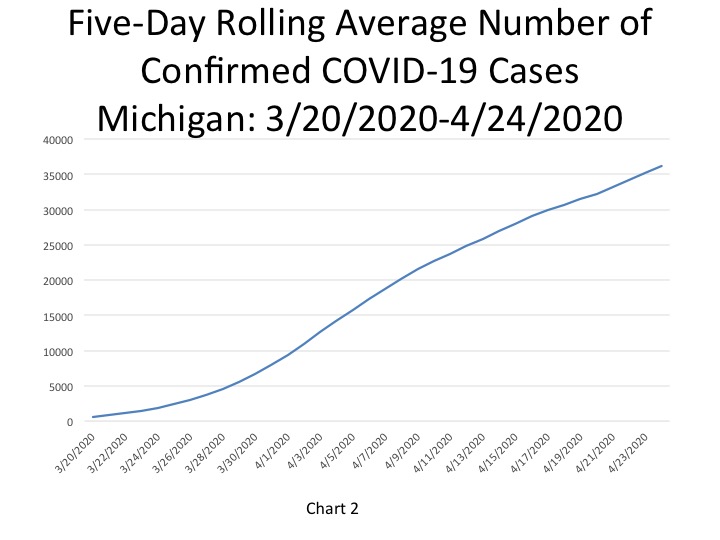
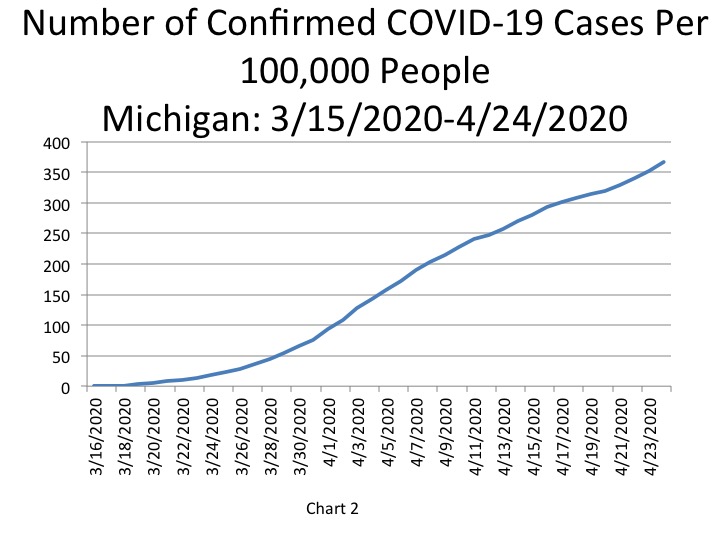
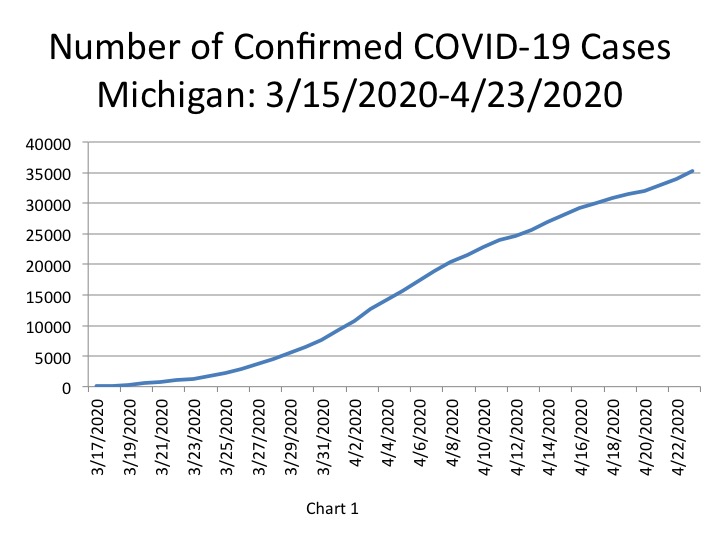
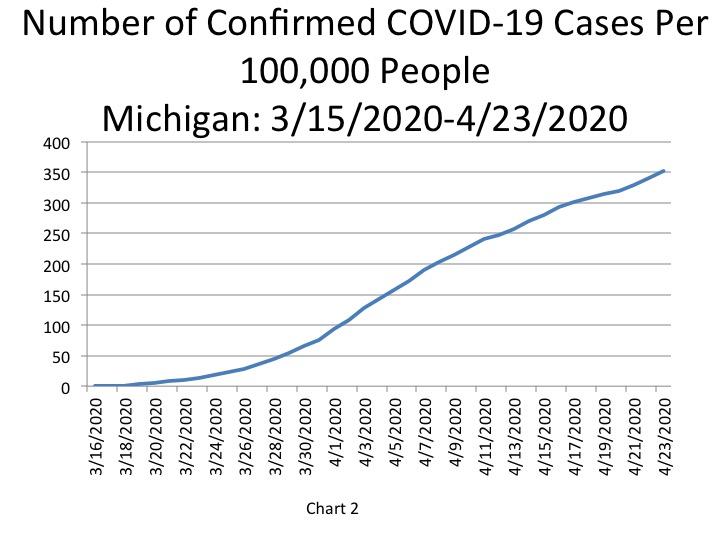
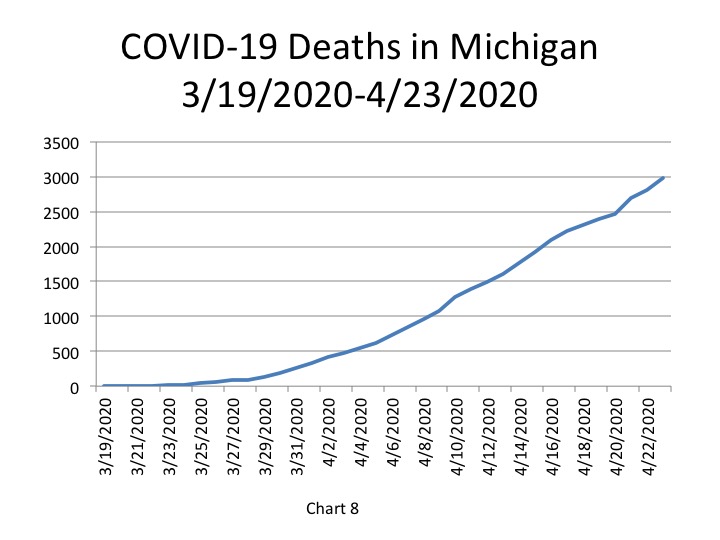
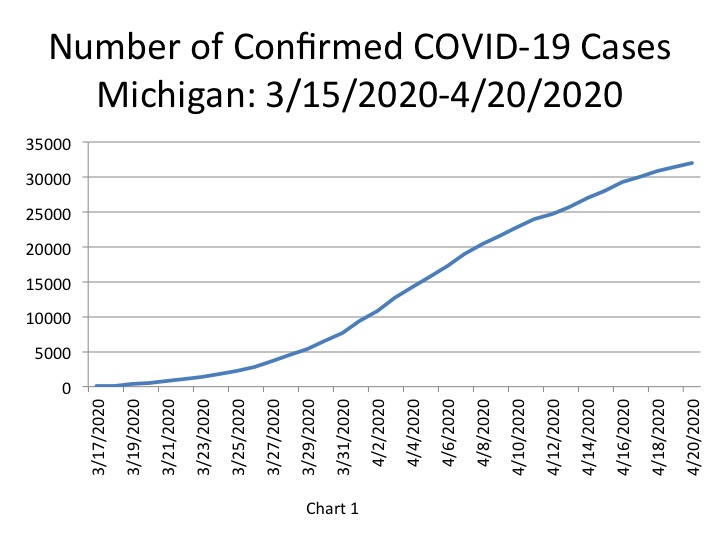
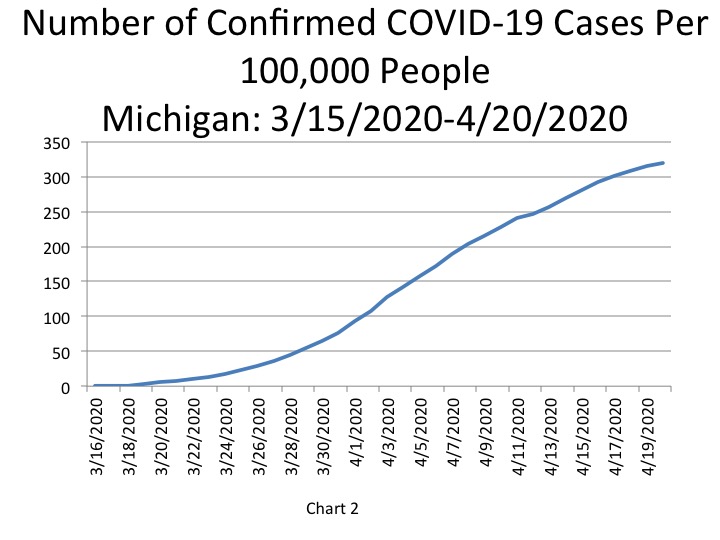
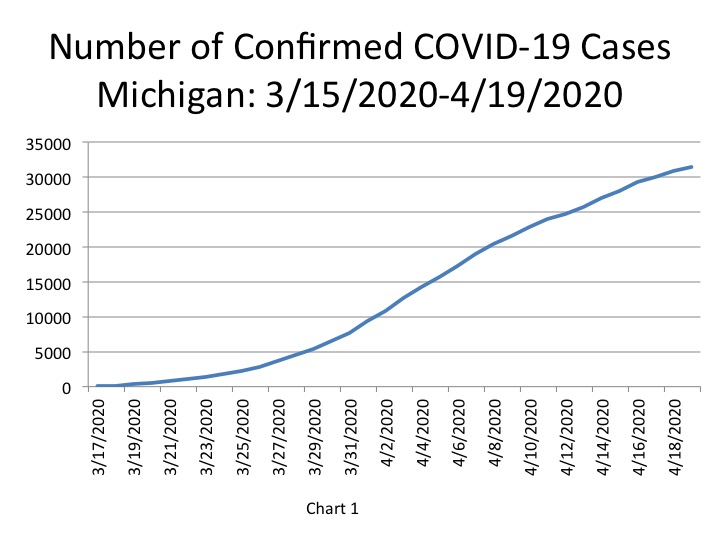
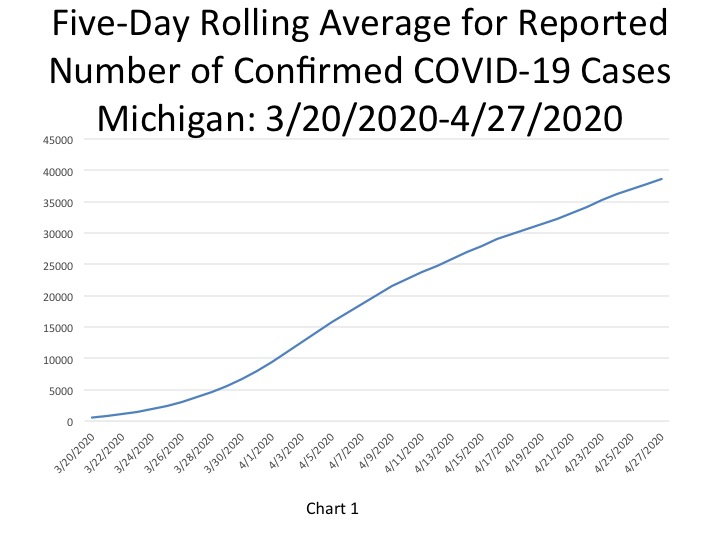
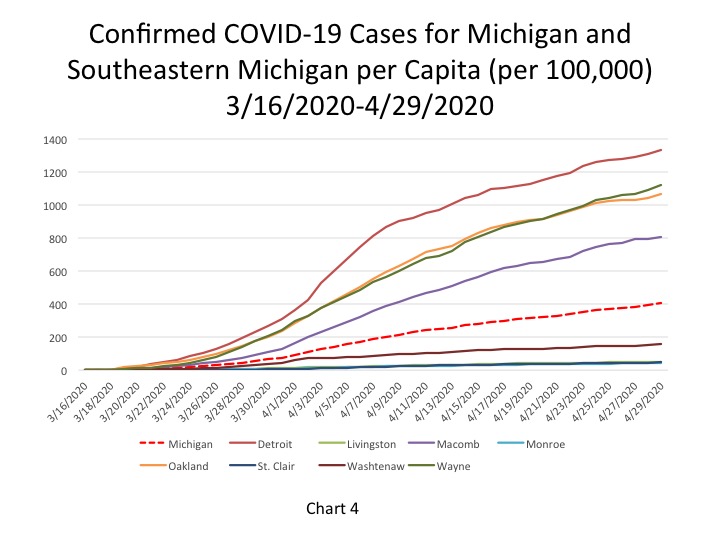
According to the State of Michigan, the total number of COVID cases in Michigan rose above 40,000 on April 29, bringing the new total to 40,399, an increase of 1,137 cases from the previous day. This total was equivalent to 404.5 cases per 100,000 people (Chart 4) on April 29. The five-day rolling average for the total number of COVID cases (Chart 1) reflects a smoother curve and adjusts for fluctuations in testing or the quality of reporting or failure to report. The five day rolling average means our daily case and death charts lags two days behind. Based on this approach, the COVID cases increased to 38,570.
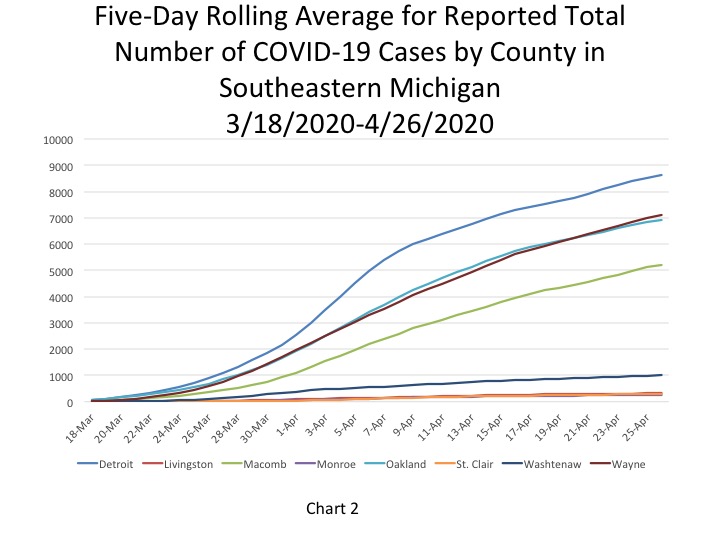
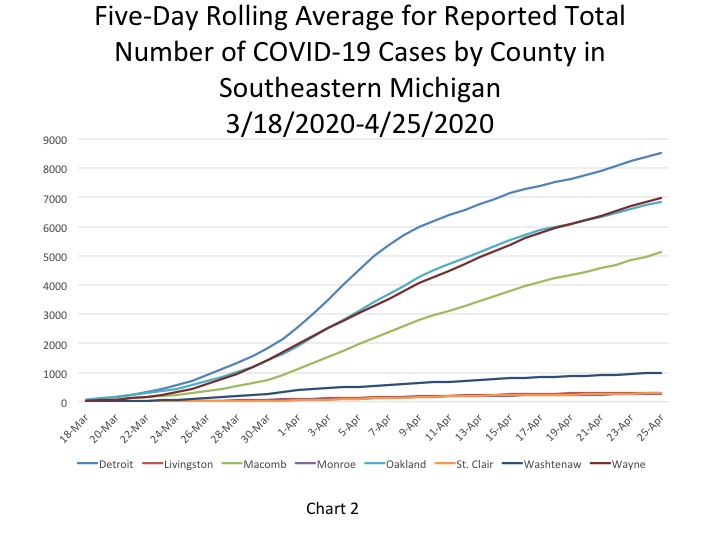
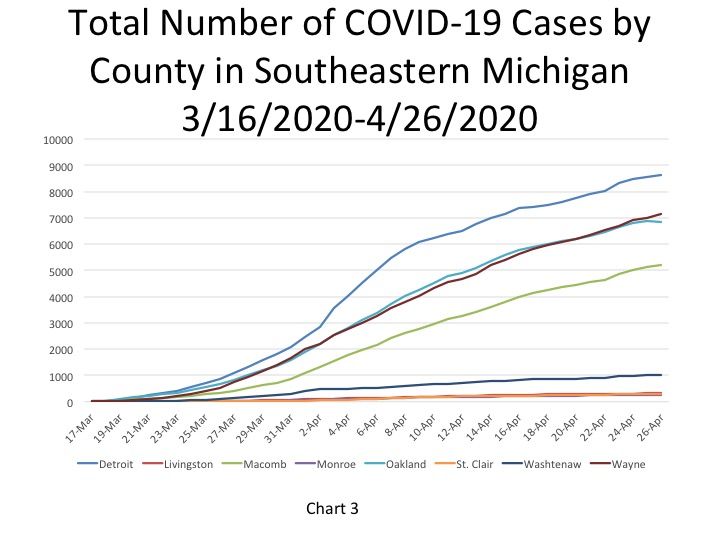
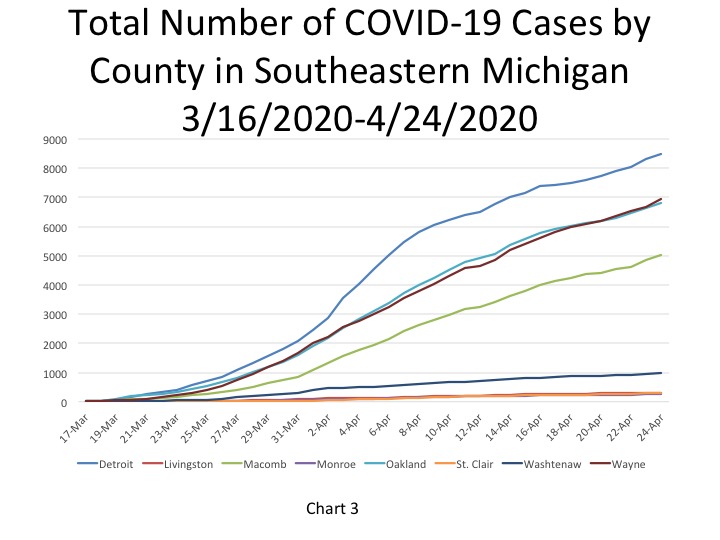
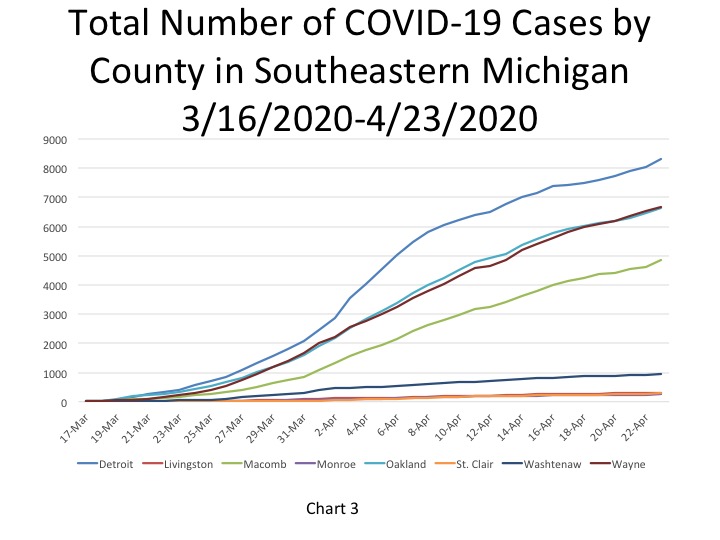
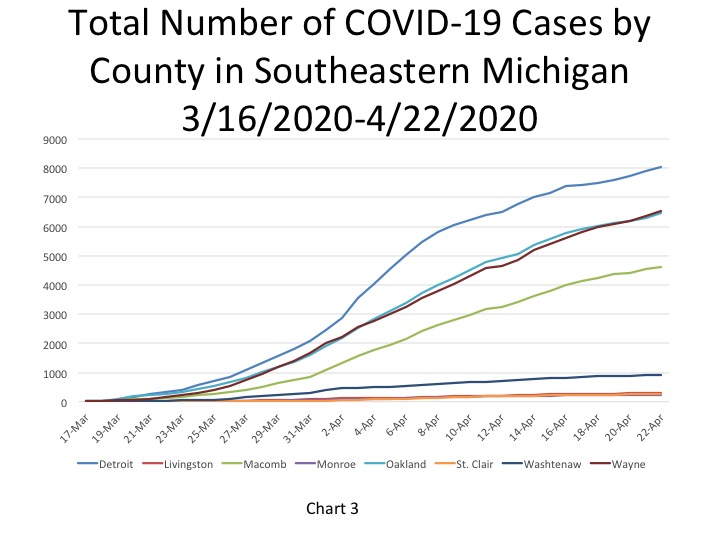
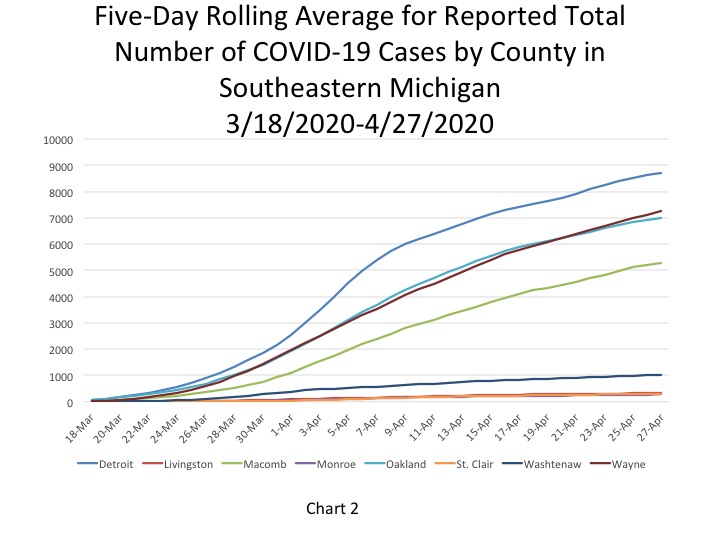
In Chart 2, which reflects the five-day rolling averages at the County level and for the City of Detroit, we continue to see Detroit and Wayne County having the highest number of cases at 8,722 and 7,245 on April 27, respectively. Those case numbers appear to be increasing at a higher rate than those in Oakland and Macomb counties, which were recorded at 6,979 and 5,291, respectively on April 27. Additionally, we have yet to see slower rate of increase in the number of cases at the State level and in Detroit, Wayne, Oakland and Macomb counties.
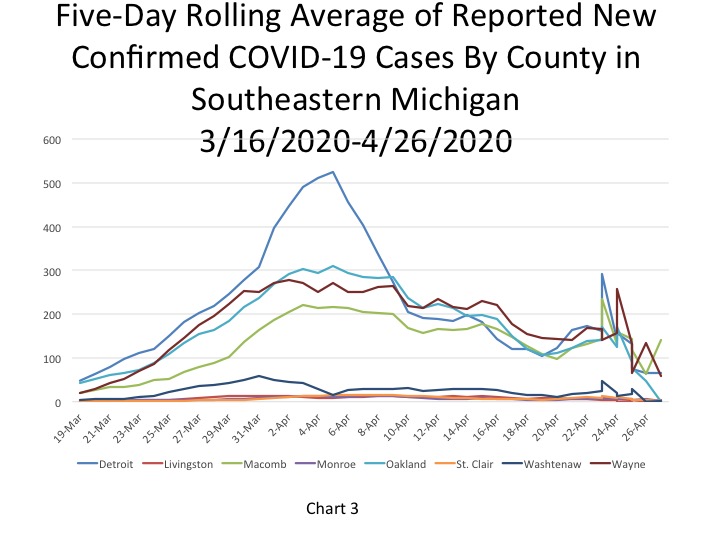
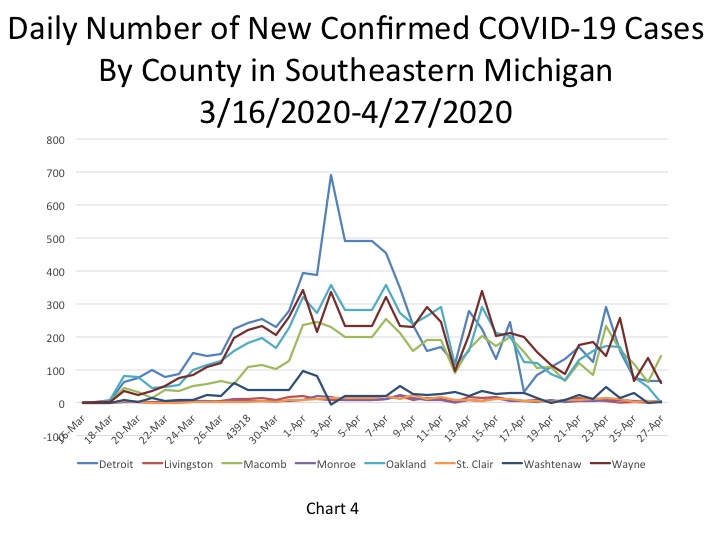
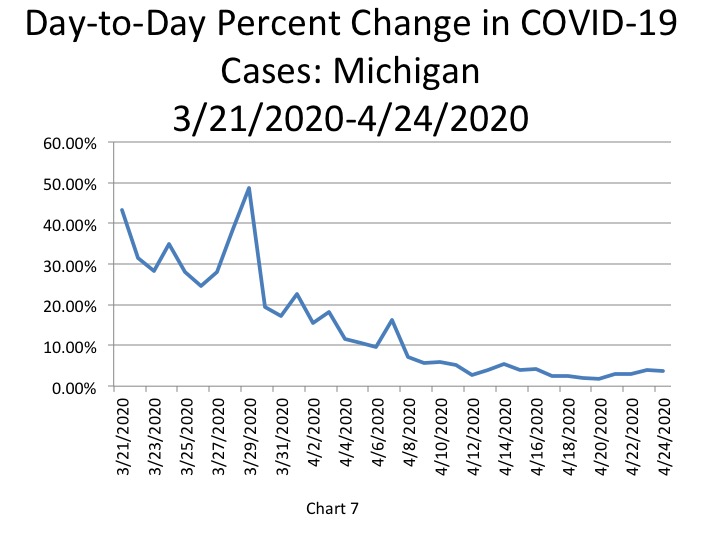
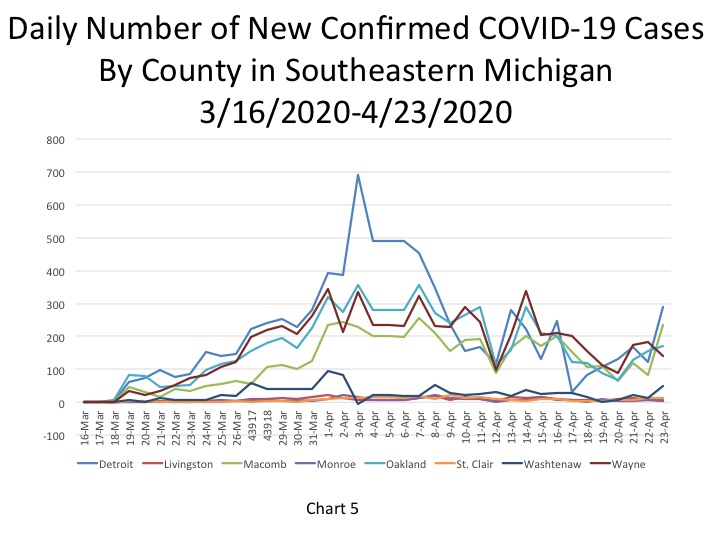
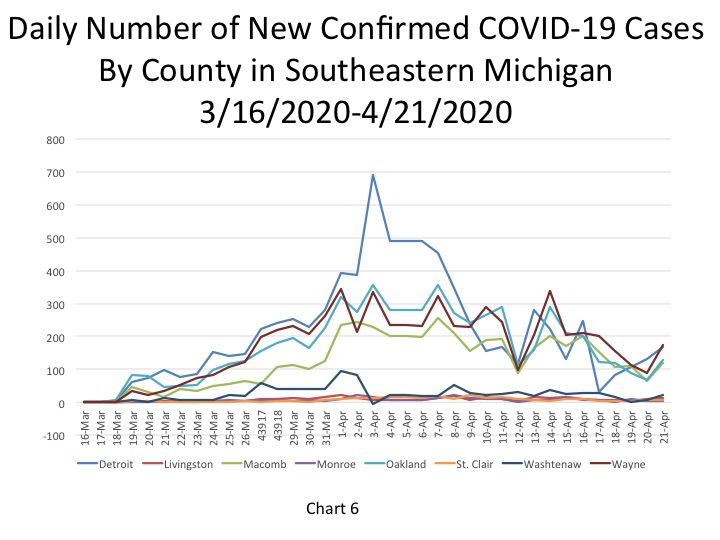
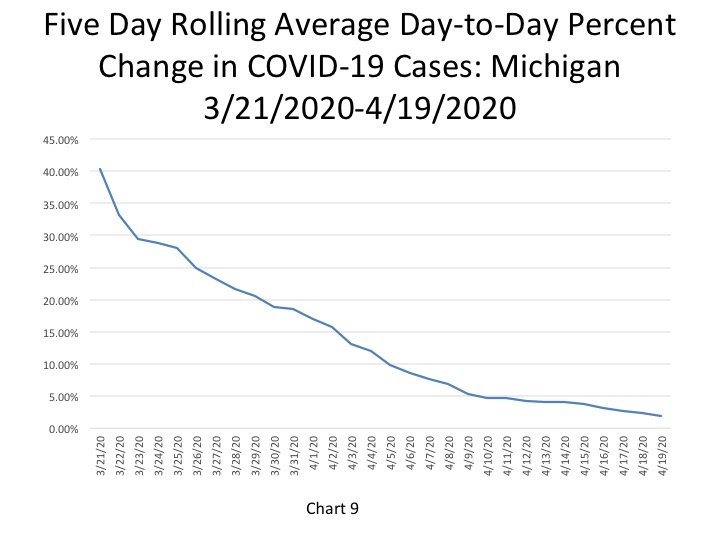
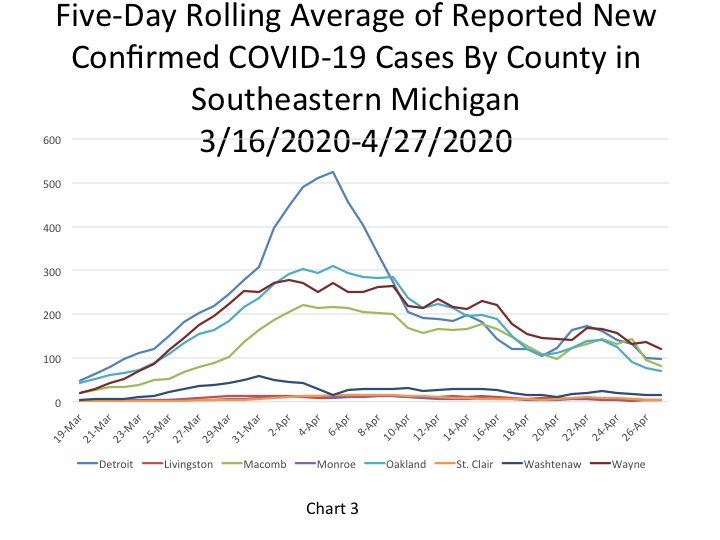
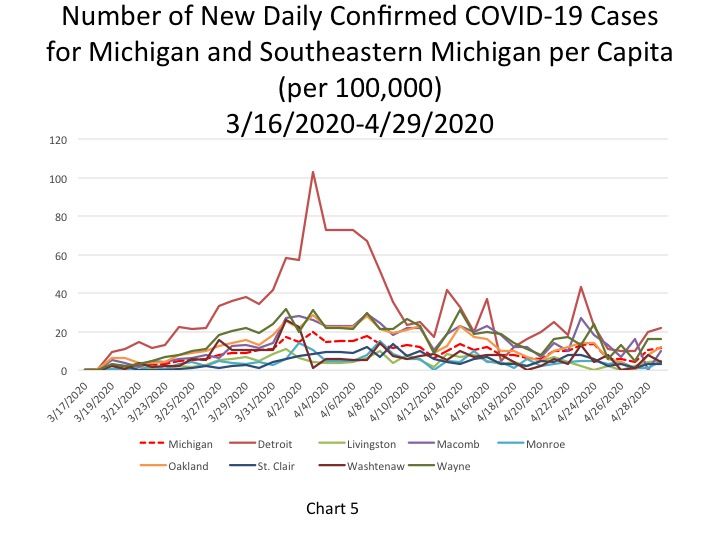
We continue to see both an overall and recent decline in the number of new daily COVID cases in Chart 3. While the number of new reported cases is reliant on testing for the virus, there is hope that the decrease in new cases reflects a slower spread of the virus.
The daily data highlighted in these posts is from Michigan.gov/coronavirus, where data is updated daily at 3 p.m. Historical data was supplied from covidtracking.com, which republishes COVID data from the State.
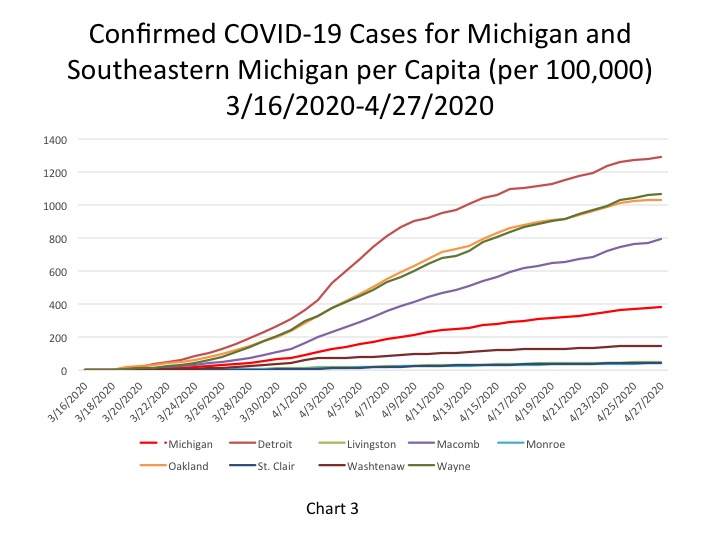
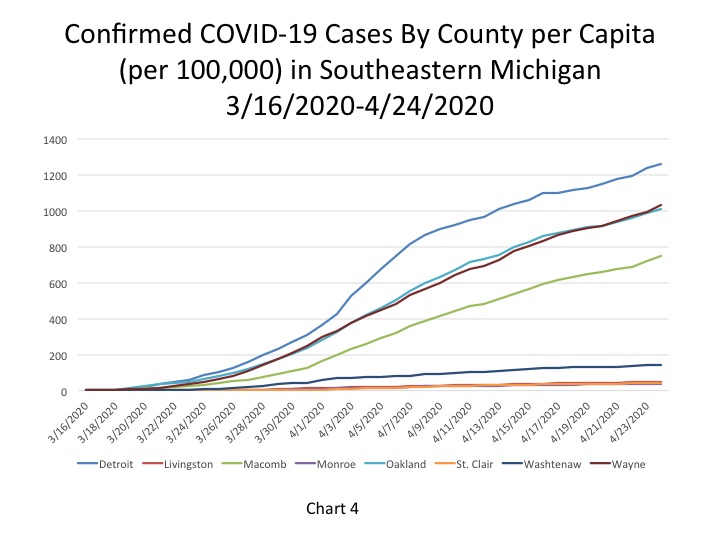
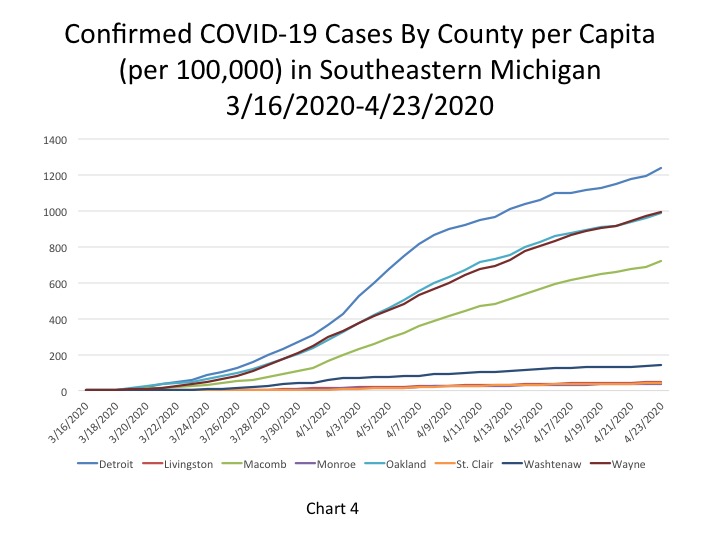
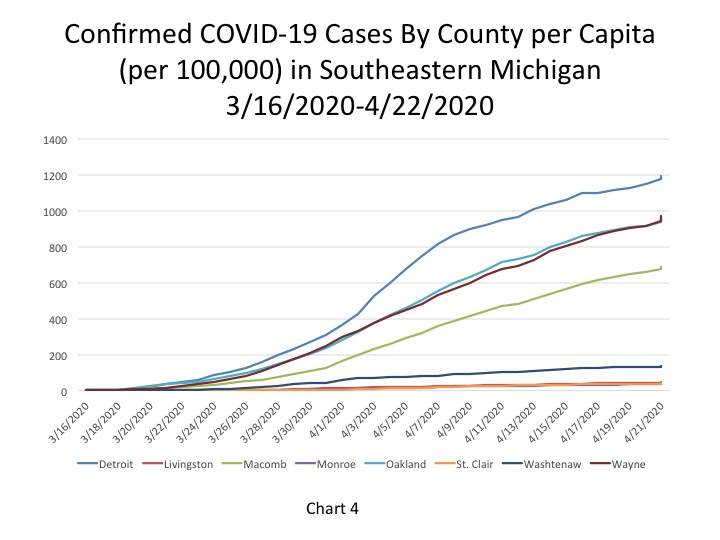
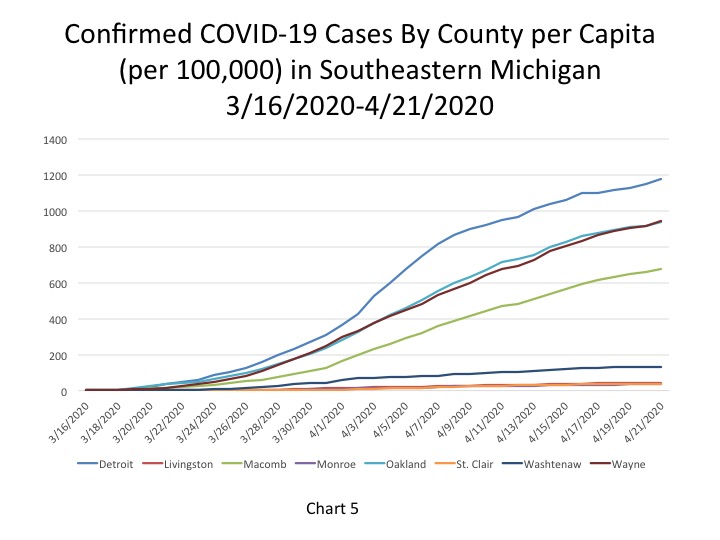
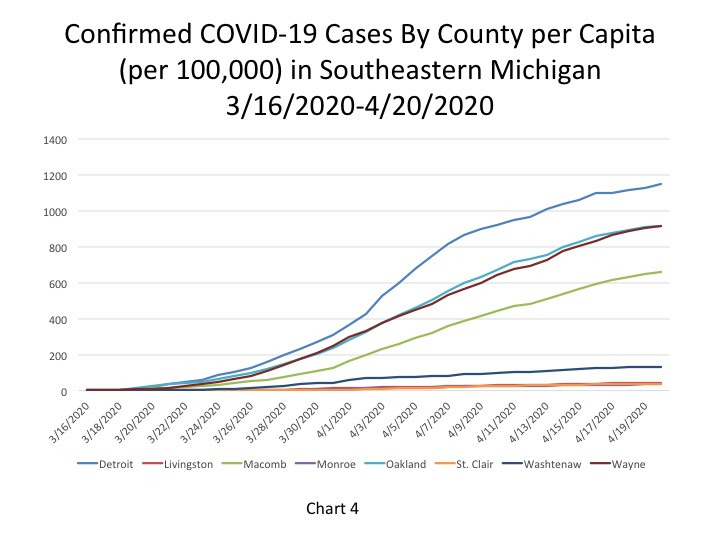
The City of Detroit had 1,332 COVID cases per 100,000 people on April 29, an increase from 1,310 the day before (Chart 4). This is based upon a reported increase of 146 new cases, bringing the total number of COVID cases in Detroit to 8,957. Wayne County reported 1,120 cases per 100,000 people, and Oakland County had 1,064 cases per 100,000. These April 29 per capita rates were based upon 7,537 cases for Wayne and 7,159 for Oakland. Macomb County reported 807 cases per 100,000 people, which is based upon 5,430 cases.
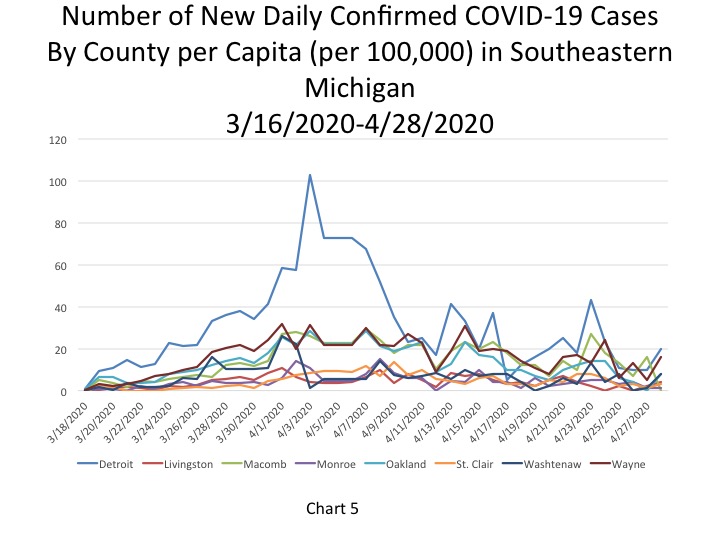
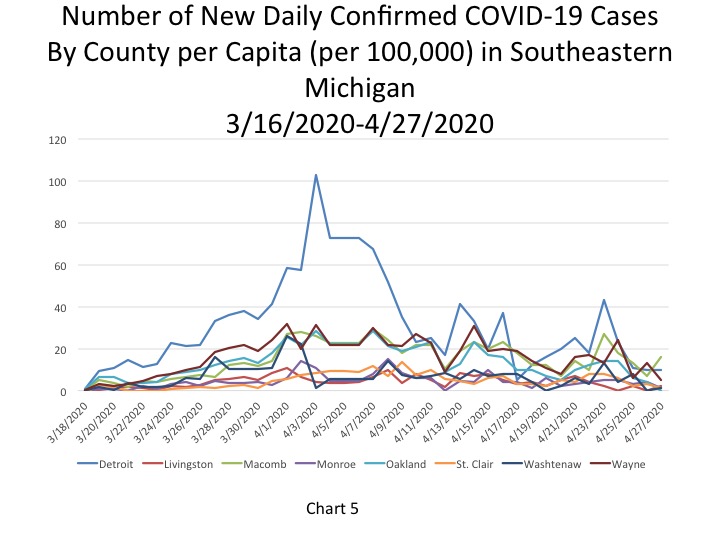
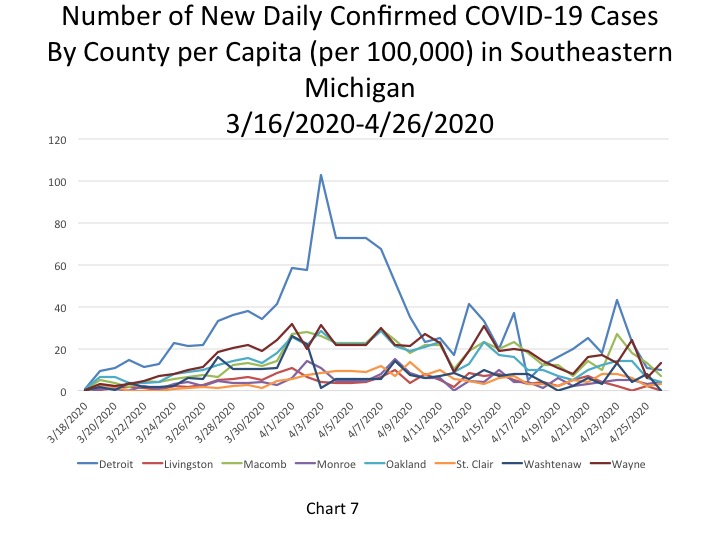
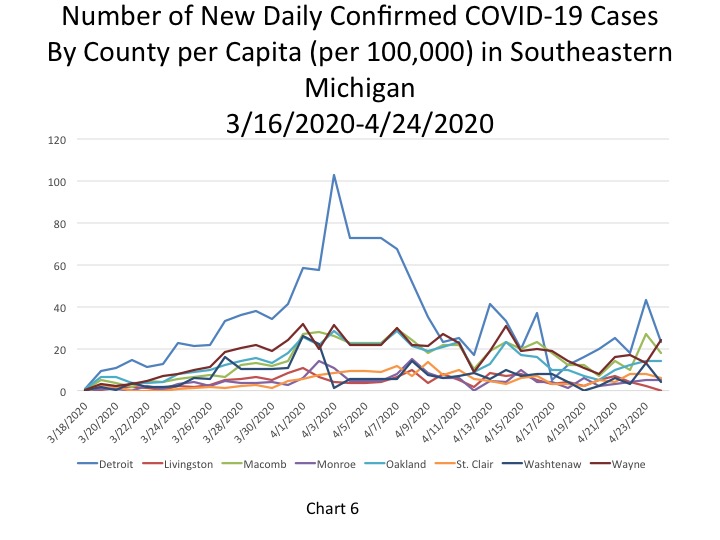
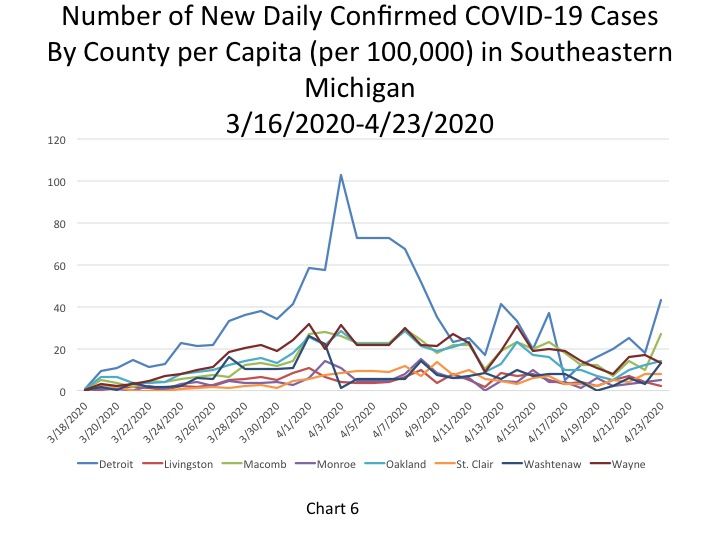
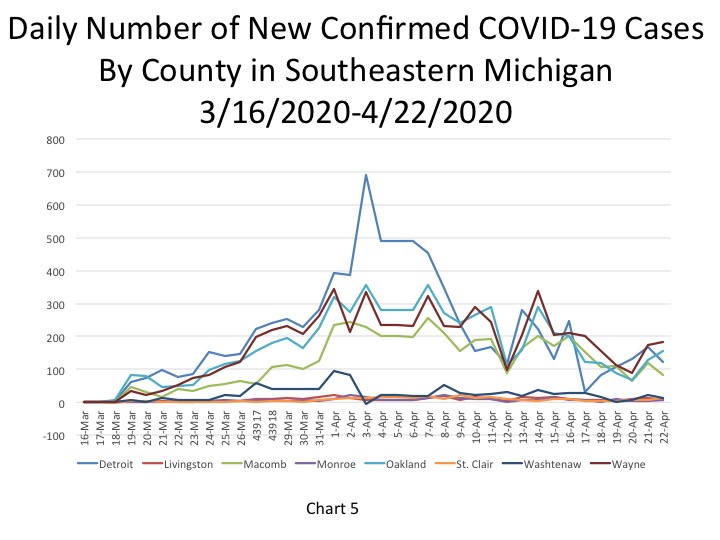
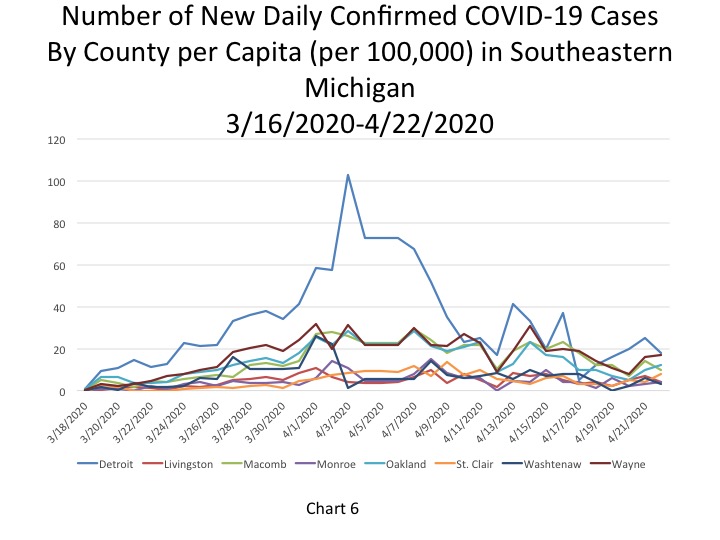
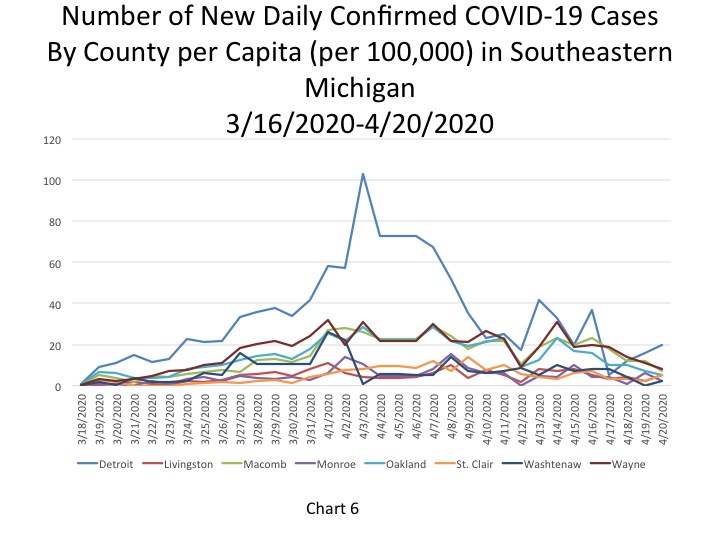
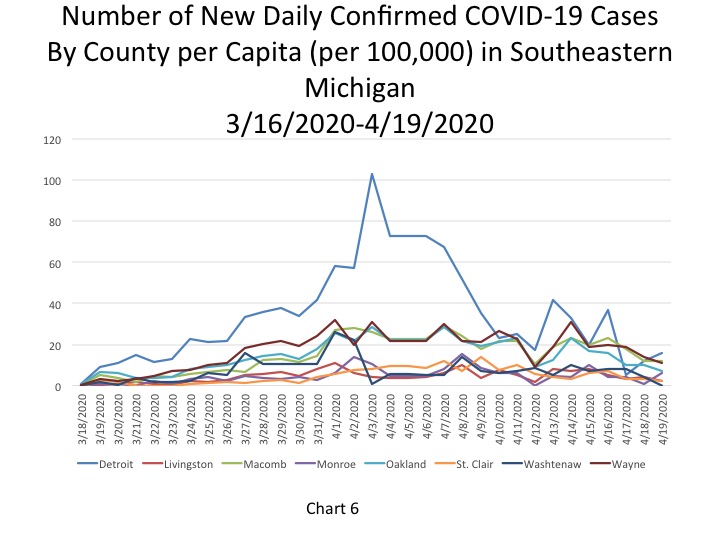
Chart 5 shows that Detroit and Wayne County had the highest number of new COVID cases per 100,000 people on April 29. Detroit had 22 new COVID cases on April 29 per 100,000, which was equivalent to 146 new cases, and Wayne County continued to have 16 new cases per 100,000 people (the same rate as the day before) which was equivalent to 175 new cases. This chart also shows that Oakland County’s per capita rate of new COVID cases per 100,000 people rose above the State’s rate on April 29. Oakland County’s rate was 12 new COVID cases per 100,000 people, which was equivalent to 147 new cases, and Michigan’s rate was 11.4 new COVID cases per day. The State’s per capita rate was equivalent to 1,137 new cases per day.
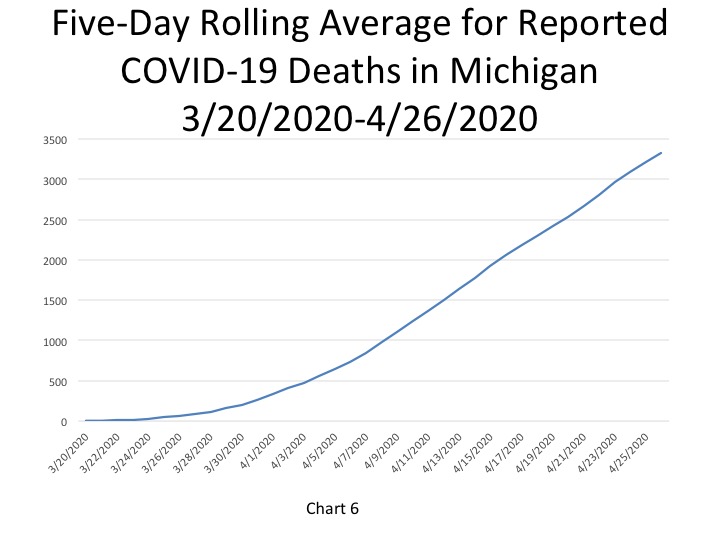
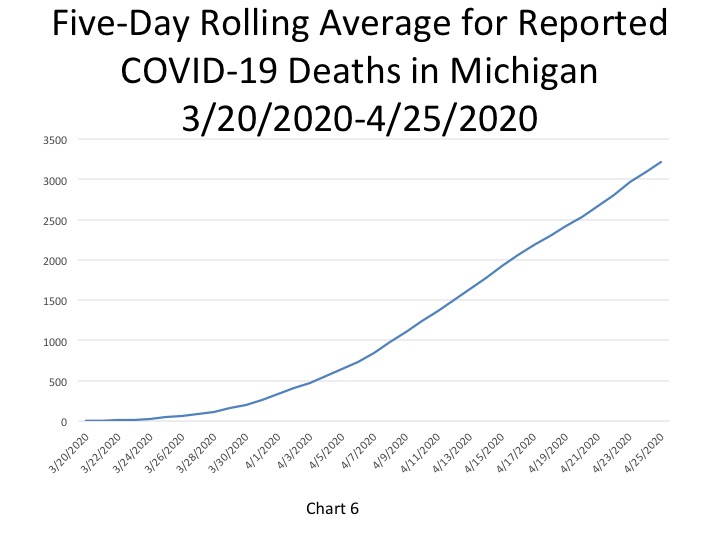
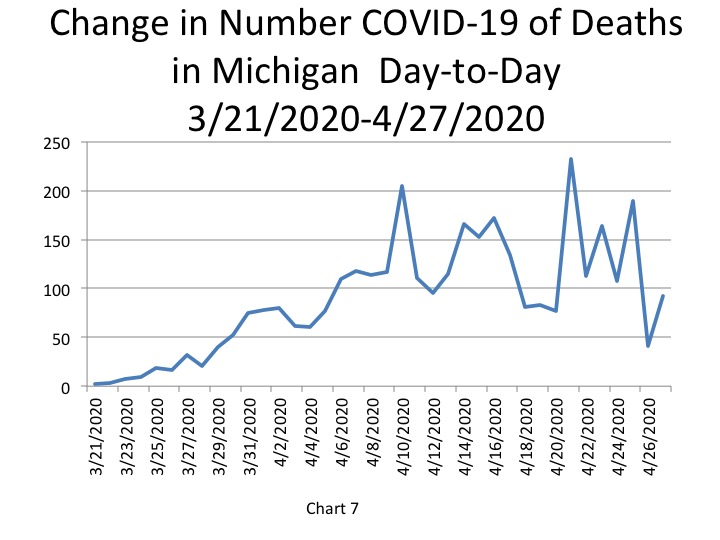
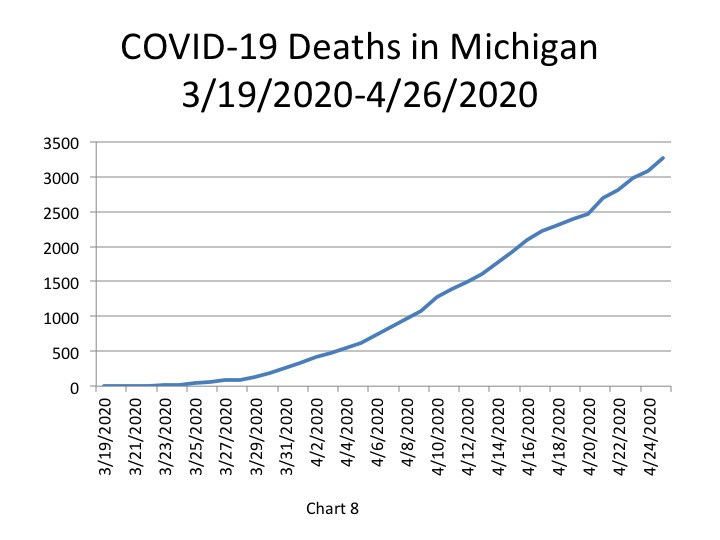
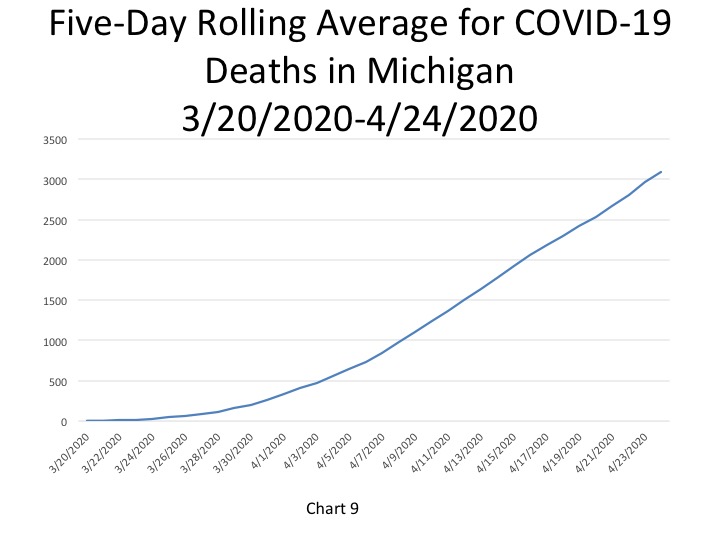
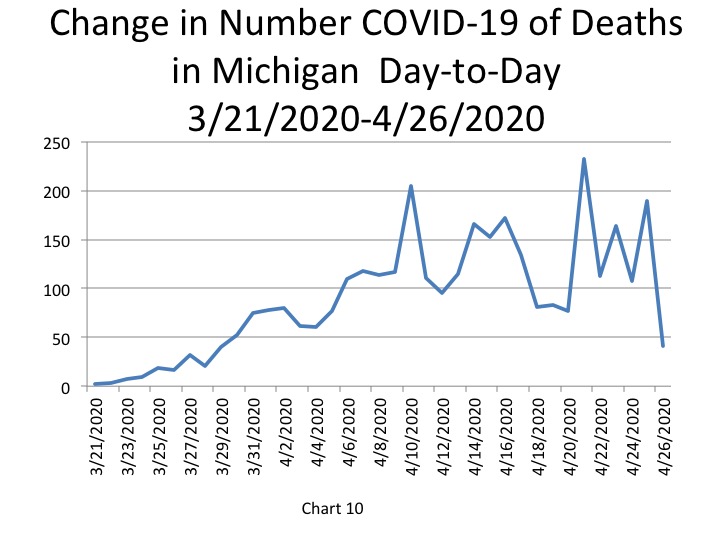
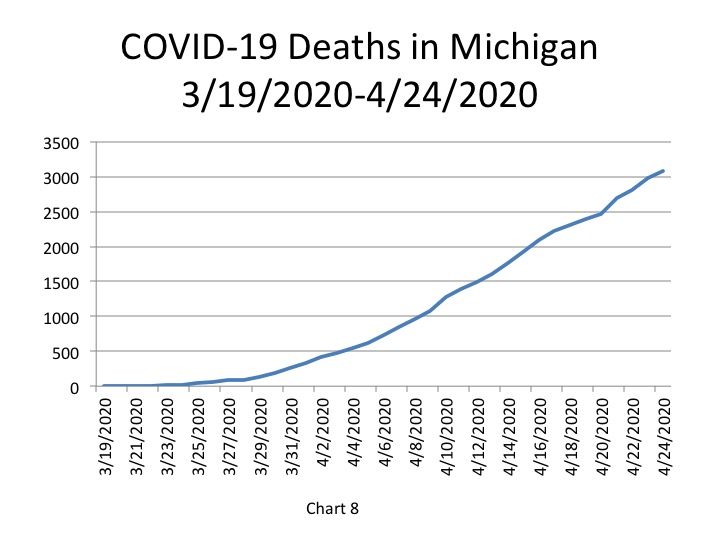
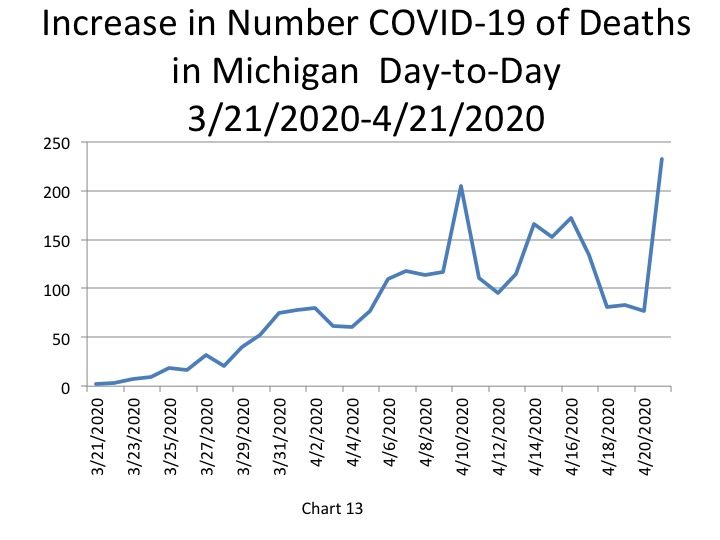
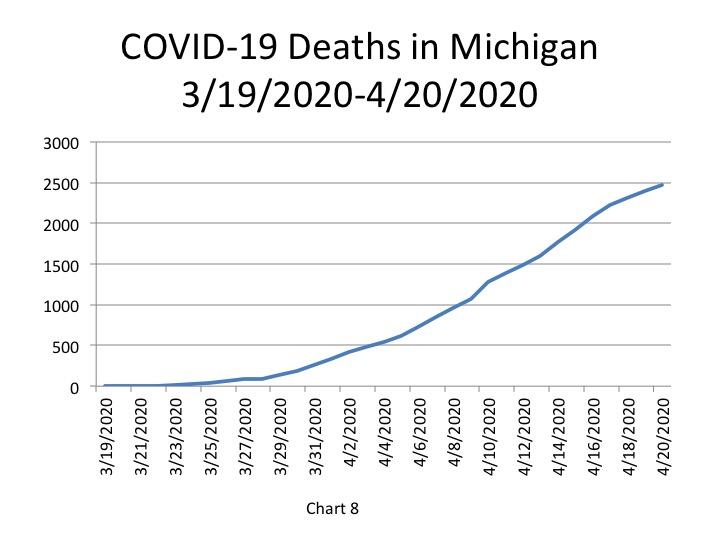
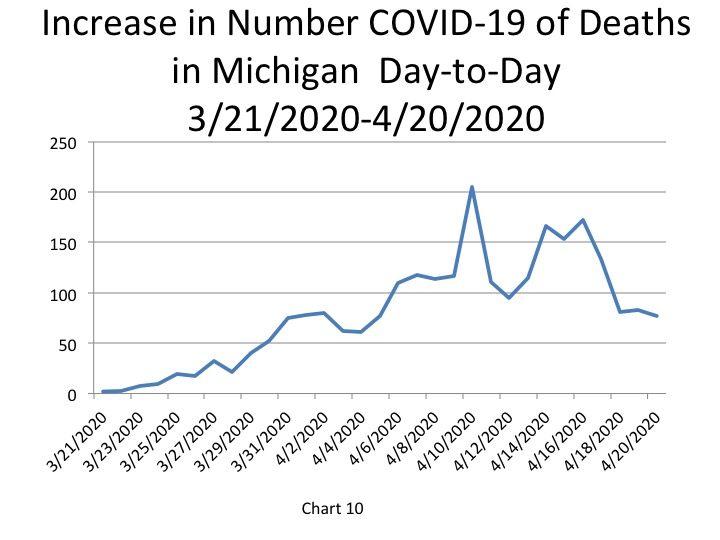
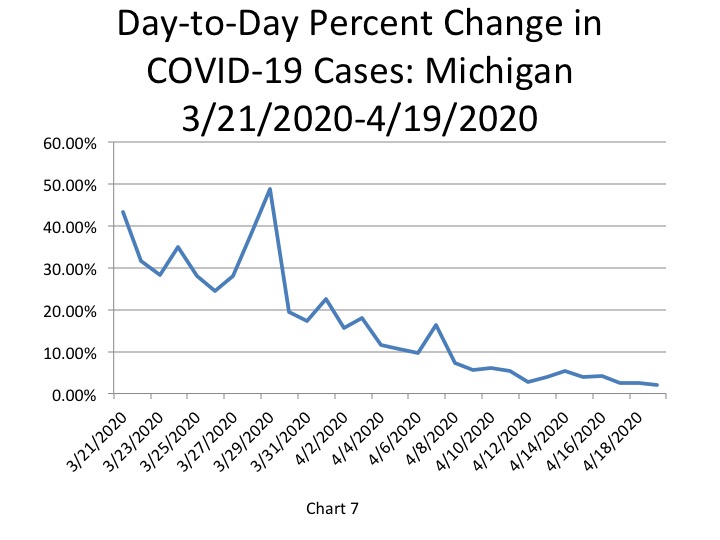
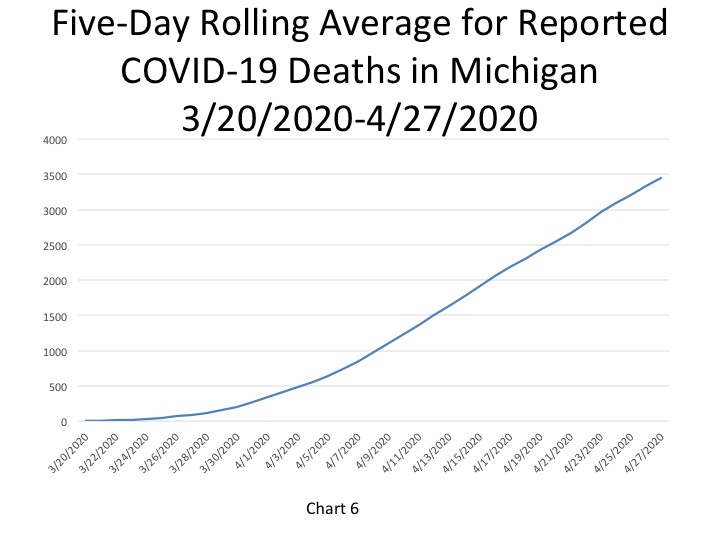
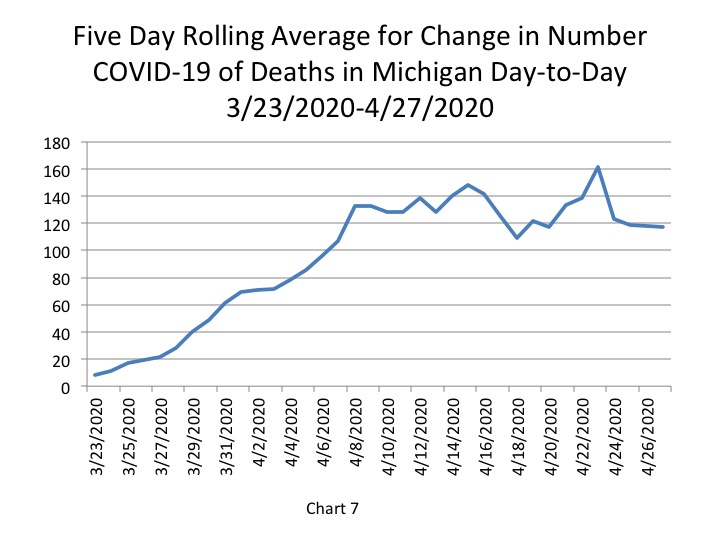
In Chart 6 the five-day rolling average for the number of deaths shows a continuing steady increase (a lagged number of 3,446 deaths, an increase of 117 deaths). The actual reported COVID-19 deaths reached 3,670 on April 29, an increase of 103 deaths from the day prior. Chart 7, a five-day rolling average chart, shows how the new data reflects another decline in the number of additional deaths statewide.
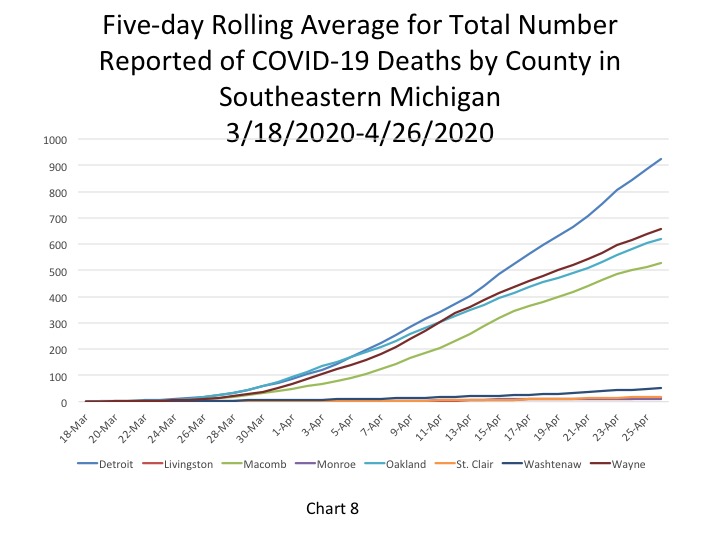
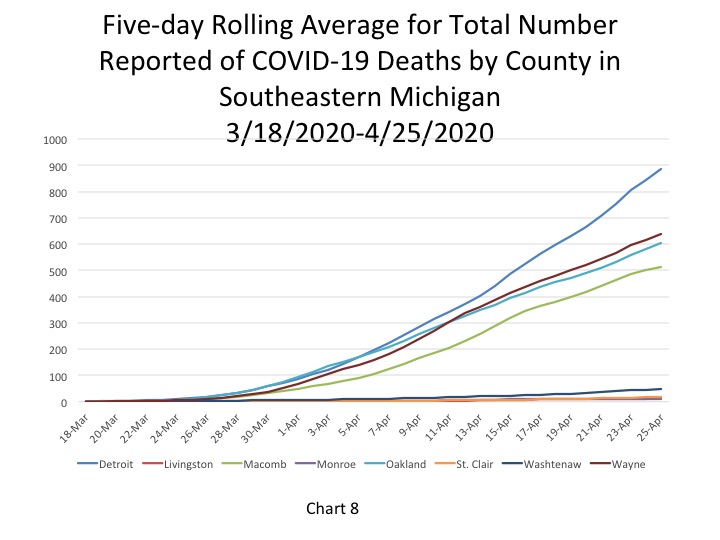
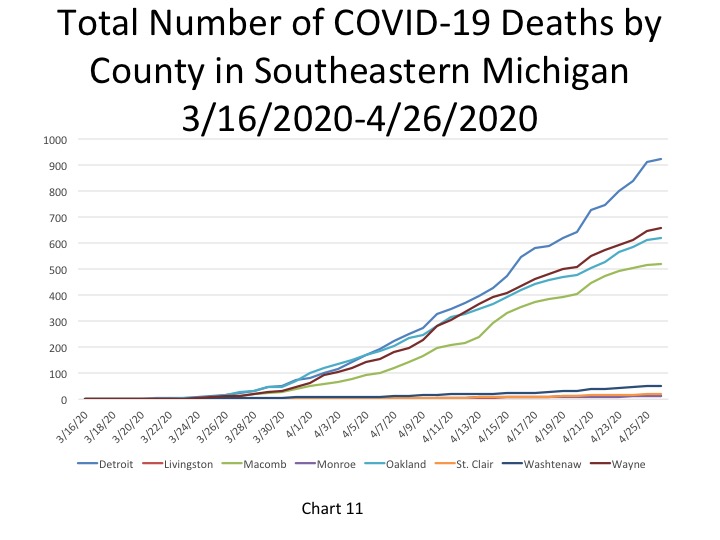
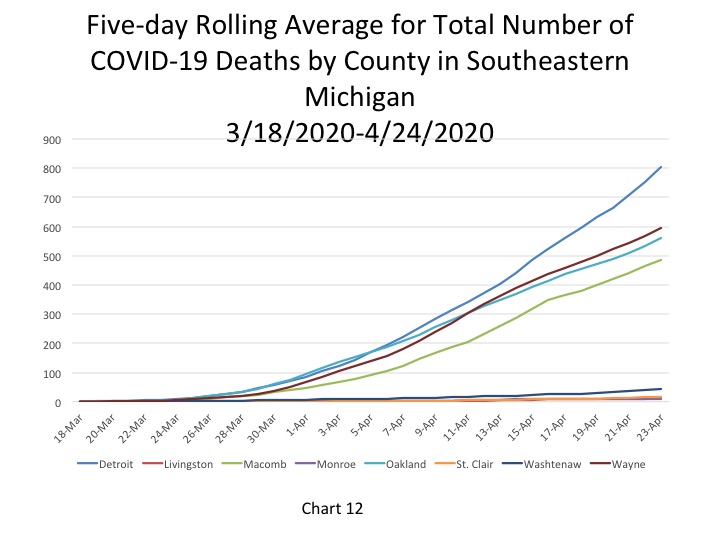
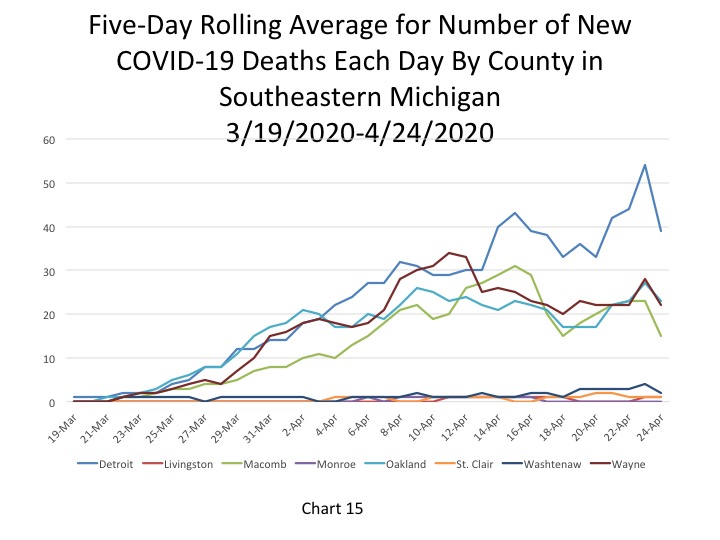
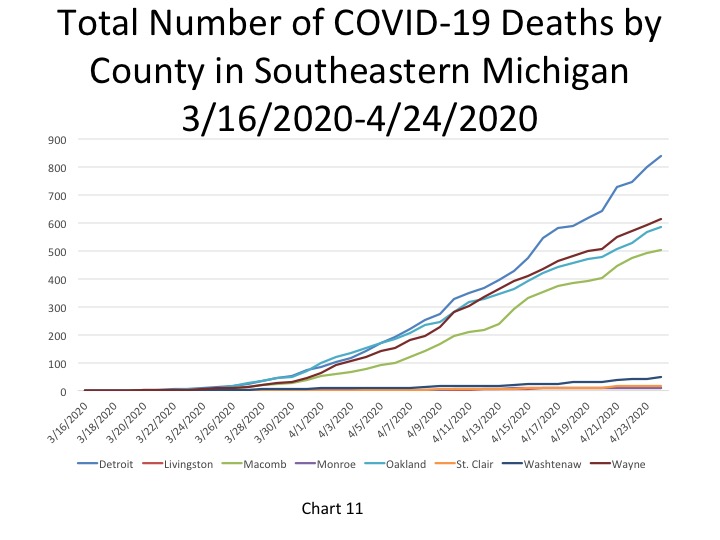
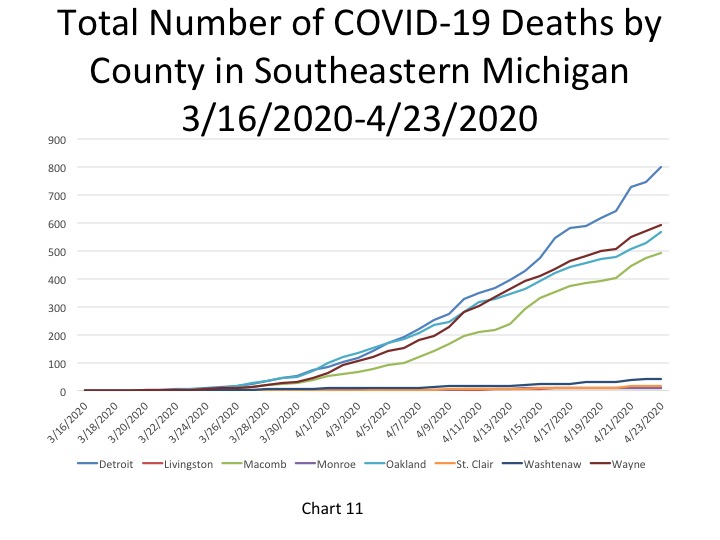
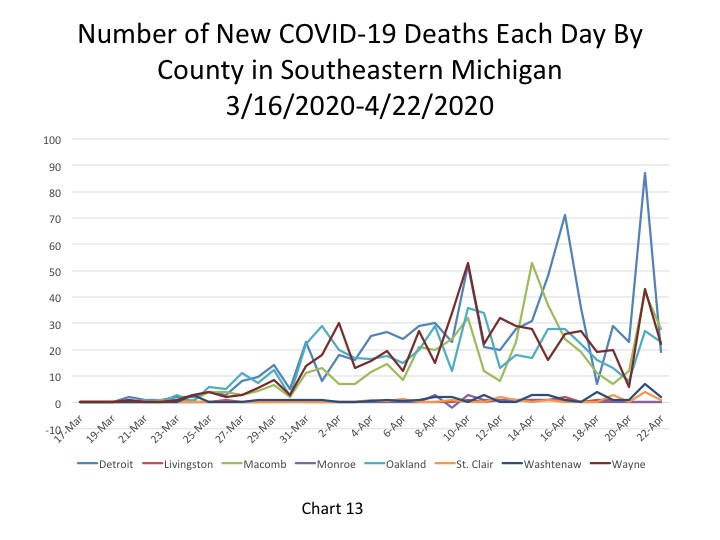
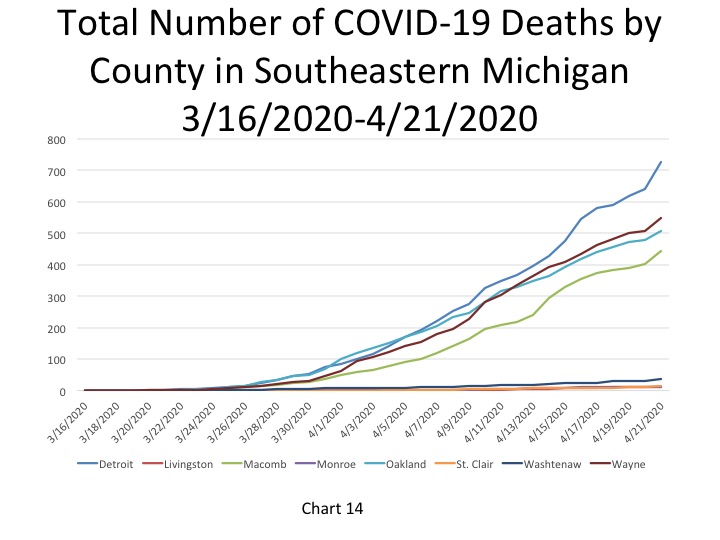
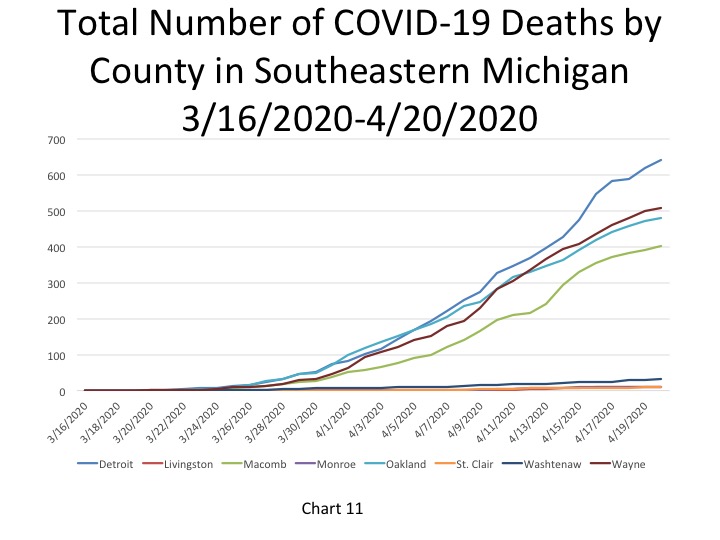
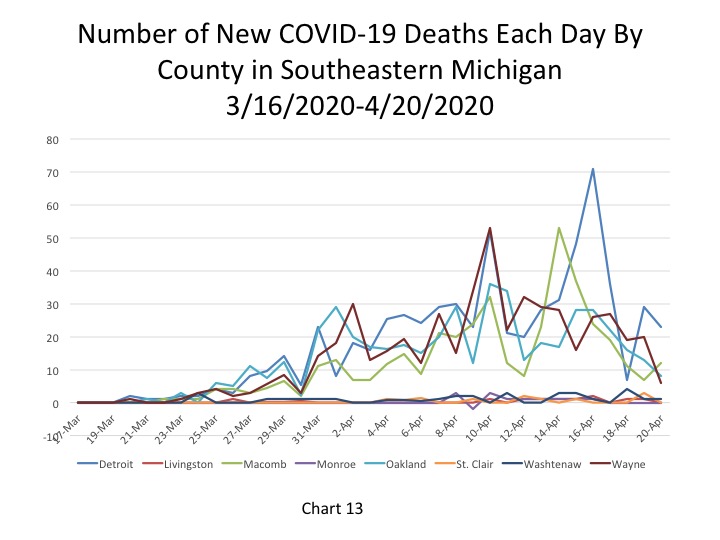
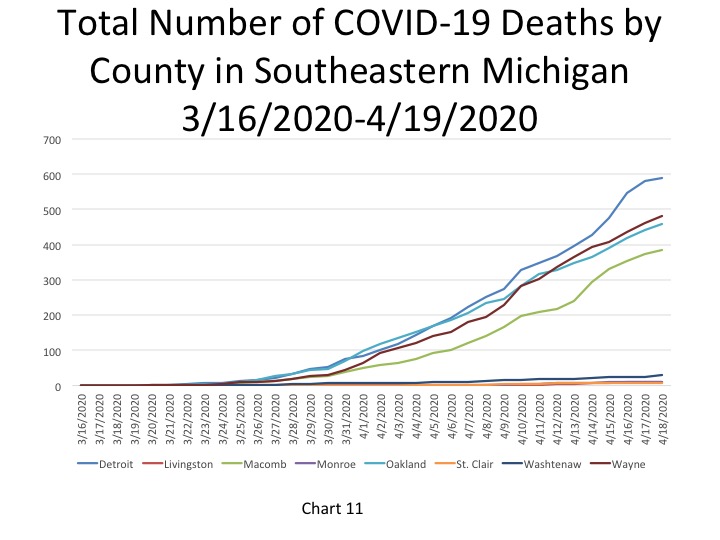
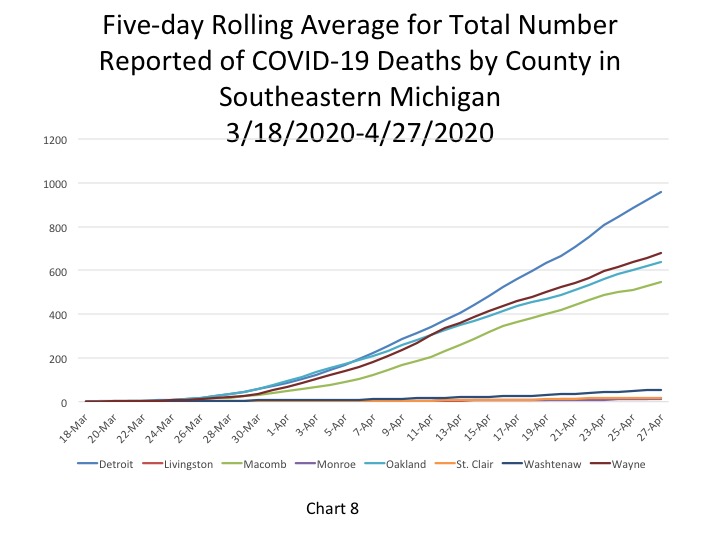
Chart 8, a five-day rolling average for the number of COVID deaths by each county, shows how Detroit continues to pull farther away from the other units in Southeastern Michigan when looking at the total number of COVID deaths. Wayne County, which has the second highest number of deaths, and Oakland County follow a similar pattern in COVID death totals and remain close in their numbers. Macomb County consistently has the fourth highest total number of deaths and its rate of increase appears to have experienced an uptick since mid-April.
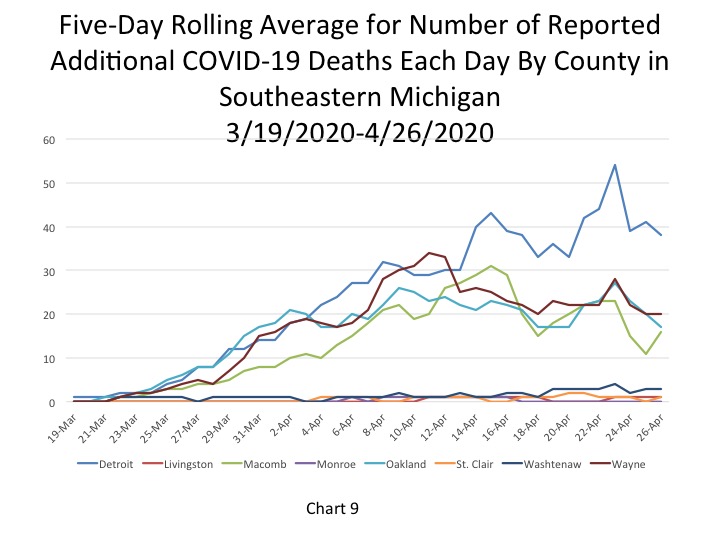
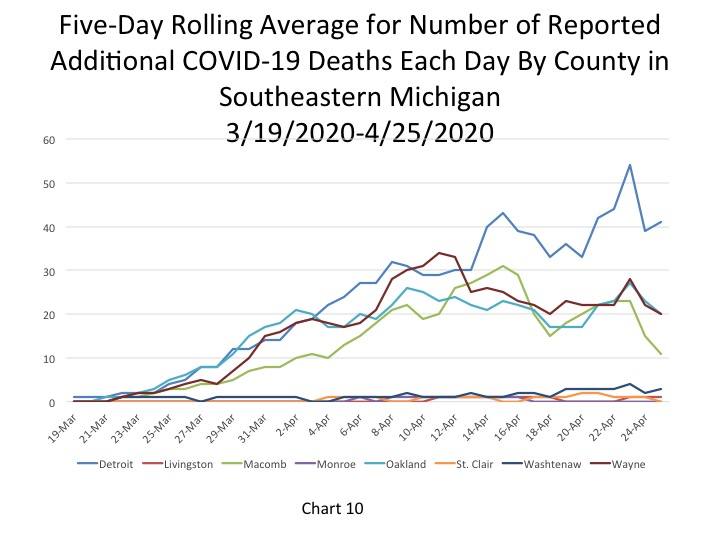
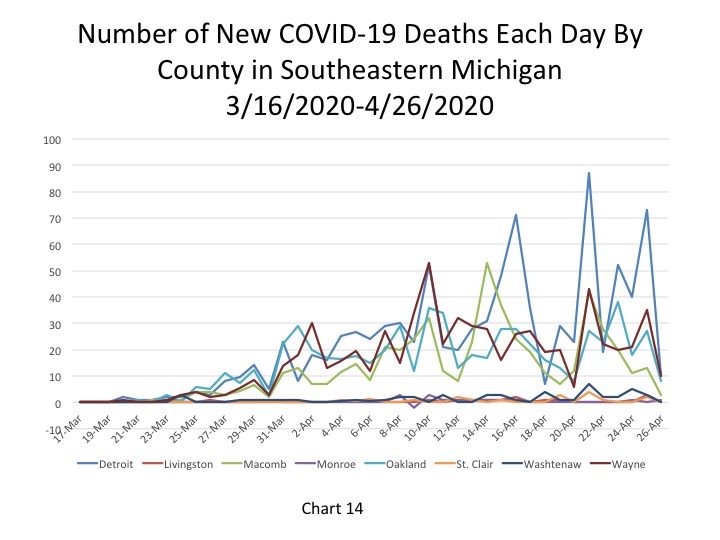
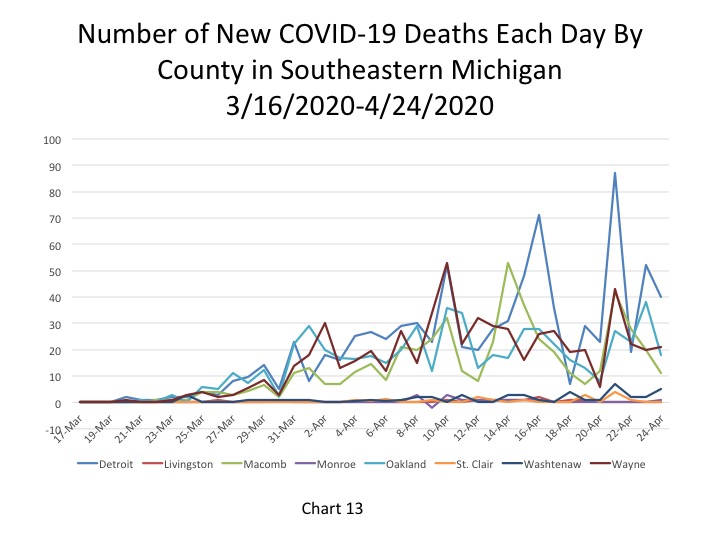
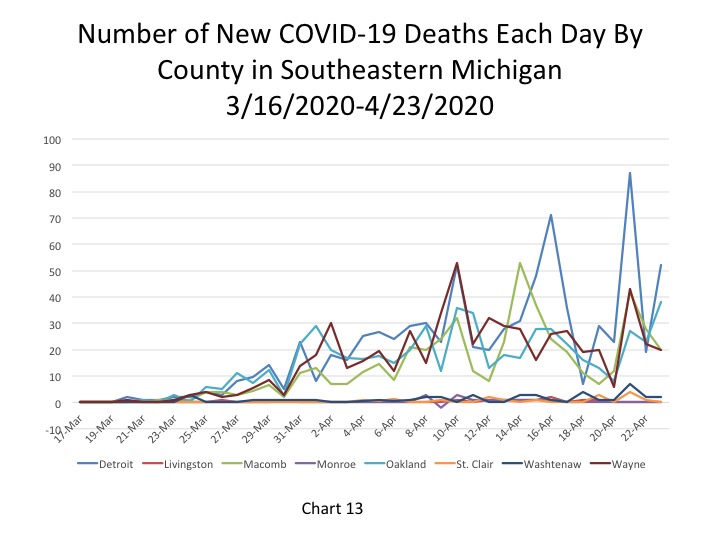
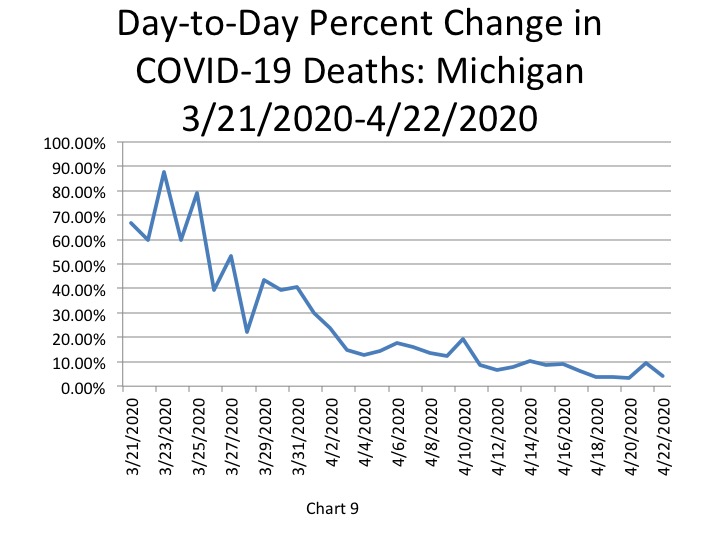
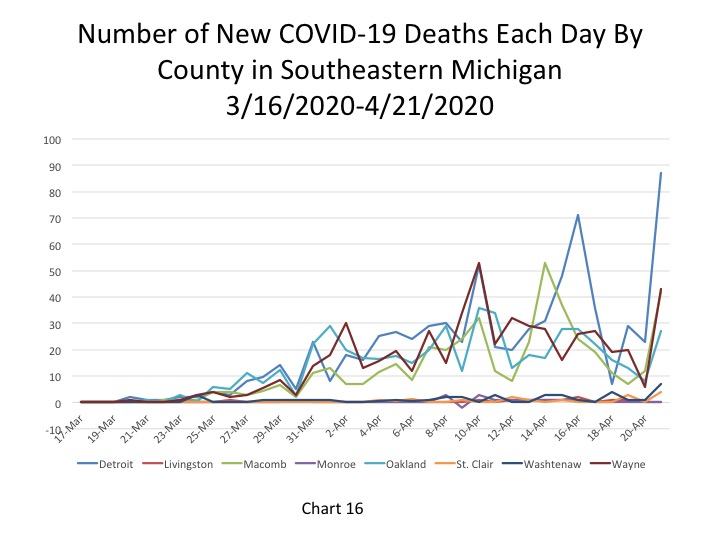
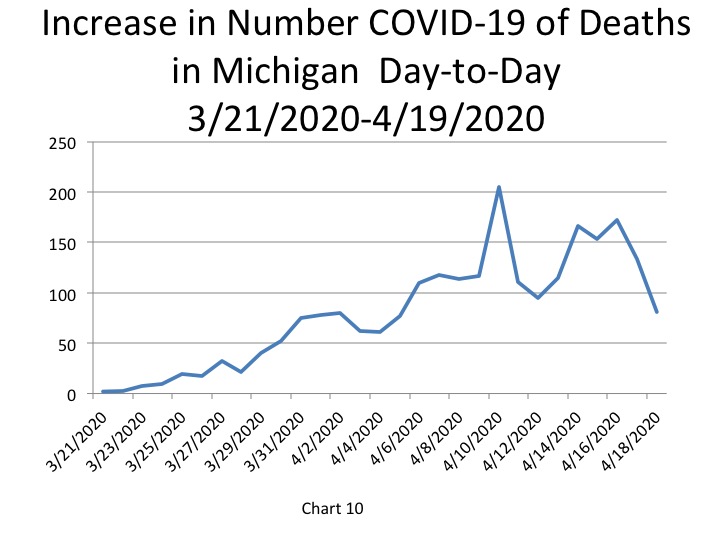
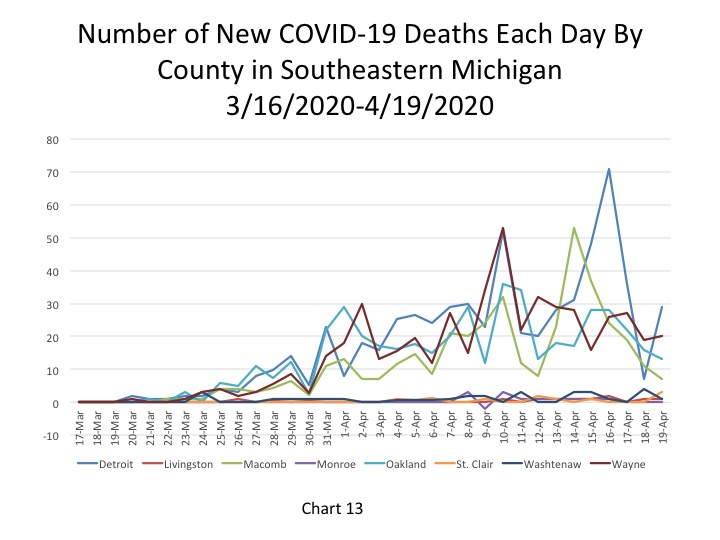
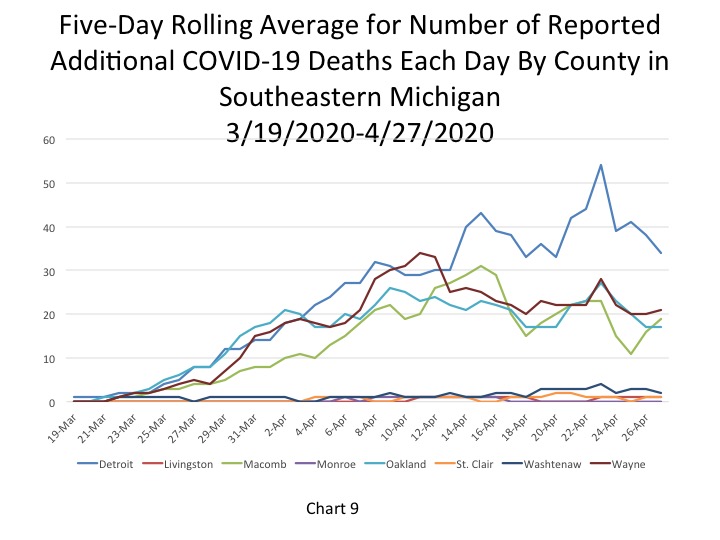
Chart 9 shows how Detroit’s numbers of additional deaths have been declining, which is likely part of the cause of the decline at the state level. The same pattern is occurring in Oakland County’s counts of additional deaths. The number of daily deaths in Macomb County has been increasing over the last several days though.
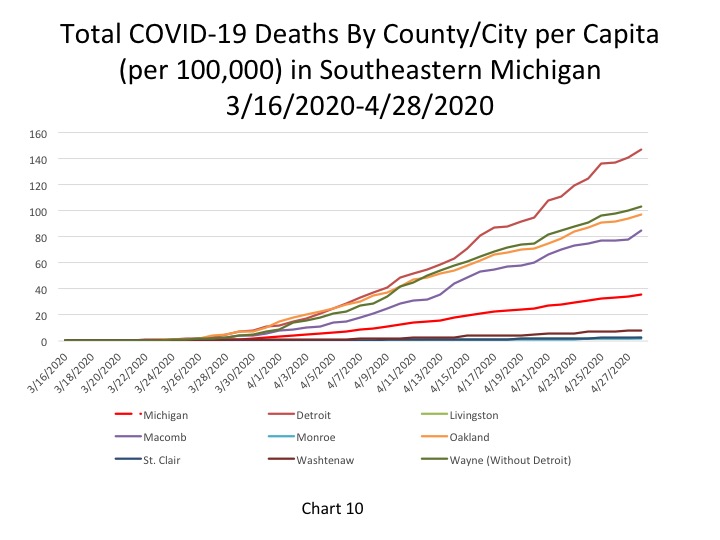
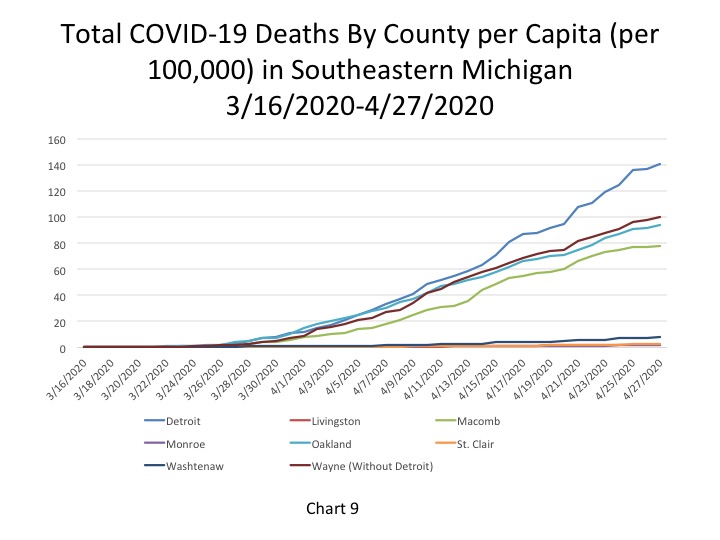
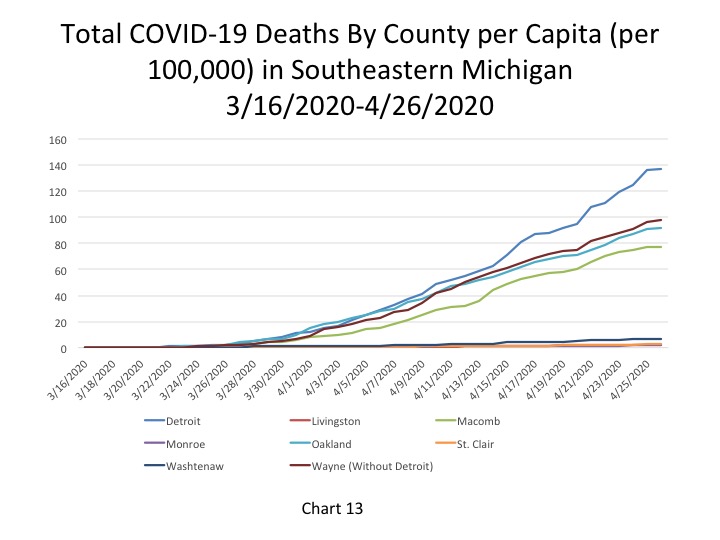
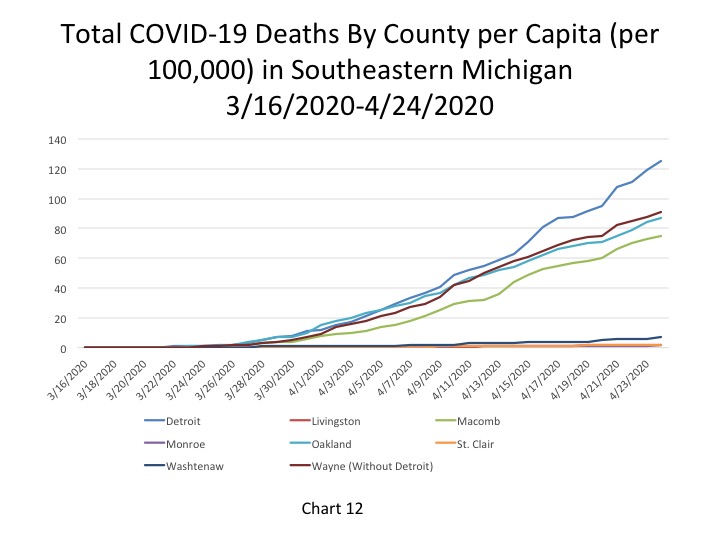
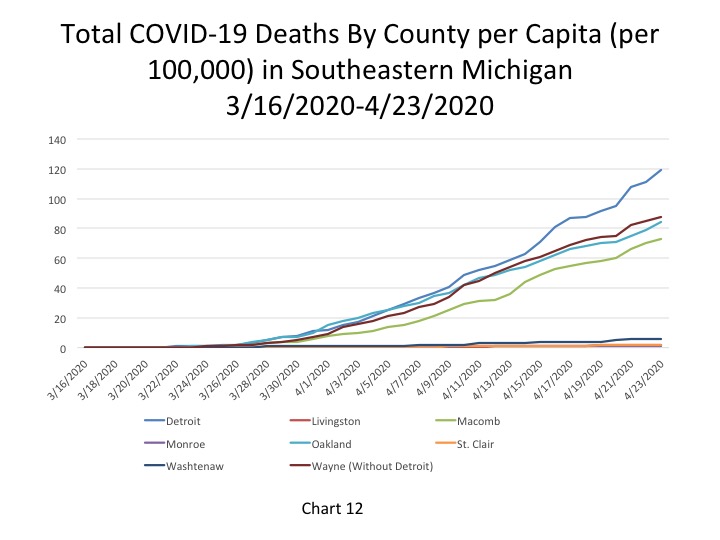
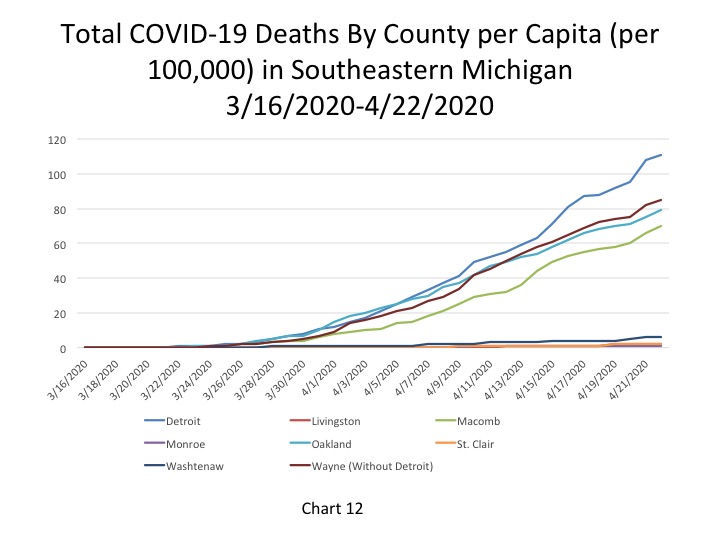
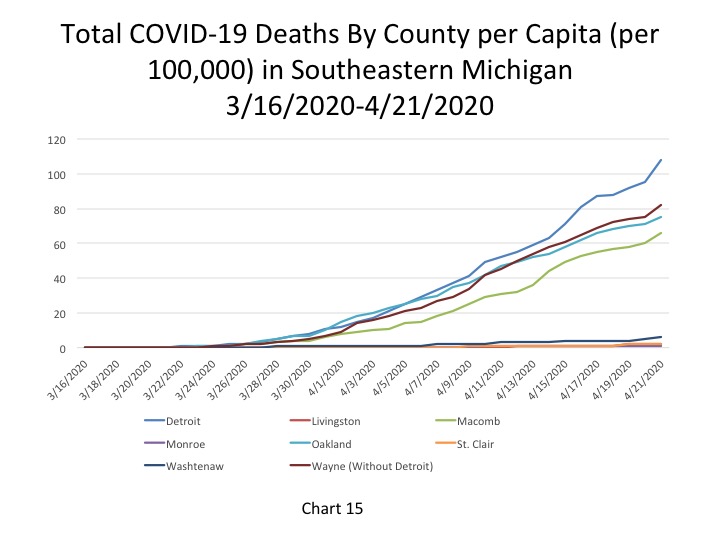
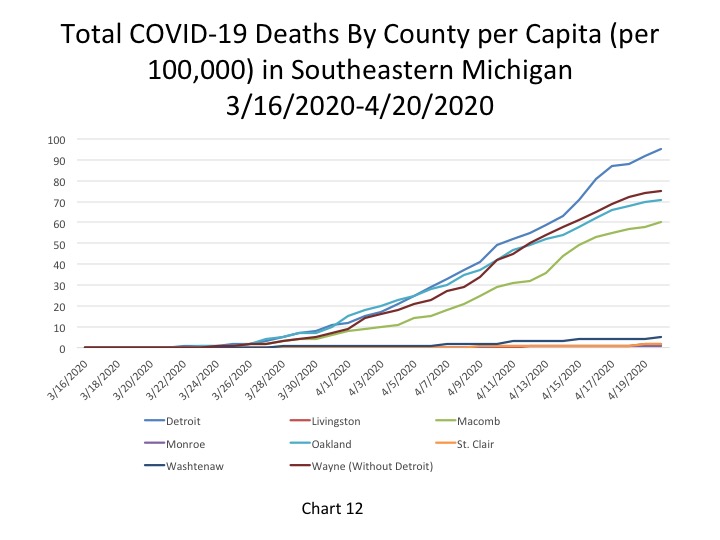
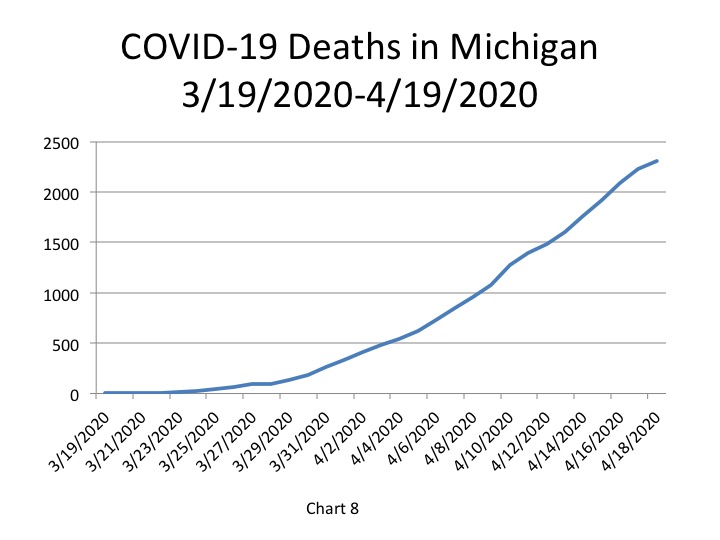
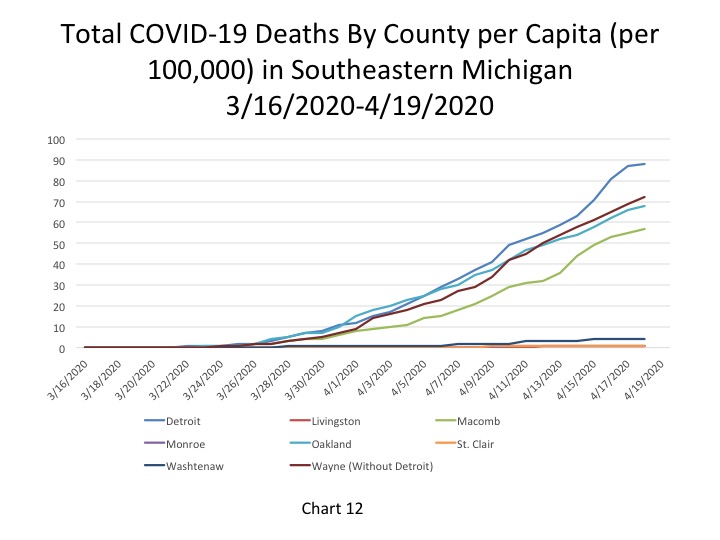
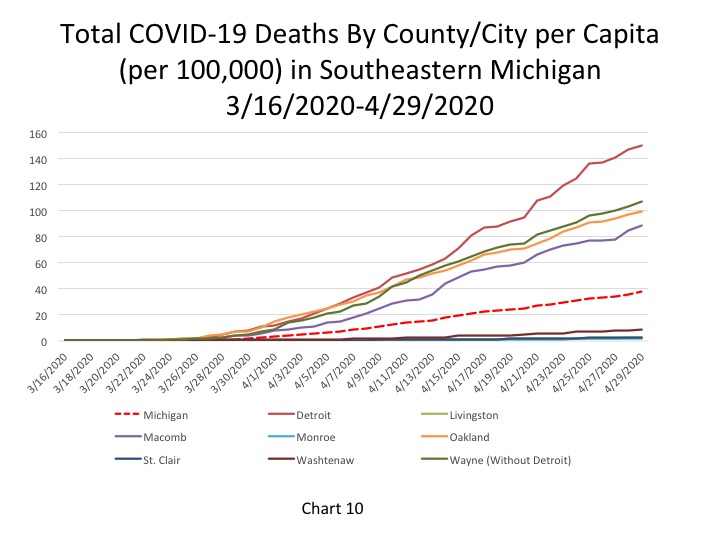
Chart 10 represents the total number of COVID deaths per 100,000 people. For Detroit on April 29 there were 150 COVID deaths per 100,000 people (representing 1,008 deaths). In Wayne County there were 107 COVID deaths per 100,000 people (719 total deaths), in Oakland County there were 99 deaths per 100,000 people (668 total deaths), and in Macomb County there were 89 COVID deaths per 1000,000 people on April 29 (597 total). The State of Michigan had 38 COVID deaths per 100,000 people, a rate which was lower than the four entities discussed above. Wayne and Macomb counties both reported 25 new deaths on April 29; Detroit had 20.
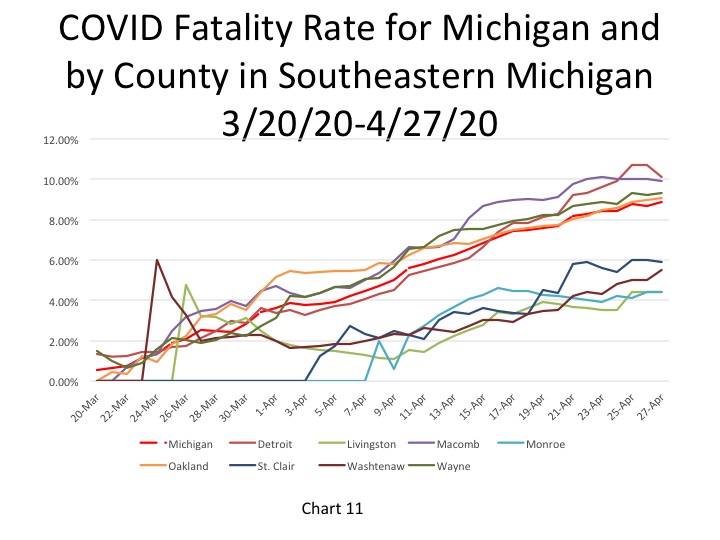
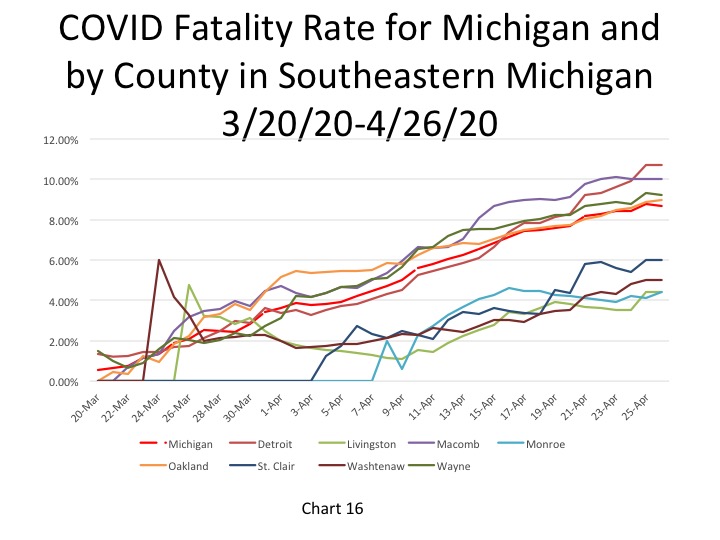
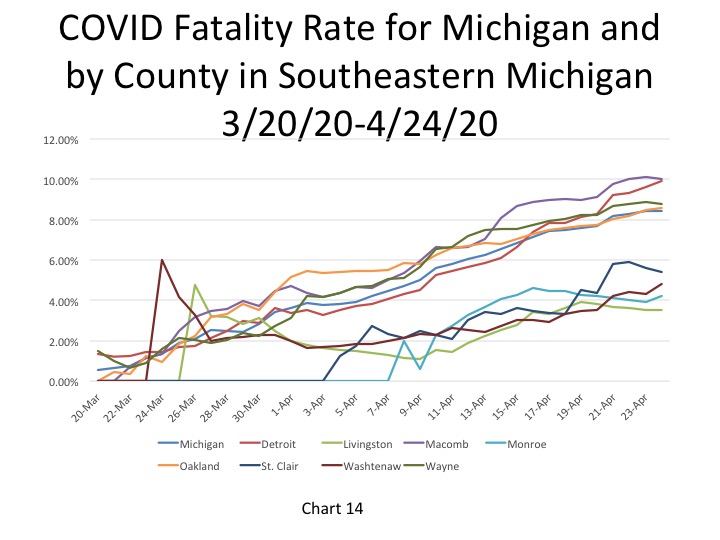
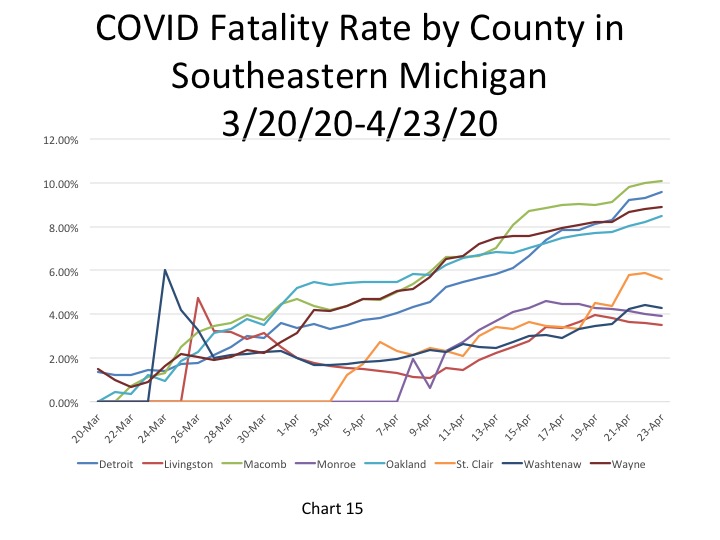
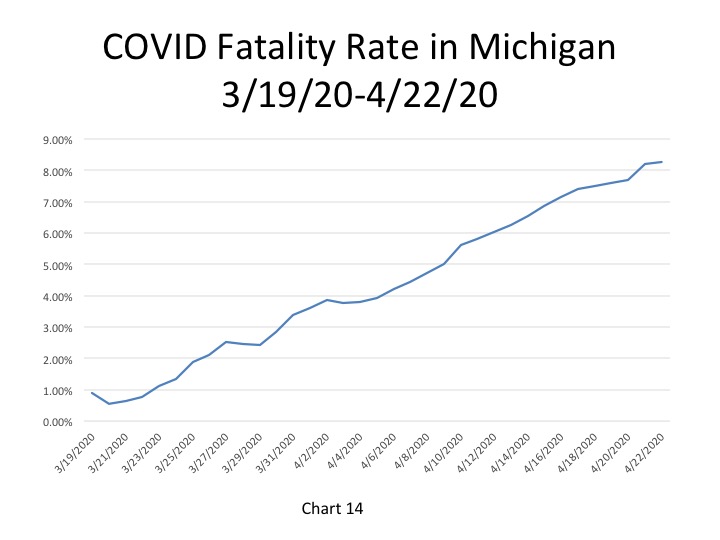
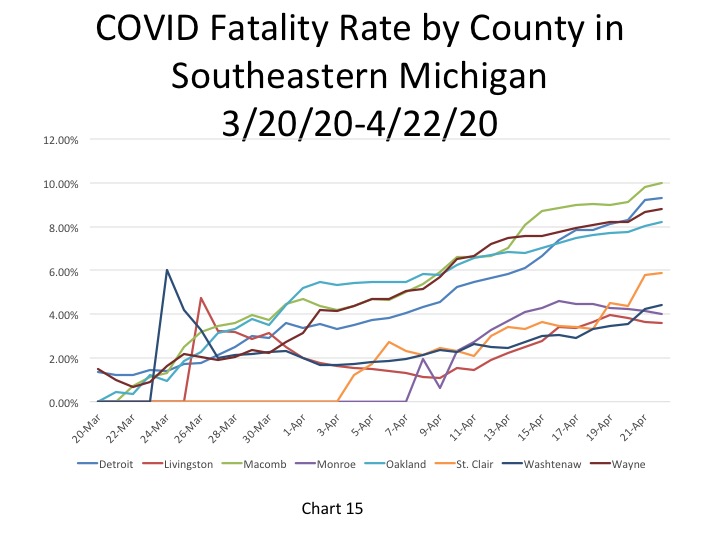
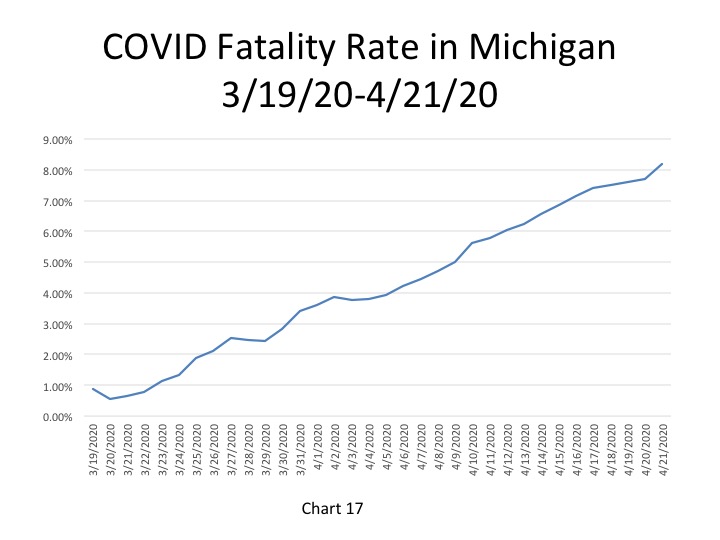
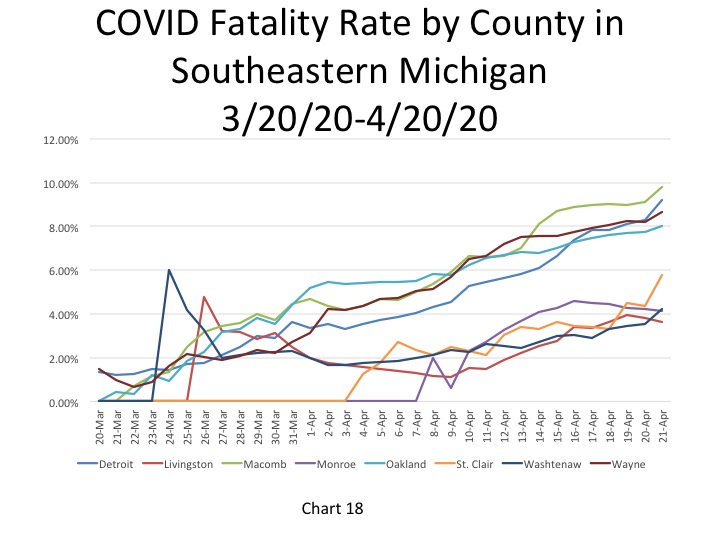
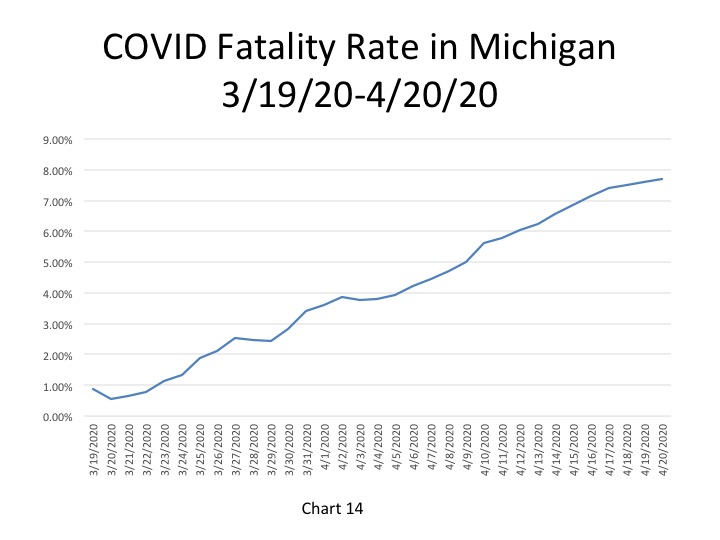
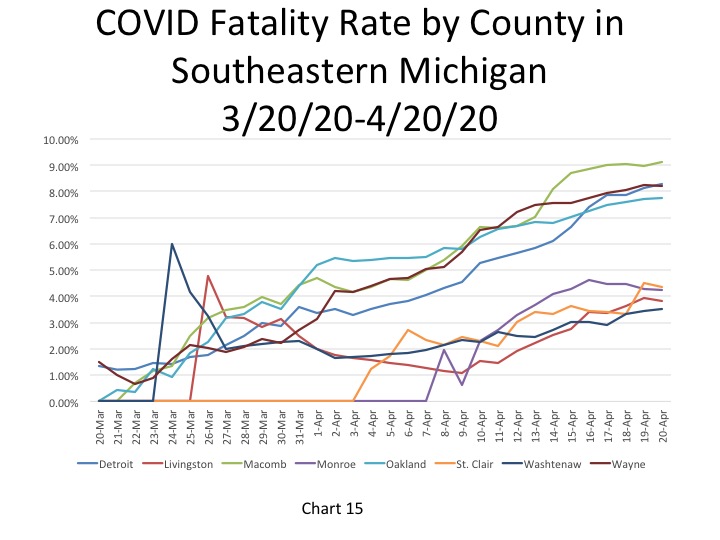
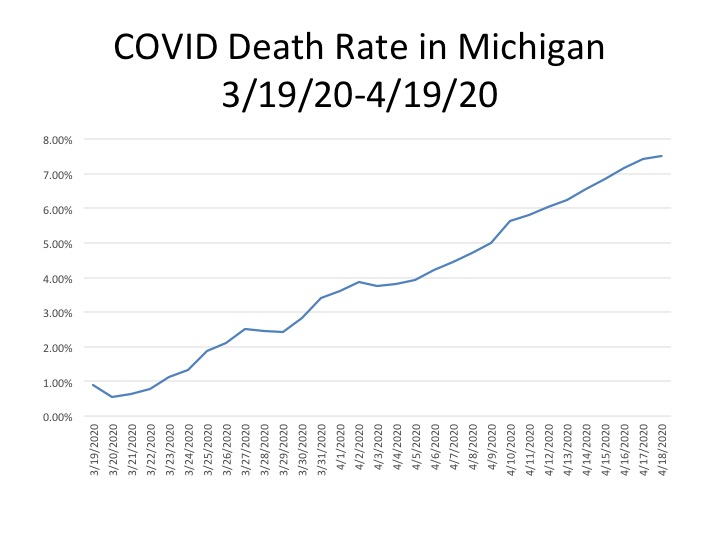
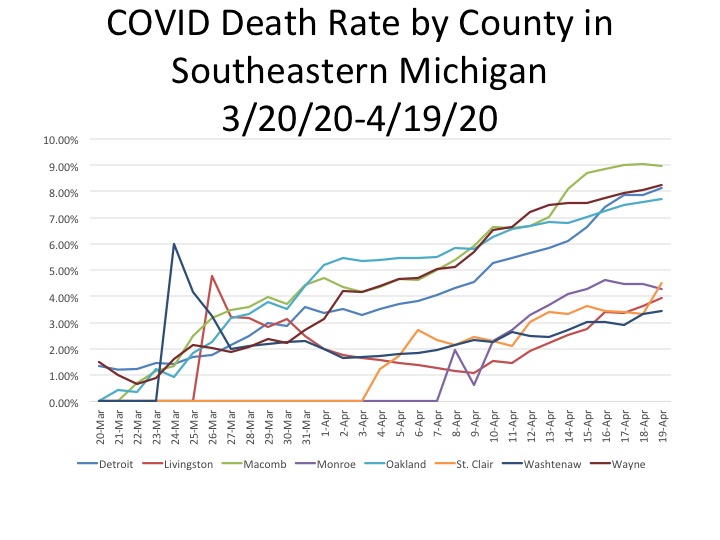
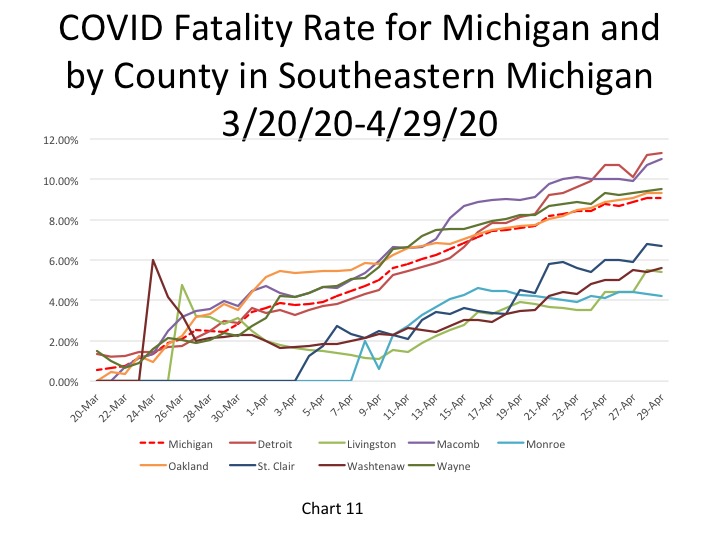
The fatality rate in the City of the Detroit increased to 11.3 percent on April 29, which is higher than the State’s fatality rate (9.1 percent) and the rates of the counties in Southeastern Michigan. The fatality rate in Macomb County continued to increase on April 29, reaching 11 percent for the first time. The fatality rate in Monroe County continued to decline.
The total number of deaths in Detroit surpassed 1,000 on April 29, accounting for 27% of the 3,670 deaths in the State. So, while the number of daily deaths in Detroit has been declining in recent days, it’s clear the overall impact of the virus continues to hit Detroit hard. Detroit has experienced the largest decline in the number of additional COVID deaths in recent days, which could be a cautious sign of hope.