Employment in Detroit Growing, While Unemployment also Increased

  • From December 2015 to March 2016, the unemployment rate across the state remained stable while the city of Detroit’s experienced a slight increase (monthly);
  • Employment in the city of Detroit increased by 8,407 from March 2015 to March 2016 (monthly);
  • The Purchasing Manager’s Index for Southeastern Michigan increased from February 2016 to March 2016 (monthly);
  • Commodity Price Index increased from February 2016 to March 2016 for Southeastern Michigan (monthly)
  • Standard and Poor’s Case-Shiller Home Price Index for the Detroit Metropolitan Statistical Area shows home prices are about $6,900 higher than in January of 2015.

Detroit Unemployment

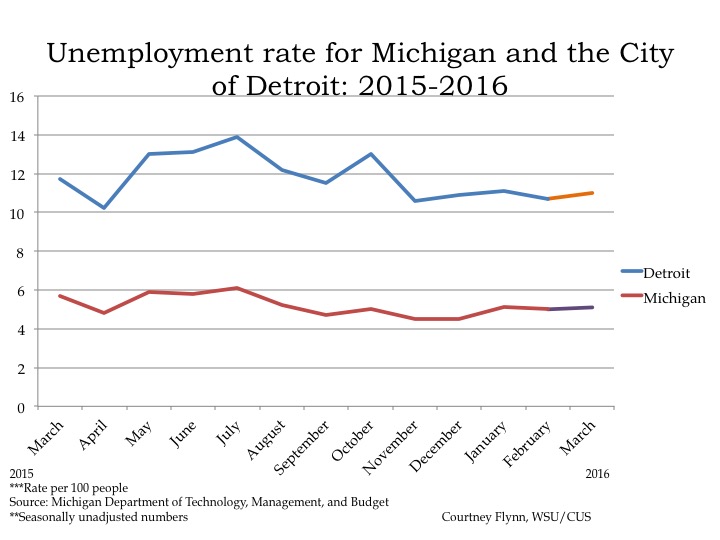
According to the most recent data provided by the Michigan Department of Technology, Management and Budget, the unemployment rate for the State of Michigan increased to 5.1 percent between December of 2015 and March of 2016. During this same period, unemployment in the City of Detroit marginally increased from 10.9 percent in December to 11 percent in March.

Detroit Employed

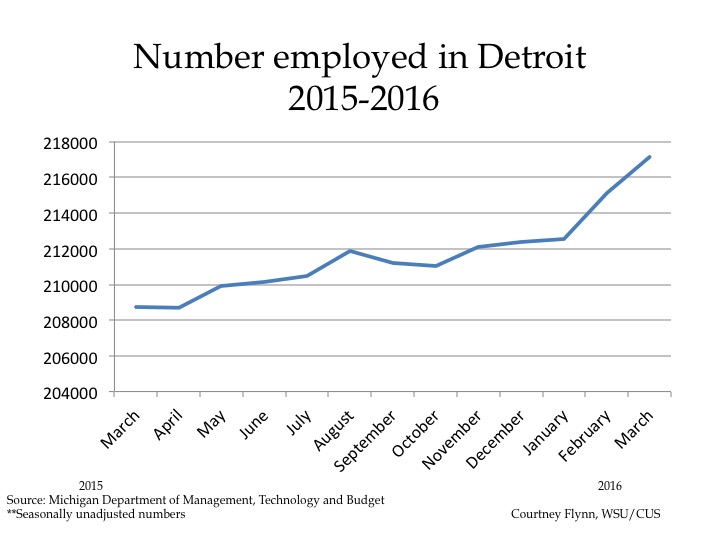
Since March of 2015 the number of employed Detroit residents in the labor force increased by 8,407, to a total of 217,137 in March of 2016. While the month of March in 2015 had the lowest number of Detroit residents employed in the labor force in the last year, March in 2016 has had the highest number of people employed for 2016.

The conundrum of increasing employment and increasing unemployment likely is a result of more people entering the labor market in the city, creating a situation in which more are employed, but more are also looking for work.

Detroit Manufacturing

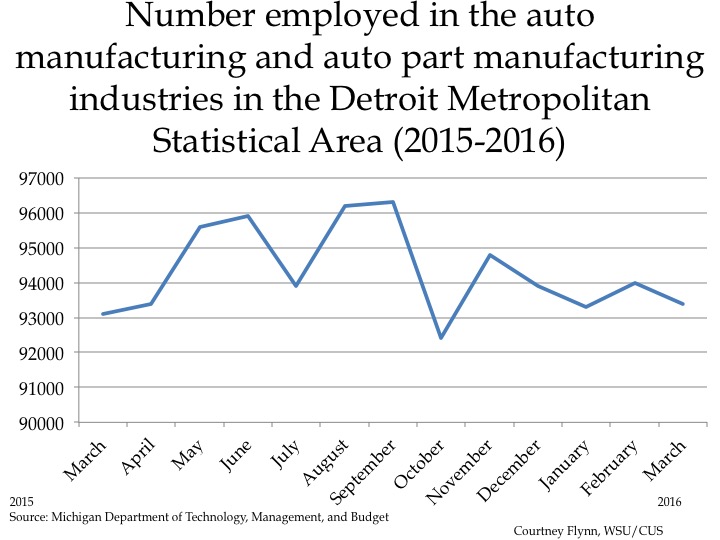
The above chart shows the number of people employed in the auto manufacturing industry in the Detroit Metropolitan Statistical Area (MSA) (Detroit-Warren-Livonia) from March 2015 to March 2016. In that time frame the number of people employed in this industry has increased by 300, from 93,100 to 93,400.

PMI

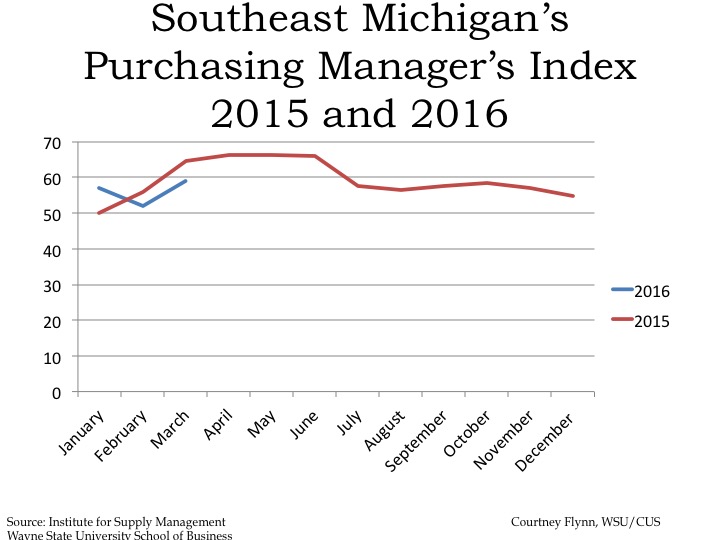
The Purchasing Manger’s Index (PMI) is a composite index derived from five indicators of economic activity: new orders, production, employment, supplier deliveries, and inventories. A PMI above 50 indicates the economy is expanding.

According to the most recent data released on Southeast Michigan’s Manager’s Index, the PMI for March 2016 was 59.1, an increase of 7.1 point from the prior month. This increase is largely representative of the region’s employment, new order and production indexes increasing.

The March PMI was also a decrease of 5.4 from March of 2015.

Commodity Price

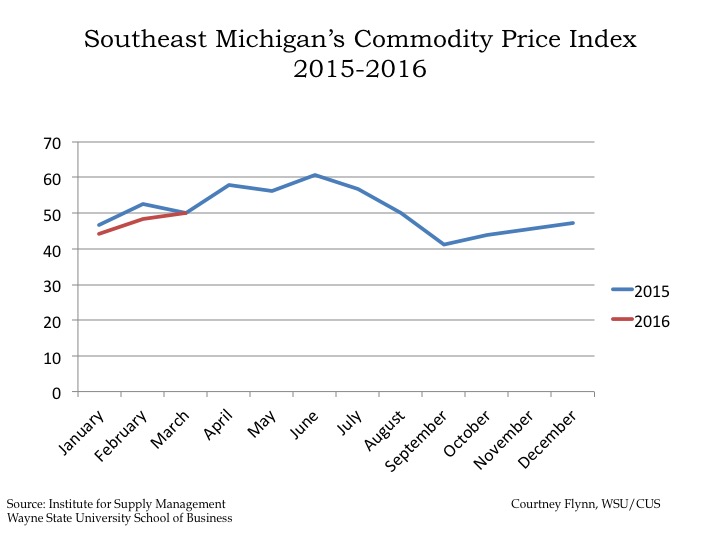
The Commodity Price Index, which is a weighted average of selected commodity prices, was recorded at 50 points in March 2016, which was 1.6 points higher than the previous month and exactly the same as what it was in March of 2015.

Detroit Home Price

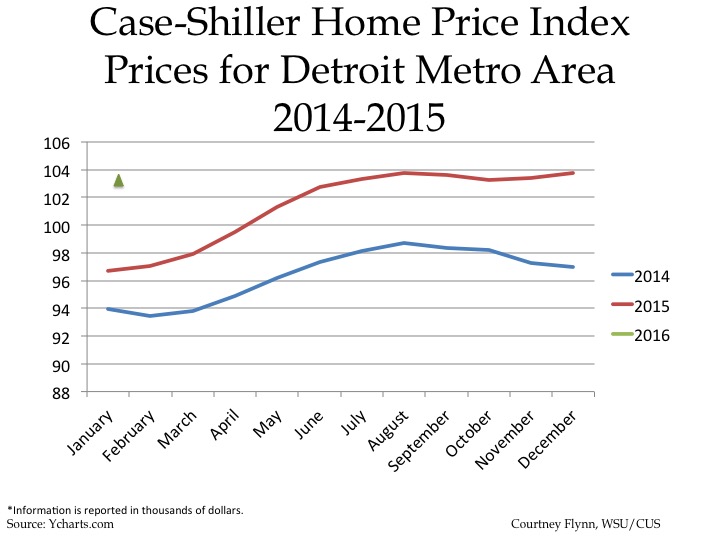
The above charts show the Standard and Poor’s Case-Shiller Home Price Index for the Detroit Metropolitan Statistical Area. The index includes the price for homes that have sold but does not include the price of new home construction, condos, or homes that have been remodeled.

According to the index, the average price of single-family dwellings sold in Metro Detroit was $103,590 in January 2016. This was an increase of $6,890 from January of 2015 and increase of $9,670 from January of 2014.

Southeastern Michigan Anticipating Water Rate Increases

With the proposed wholesale water rate changes for the newly formed Great Lakes Water Authority (GLWA)-which now provides water and sewer services to 127 former Detroit Water and Sewer Department (DWSD) customers-only one of the 89 tri-county customers is expected to experience a rate decrease above 10 percent. That community is the city of Novi and the anticipated decrease between 2016 and 2017 is 23.7 percent. The only other government entities expected to experience a decrease are Bruce Township, the city of Warren and the Southern Oakland County Water Authority (which is made up of Royal Oak, Berkley, Clawson, Huntington Woods, Pleasant Ridge, Southfield, Beverly Hills, Lathrup Village, and Bingham Farms). The reason for Novi’s expected wholesale water rate decrease is because of a water reservoir that went online in the city in July of 2015. This reservoir allows the city to hold up to 1.5 million gallons of water; it is filled nightly when demand and costs are lower and discharged at peak hours during the day, according to the Hometown Life article.

While wholesale rate decreases are expected to occur for a select few communities, wholesale rate increases are anticipated to be the norm for the region. The overall average wholesale rate increase for the region is expected to be about 6.1 percent, but Royal Oak Township’s expected increase is estimated to be about 20 percent. New Haven and Romeo were the only other two government entities in the GLWA that are expected to experience a wholesale water rate increase above 10 percent. New Haven is expected to experience an increase of about 14 percent, and Romeo is expected to have an increase of about 12 percent.

Charges for water service are a combination of a monthly fixed cost (which are associated with infrastructure costs) and metered usage. According to an interview the Detroit News held with the GLWA, monthly fixed costs make up about 60 percent of what the GLWA charges a community, and the remainder is metered usage. At the time of this post it is unclear why fixed costs vary so vastly from one government entity to another. However, this is a question Drawing Detroit will be further investigating.

GLWA

GLWA Rate Change

While both Novi and Bruce Township are expected to have wholesale rate decreases, they are two of 22 communities in the GLWA that had 2016 commodity costs above $10 per million cubic feet (mcf). Bruce Township had the highest commodity price per mcf of all the GLWA customers at $22.82 per mcf. Additionally, the township’s fixed wholesale monthly cost was $2,200 in 2016. In 2017 that fixed monthly cost is expected to increase to $2,300, and the commodity price is expected to be $21.44 per mcf. This represents a 6 percent wholesale rate decrease. For Novi, the 2016 cost per mcf is $16.99 with a fixed monthly cost of $560,000; for 2017 those numbers are expected to decrease to $12.96 per mcf and $475,000, respectively.

Royal Oak Township, which is expecting a 20 percent rate increase, has a current commodity cost per mcf of $6.85 and a fixed monthly cost of $10,300. Those numbers are expected to be $8.23 per mcf and $12,400, respectively.

As noted throughout this post, the 2017 rates and costs discussed here are expected; the GLWA has yet to vote on the regional rates and costs. The vote is expected to come in the coming weeks though so the wholesale rates and fixed costs can become effective on July 1, 2016. The proposed figures used for this post were made public by the GLWA in March of 2016.

Additionally, while wholesale rates were discussed in this post, each individual community has the opportunity to set water rates above the wholesale rates set by the GLWA. These rates are known as the retail rates and are ultimately what the customers pay.

GLWA Commodity Costs

GLWA Fixed Costs

The city of Detroit was not included in this post because when the GLWA was formed the city of Detroit was able to maintain operations of its water and sewer infrastructure. DWSD still legally owns the water and sewer infrastructure it used to service the now GLWA members with, but the creation of this regional authority allows the GLWA to lease water and sewer infrastructure from the city of Detroit for 40 years at a cost of $50 million a year.

Northville Public Schools have top ACT scores in region

For several years Michigan has required juniors in high school to take the ACT as part of their preparation for college. The overall results recently became available. For the 2014-15 academic year, Washtenaw County had the overall highest average ACT composite scores at 22.5, but it was the Northville Public School District in Wayne County that had the highest composite score for the 110 districts in Southeastern Michigan. At 24.6 (out of 36 points), Northville Public Schools had the highest ACT composite score and it was the Pontiac City School District in Oakland County that had the lowest score in the region at 14.3. The Pontiac City School District was one of nine districts in the region with ACT scores below 16. Another one of the nine school districts with an ACT score below 16 was the Detroit Public School District with an ACT composite score of 14.9. Wayne County had six of those nine districts with ACT composite scores below 16.

With a state average ACT composite score of 19.9 for the 2014-15 academic year there were 52 districts in the region that outranked the overall state score. Livingston County had the highest percentage of districts with ACT composite scores above the state average of 19.9 at 100 percent and Macomb County had the lowest percentage of districts at 24 percent.

The ACT test has been given across the United States as one way to measure a high school student’s readiness for college. It is a standardized college entrance exam where students are tested on math, English, social studies and natural sciences. In 2007 when the state started using the ACT test as the state-wide accepted exam. The 2014-15 academic year was the last year Michigan students were given the ACT though as a standardized test, and instead they will be taking a revamped SAT test, one that the state has concluded is more in line with college readiness standards, is lot less expensive, but some say is also more difficult.

Michigan also uses a standardized test for assessment of students’ academic progress. The current test is the M-STEP (Michigan Student Test of Educational Progress), which replaced the MEAP (Michigan Educational Assessment Program). This week is when M-STEP testing begins in Michigan schools.

SEMI_ACTScores

MISchools_ACTScores

Wayne County’s population loss remains the largest in the region—2010 to 2014

Between 2010 and 2014 Oakland and Washtenaw counties were the only two counties in the seven-county region that experienced a population change increase. According to U.S. Census Data, Oakland County’s population increased from 1.2 million in 2010 to 1.24 million in 2014 and Washtenaw County’s population increased from about 345,000 to 357,000. In Oakland County, three communities-Clarkston, Orchard Lake and South Lyon-experienced more than a 10 percent population increase. In Washtenaw County, there were also three communities-Bridgewater, Sharon and Lima townships-that experienced a population increase above 10 percent between 2010 and 2014.

In the same time frame, Wayne County experienced a 3 percent population decrease. In 2010 Wayne County’s population was about 1.82 million and in 2014 it was about 1.79 million. Of the communities that make up Wayne County, Highland Park had the largest population decrease at 13.5 percent; in 2010 the city’s population was 11,776 and in 2014 it was 10,375. Detroit’s population change was a decrease of 8.4 percent between 2010 and 2014. In 2010 Detroit’s population was 713,777, and in 2014 it was 680,250 . At the Census Tract level we see that most of the population loss above 10 percent occurred in neighborhoods along the eastside of the City of Detroit. Compared to the 43 Census Tracts in Detroit that lost more than 10 percent of its populations between 2010 and 2014 there were 24 Census Tracts that experienced a 50 percent or more population increase. Overall, at the Census Tract level, more areas in the City of Detroit experienced population increases than decreases, however, the number of people lost in certain Census Tracts is what caused the overall population decrease.

Slide3

Slide4

Between 2000 and 2010 there were larger decreases (as might be expected given the longer time period) and smaller increases in population across the seven county region. Again, Wayne County had the largest population decrease of the seven counties. In 2010 Wayne County’s population was recorded at about 2 million and in 2010 it was about 1.82 million. The more rural counties-Livingston, Washtenaw and Macomb-experienced population increases above 4 percent between 2000 and 2010. At the more local level, only four communities-Independence Township, Sylvan Township, Detroit and Highland Park-experienced population decreases above 20 percent. Most of the population loss throughout the region was concentrated around Detroit and its inner-ring suburbs. When discussing the communities that experienced population increases above 20 percent, Livingston County, which had the highest population increase between 2000 and 2010 of the seven counties, had the largest number of communities with such high population increases. In Wayne County, which experienced an overall population decrease, only three communities-Northville, Woodhaven and Brownstown-experienced population increases above 20 percent. Two of those communities-Woodhaven and Brownstown-are located in the southern portion of Wayne County, and Northville is located in the northwestern portion of the county.

Slide7

Slide8