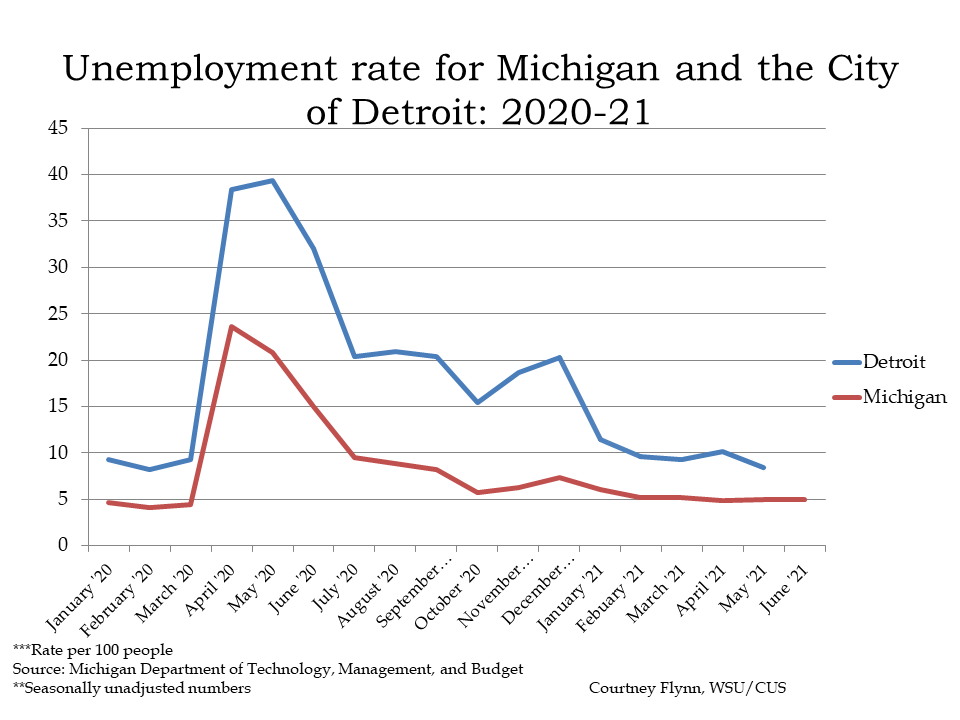
In June of 2021 the unemployment rate for the State of Michigan remained stable, and lower than a year ago, while the rate for the City of Detroit continued to decline through May of 2021. The State of Michigan reported an unemployment rate of 5 in June, which is the same as its May and April rates. Since April of 2020 the State’s unemployment rate has declined from 23.6 to 5. For the City of Detroit, the unemployment rate for May of 2021 was 8.4, which is 1.8 points lower than the April unemployment rate and 31 points lower than the March 2020 rate, which is the highest rate in at least the last two years.
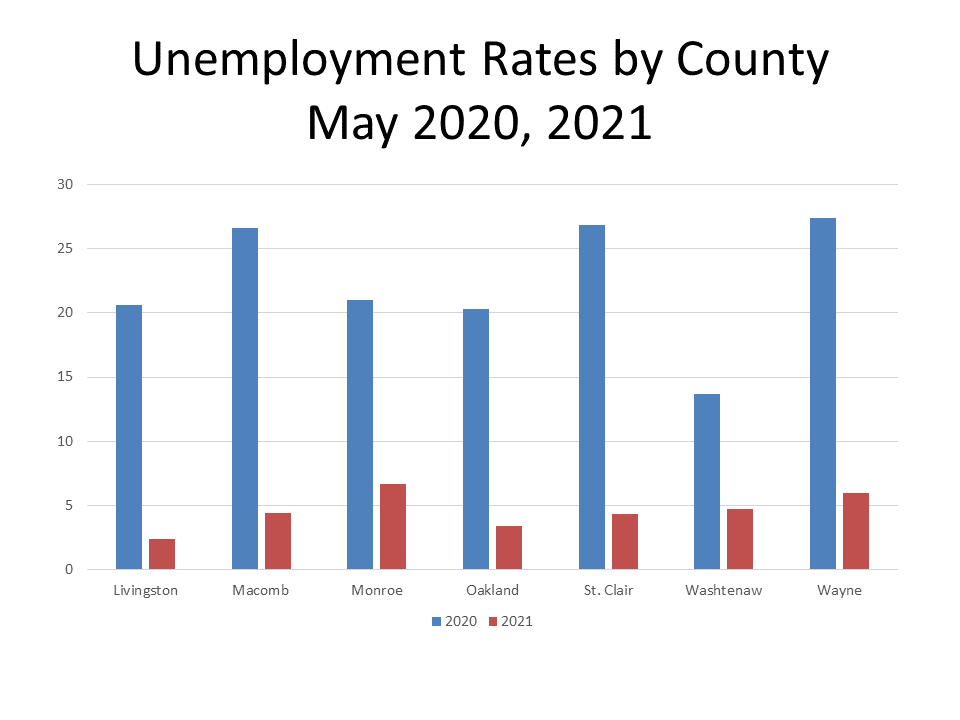
The chart above shows how unemployment rates have greatly declined over the last year and are remaining both stable and low. The chart below reflects a similar message, but highlights just how high unemployment rates were throughout Southeastern Michigan during the pandemic. In May of 2020, Wayne County had the highest unemployment rate at 27.4 percent. Three counties in the region had unemployment rates above 25 percent; Macomb and St. Clair counties had unemployment rates of 26.6 percent and 26.8 percent, respectively.
Between May of 2020 and May of 2021 St. Clair County had the largest difference in unemployment rates at 22.5 percent; in May of 2020 St. Clair County’s unemployment rate was 26.8 percent and in May of 2021 it was 4.3 percent. Washtenaw County had the smallest difference in unemployment rates in that time frame at 9 percent; Washtenaw County had a 13.7 percent unemployment rate in May of 2020 and a 4.7 unemployment rate in May of 2021.
In May of 2021 Livingston County had the lowest unemployment rate at 2.4 percent while Monroe County had the highest at 6.7 percent.
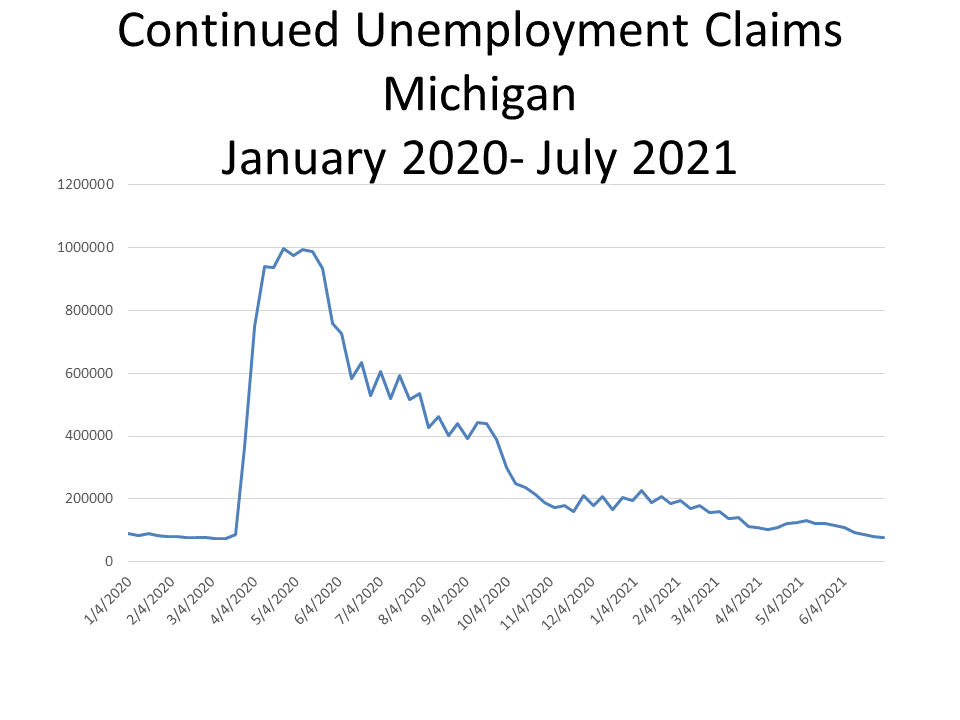
The number of state unemployment claims directly reflect the unemployment rates regionally and statewide. These claims, also referred to as insured unemployment, are the number of people who have already filed an initial claim and who have experienced a week of unemployment and then filed a continued claim to claim benefits for that week of unemployment. Continued claims data are based on the week of unemployment, not the week when the initial claim was filed, according to the Southeastern Michigan Council of Governments.
The chart below shows a spike in April and May of 2020, when COVID restrictions tightened throughout the State. Since then though there has been a steady decline in the number of continued claims. The largest declines occurred between May and June of 2020 and September and November of 2020. Although the recent overall trend has been a decline in claims, there was a slight increase in the middle of April and into early May of 2021, but even then, those numbers are among the lowest reported since January of 2020. However, as July 3, 2021 there were 76,786 continued unemployment claims, the lowest number reported since January of 2020.
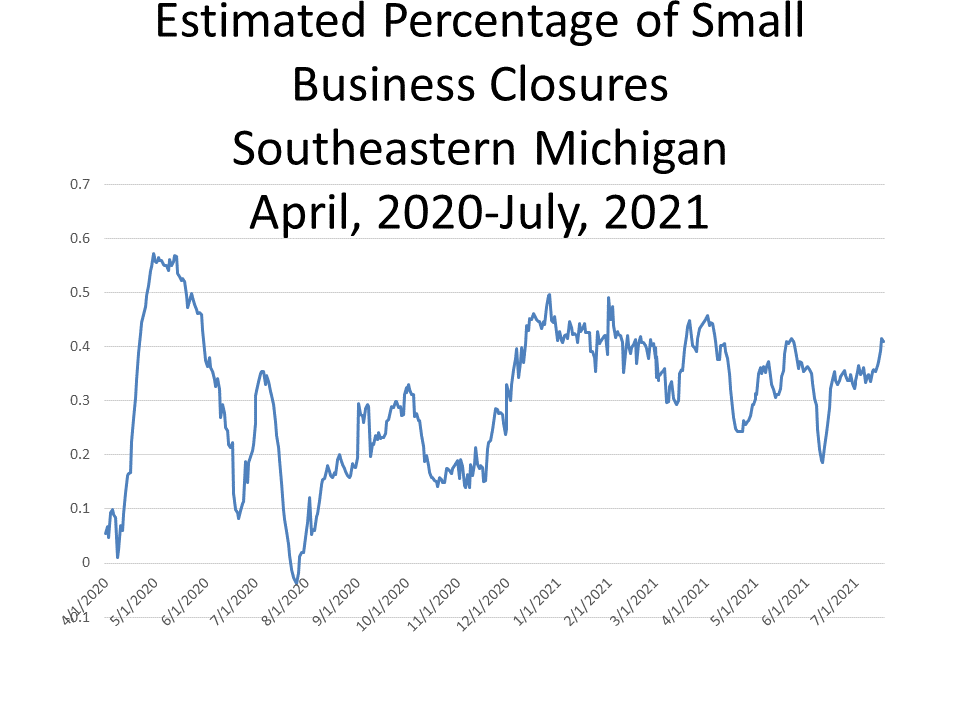
Although unemployment numbers have been on the decline, there has been a recent increase in the number of small business closures, according to the Opportunity Insights Economic Tracker. This source uses credit card transaction data from 500,000 small businesses, Opportunity Insights estimates closures from the number of small businesses not having at least one transaction in the previous three days. The data cover many industries, including healthcare services, leisure and hospitality, and retail and transportation. The data source does say it has less coverage in manufacturing, construction, and finance.
According to the data, 41 percent of small businesses closed as of July 18, 2021. This number was an increase from the 32 percent of small business that were estimated to be closed on June 18, 2021.
The data shows that although small business closures at not as prevalent as at the beginning of the pandemic they are still closer to the high mark, rather than the low mark. There were significant drops in small business closures, such as in June and July of last year and those decreases could be related to the release of government aide at that time and a loosening of COVID restrictions.
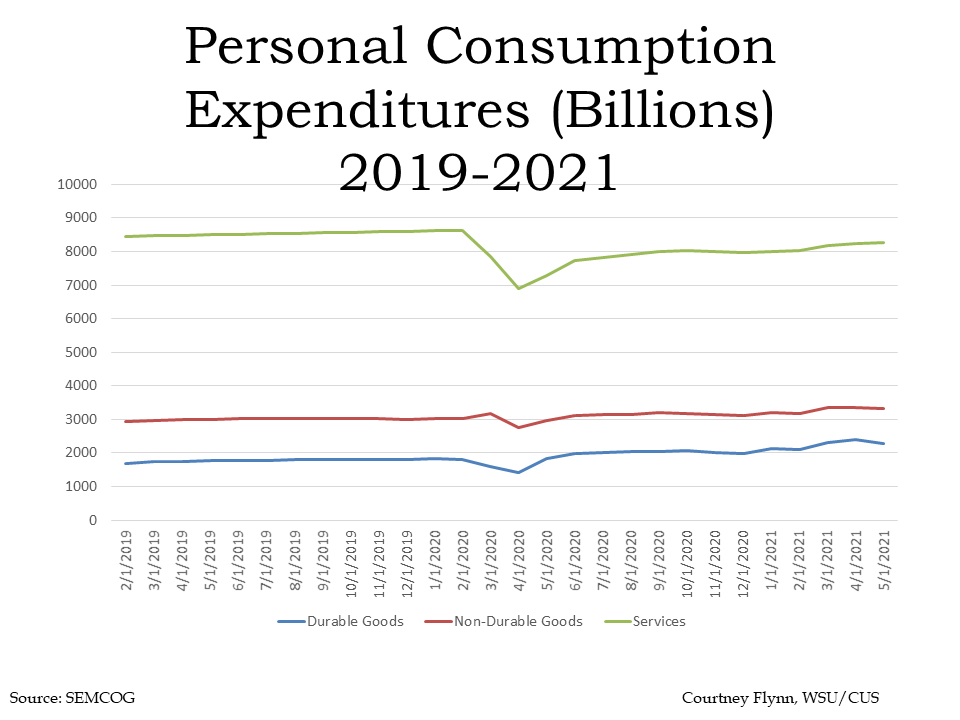
Below shows the consumption expenditures of goods in the U.S. between 2019 and 2021. According to the U.S. Bureau of Economic Analysis, durable goods have an average useful life of at least 3 years (e.g. motor vehicles) while nondurable goods have an average useful life of less than 3 years (e.g. food) and services are commodities that cannot be stored or inventoried and are consumed at the time of purchase (e.g., dining out). The chart below shows how consumption of services continues to remain steady, but not back to pre-COVID levels. On May 1, 2021 it was estimated that there was $8,263 billion in consumption of services, a continued increase in consumption dollars but not yet at pre-pandemic levels.
The expenditures on durable and non-durable goods are however now above pre-COVID levels with the amount spent on durable goods being $3,338 billion as of May 1, 2021 and the amount spent on non-durable goods being $2,294 billion.
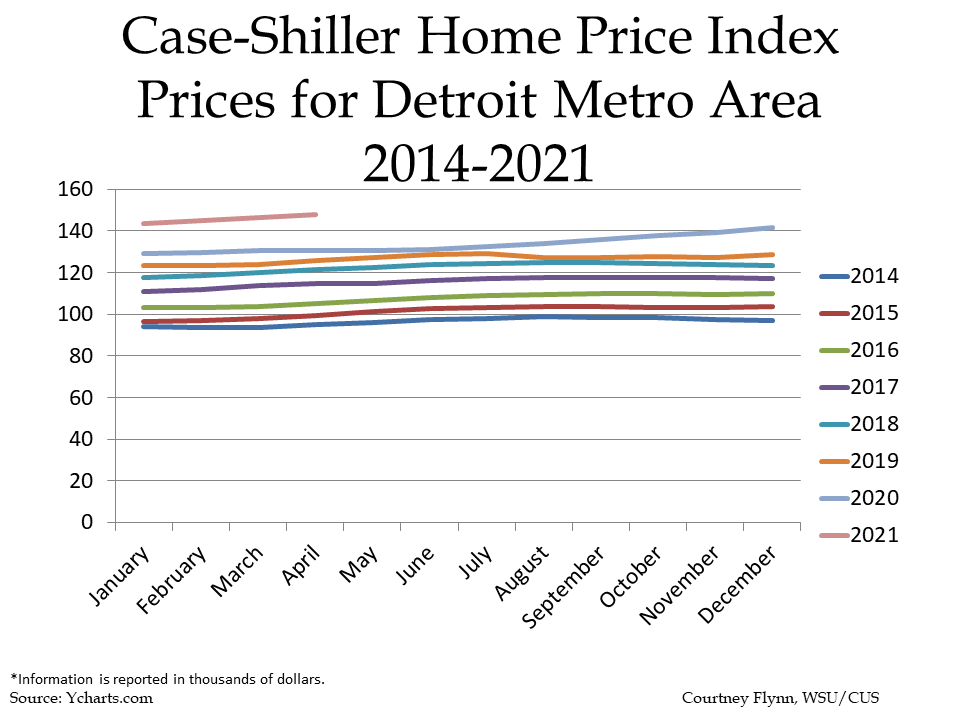
According to the Case-Shiller Home Price Index, the average price of single-family dwellings sold in Metro Detroit was $147,900 in April of 2021; this was $1,450 higher than the average family dwelling price in March. The April 2021 price was an increase of $14,050 from April of 2020 and $53,030 from April of 2014. Certainly, home prices have continued to increase year-after-year but the recent average price of single-family dwellings sold in the Metro-Detroit area has increased at a higher rate than in previous years. This is highlighted by the fact that the $14,050 increase in sale prices since 2020 is 25 percent of the overall increase in home prices since 2014 ($53,030).