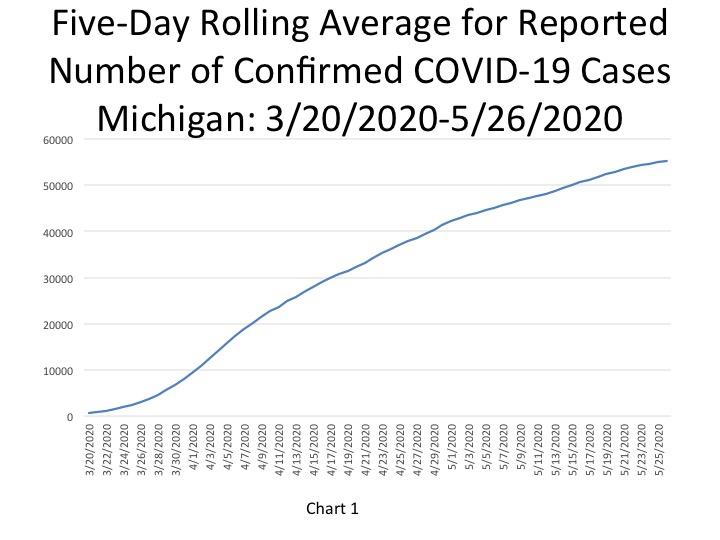
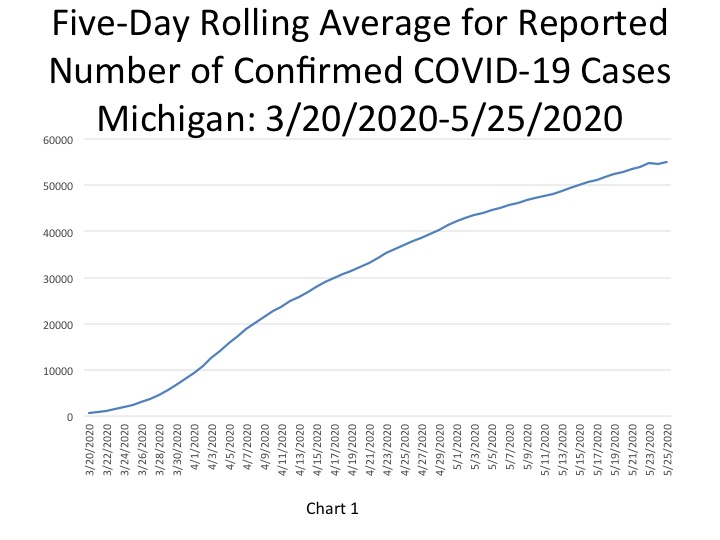
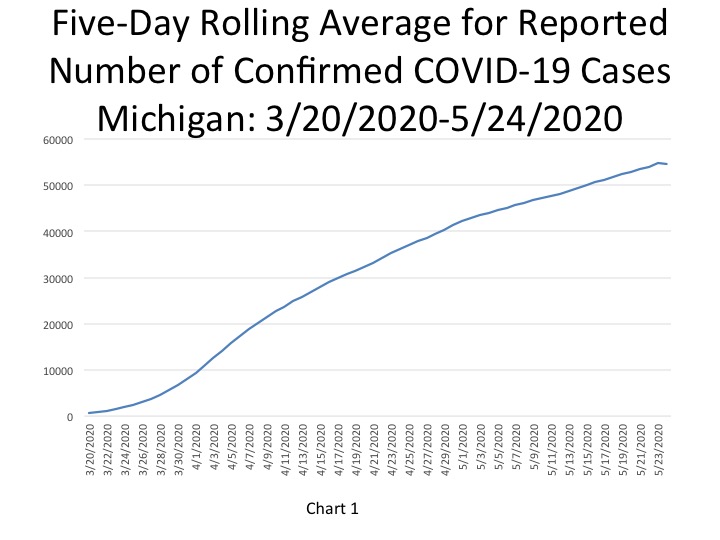
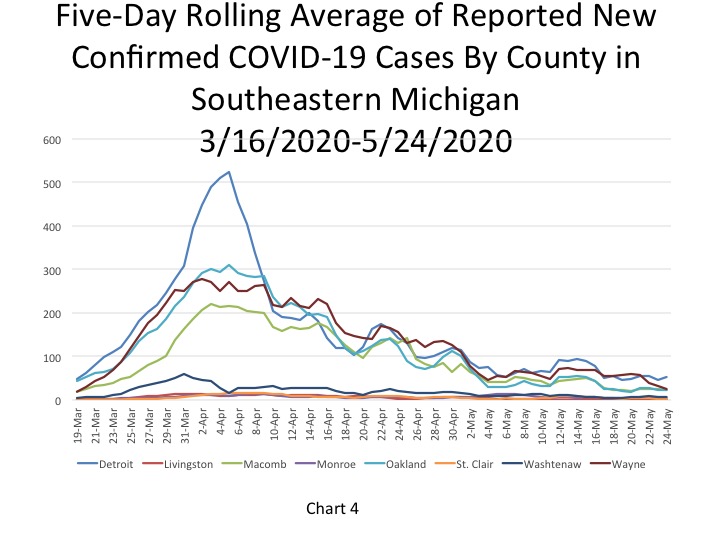
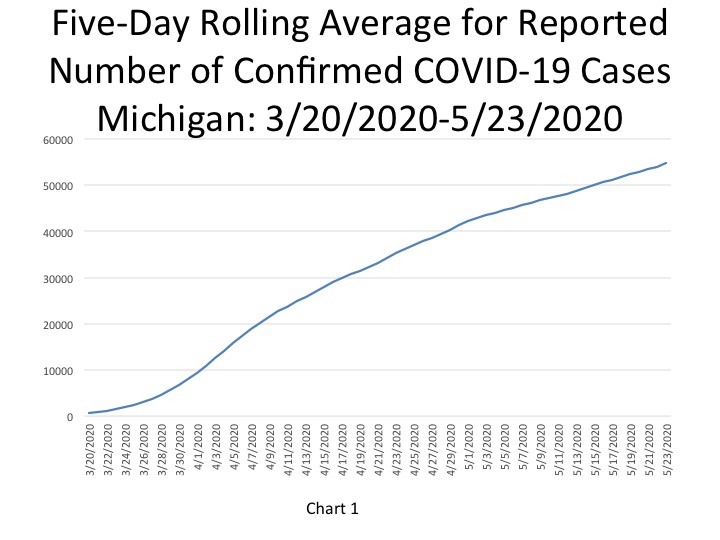
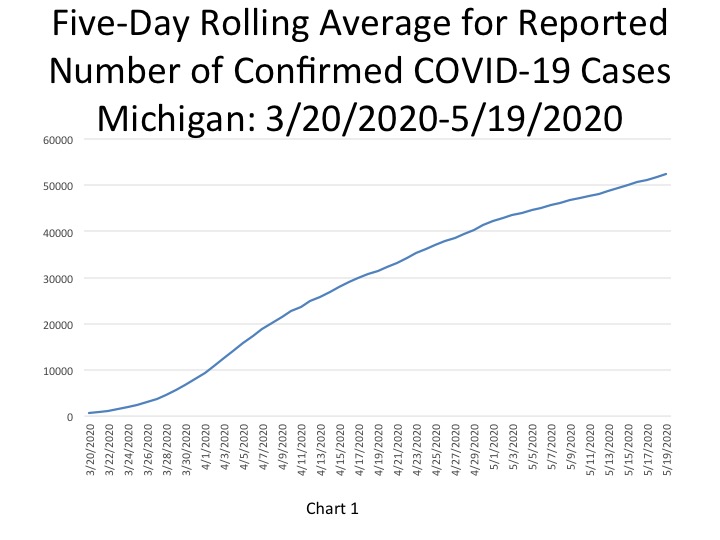
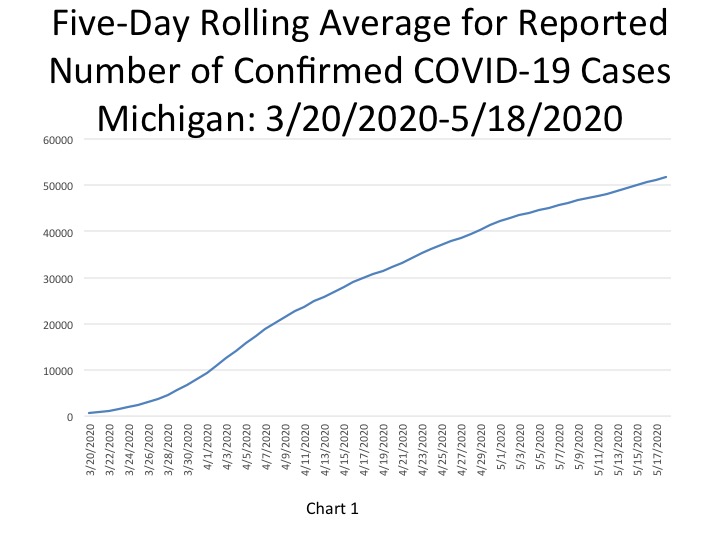
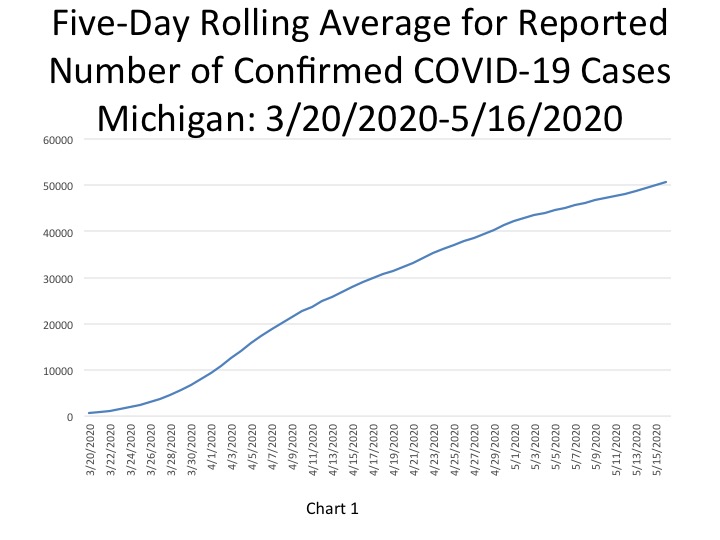
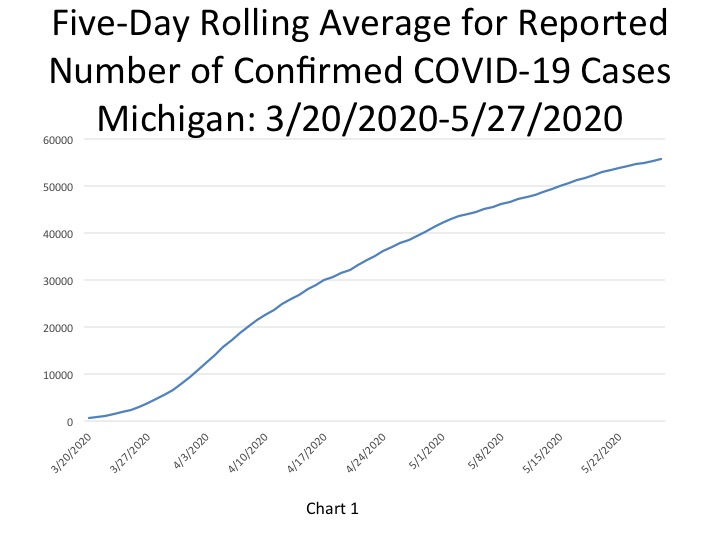
According to the State of Michigan, the total number of COVID cases in Michigan rose to 56,621 on May 29, an increase of 607 cases from the previous day. This total was equivalent to 561 cases per 100,000 people (Chart 4). Of those 607 cases 248 were documented in Southeastern Michigan. This means that of the new daily COVID cases, Southeastern Michigan accounted for 41 percent of them. These numbers again show that majority of the new cases being reported in Michigan are coming from outside of Southeastern Michigan. In Chart 1 we show that the State total for number of COVID cases on May 27 was 55,646. The five-day rolling average for the total number of COVID cases (Chart 1) reflects a smoother curve and adjusts for fluctuations in testing and/or the quality of reporting or failure to report.
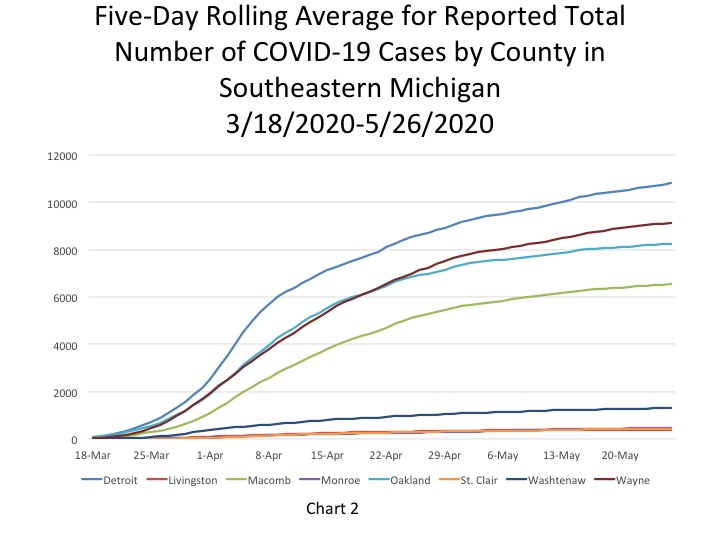
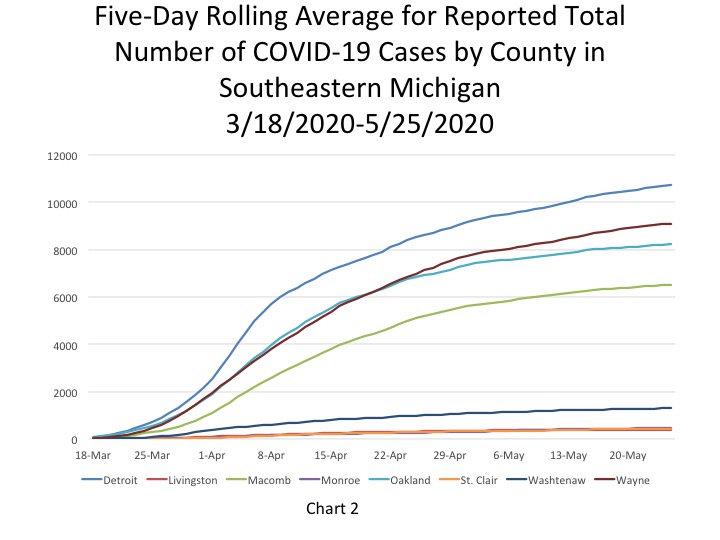
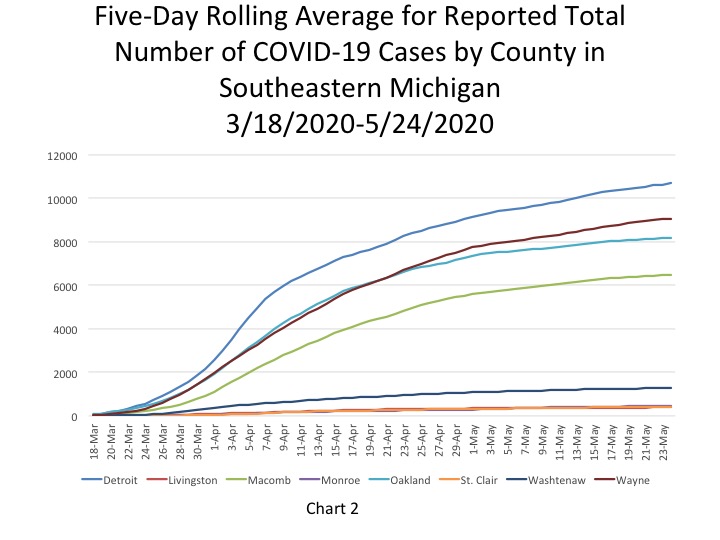
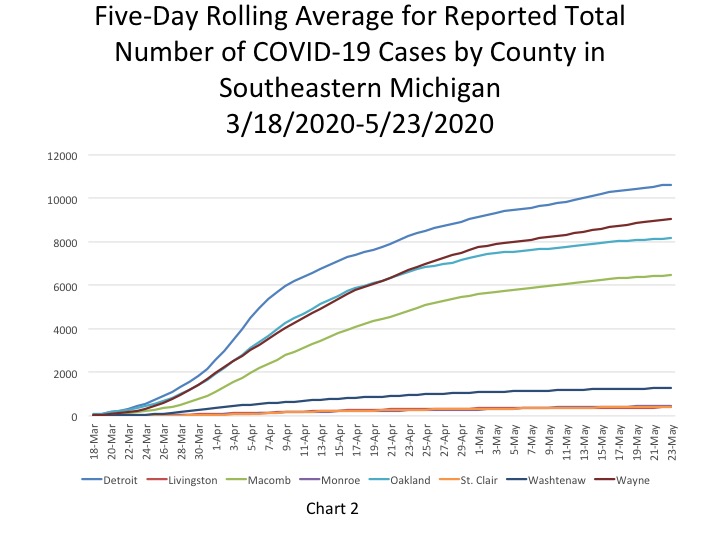
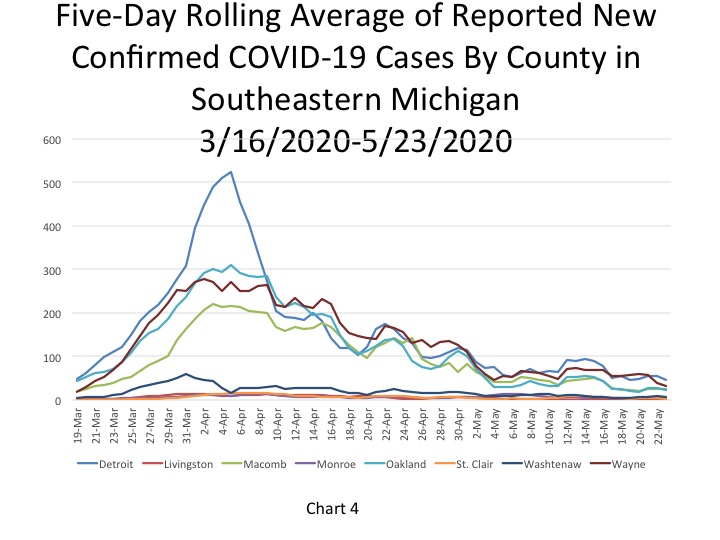
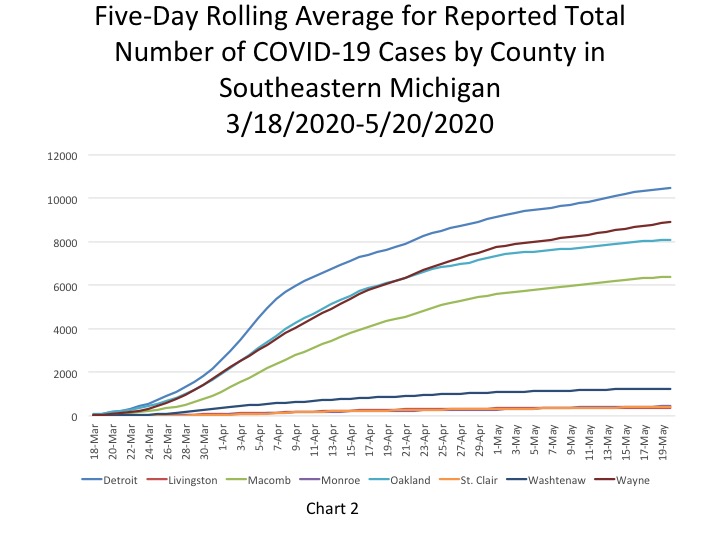
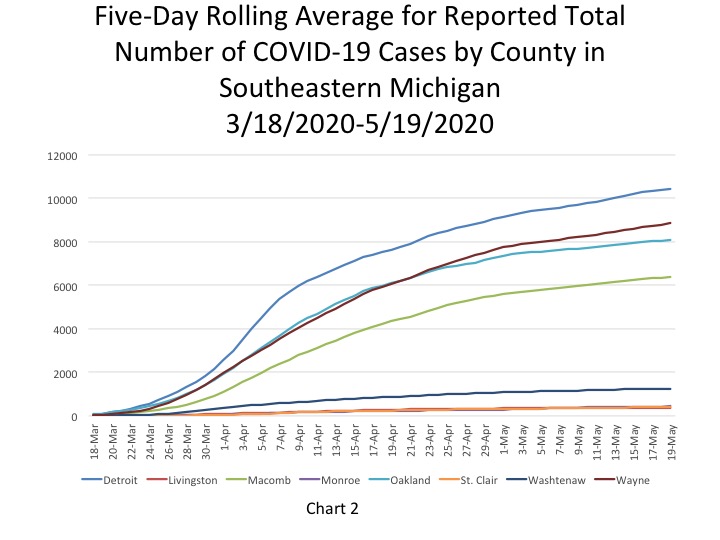
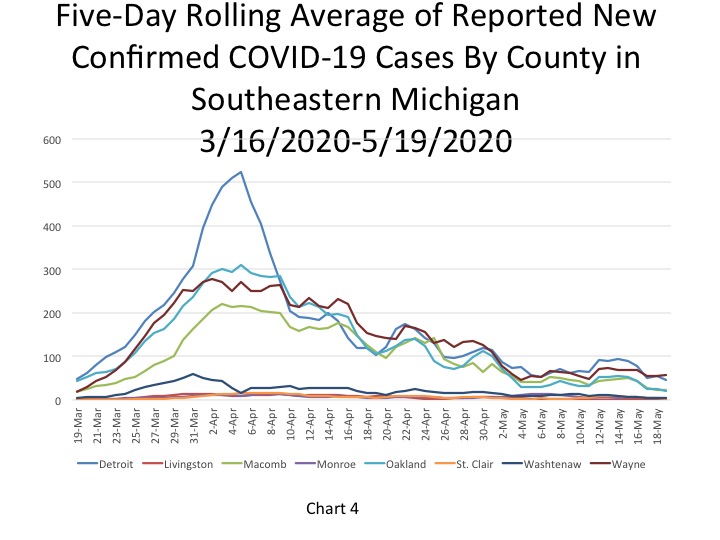
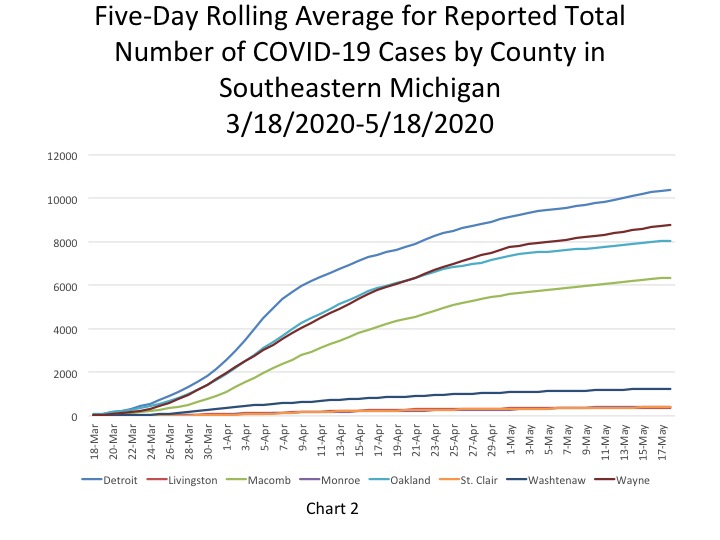
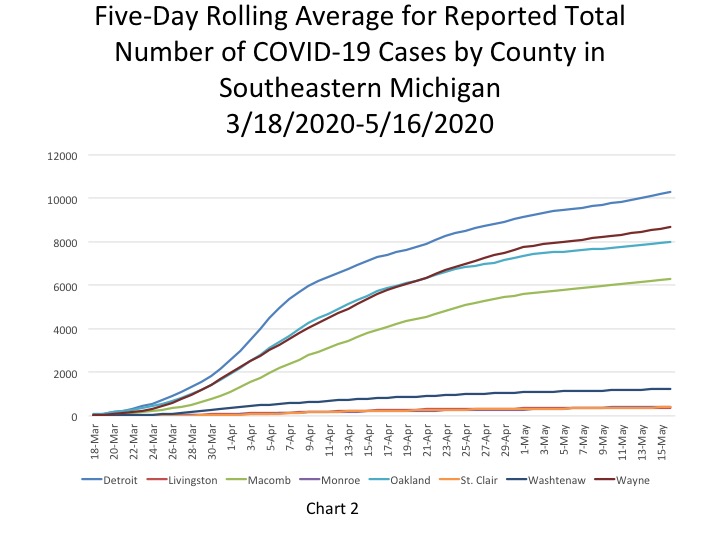
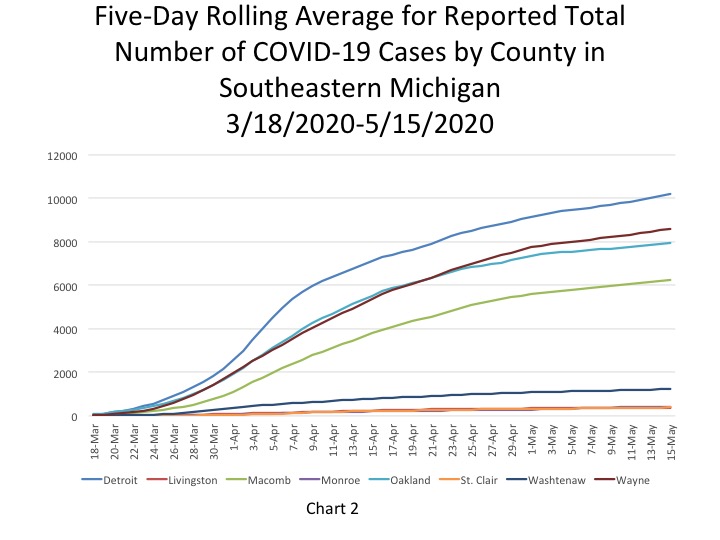
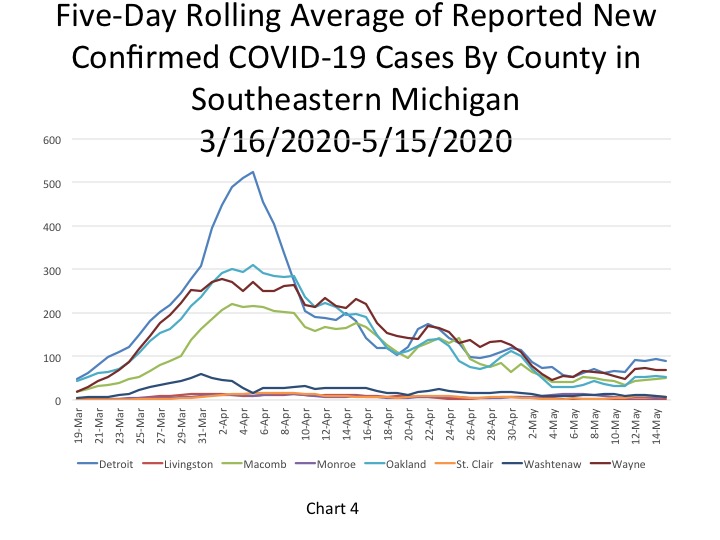
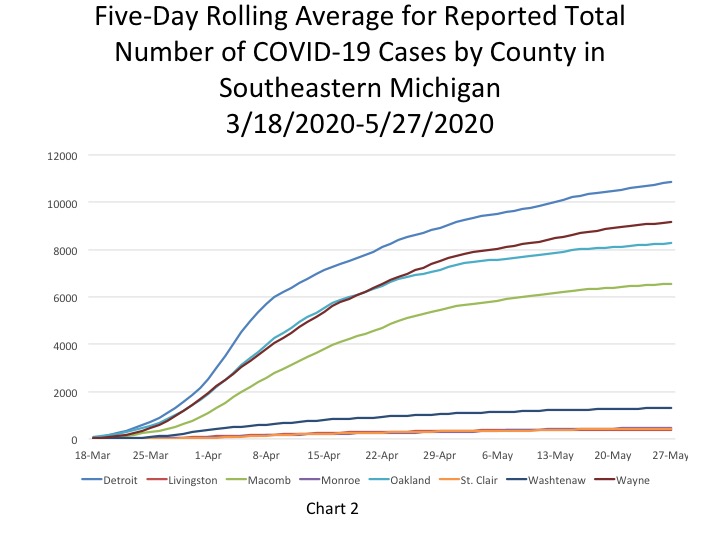
Chart 2 shows that, based on the five-day rolling averages, the growth of new COVID cases in Southeastern Michigan continued to level off for the counties in the region. On May 27 the number of cases in Detroit reached 10,850, the highest in the region, and Wayne County reported the second highest number of cases at 9,156. On May 27, the five-day rolling average for the number of COVID cases in Oakland County was 8,264, and Macomb County reported 6,561.
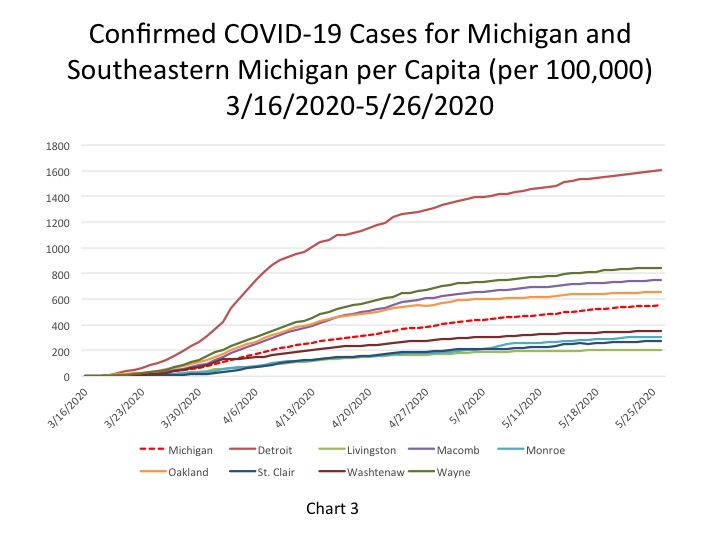
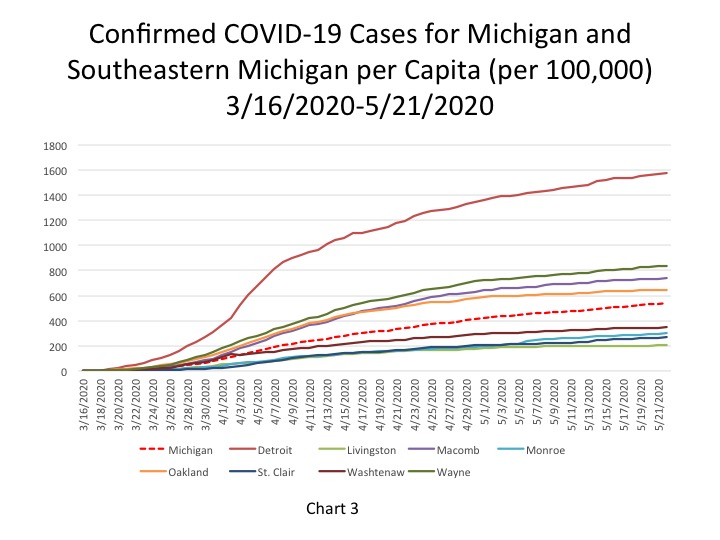
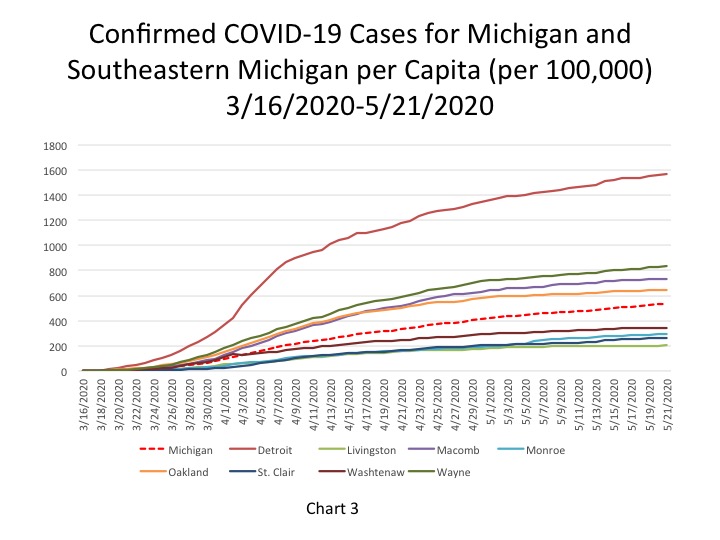
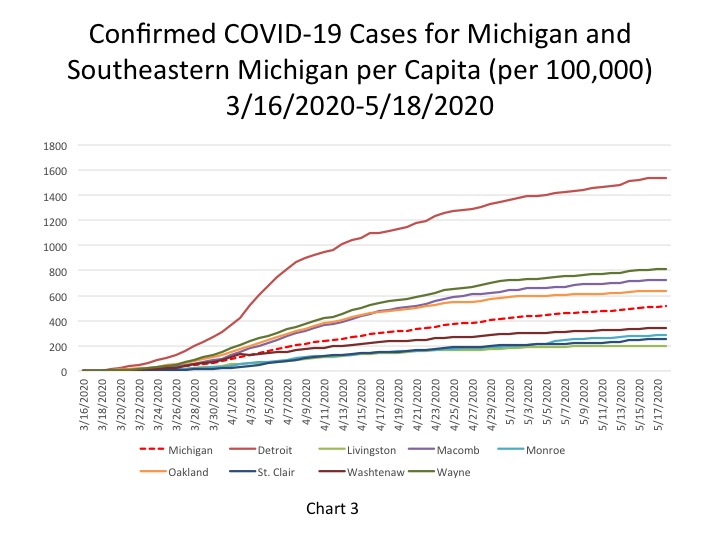
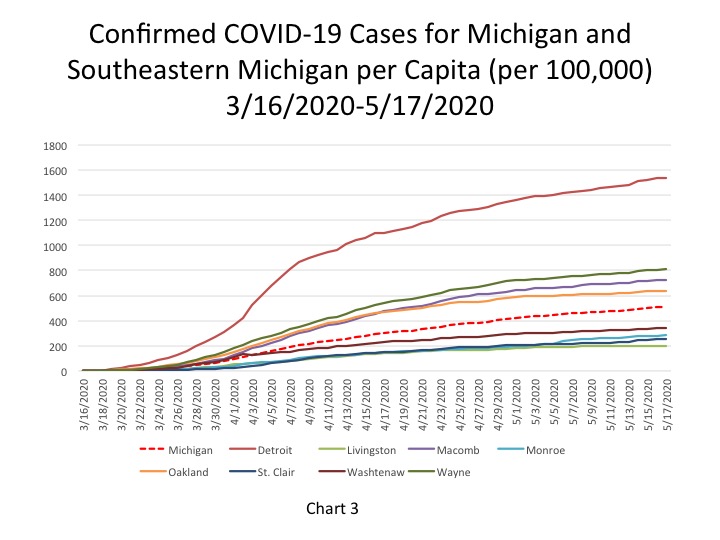
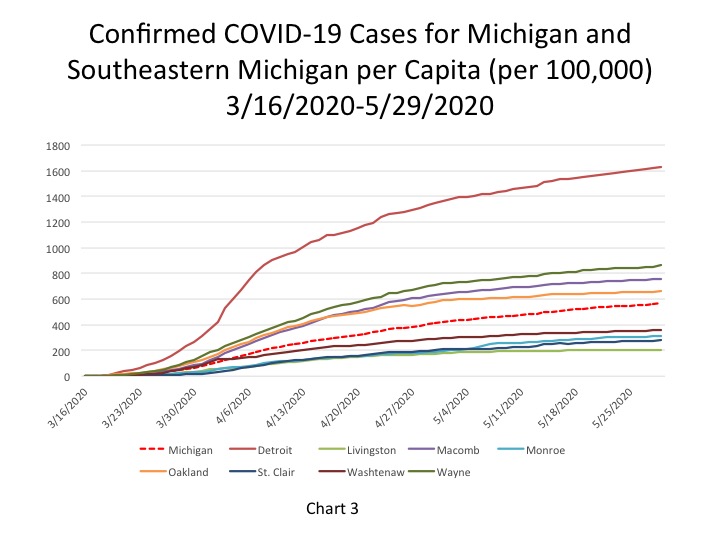
The City of Detroit had reached 1,625 COVID cases per 100,000 people on May 29, an increase from the cumulative total of 1,621 the day before (Chart 3). This is based upon a reported increase of 26 new COVID cases, bringing the total number of COVID cases in Detroit to 10,929. Wayne County reported 864 cases per 100,000 people, and Oakland County had 661 cases per 100,000 people. These per capita rates were based upon 9,298 total cases for Wayne and for 8,311 Oakland. Macomb County reported 757 cases per 100,000 people, which is based upon 6,616 cases.
The daily data highlighted in these posts is from Michigan.gov/coronavirus, where data is updated daily at 3 p.m. Historical data were supplied from covidtracking.com, which republishes COVID data from the State. Additionally, the case totals do not reflect the number of people who have recovered, just those who have been infected.
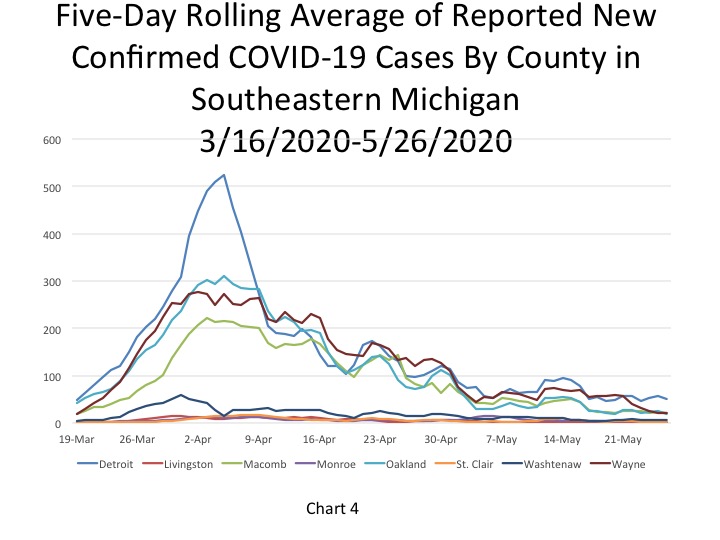
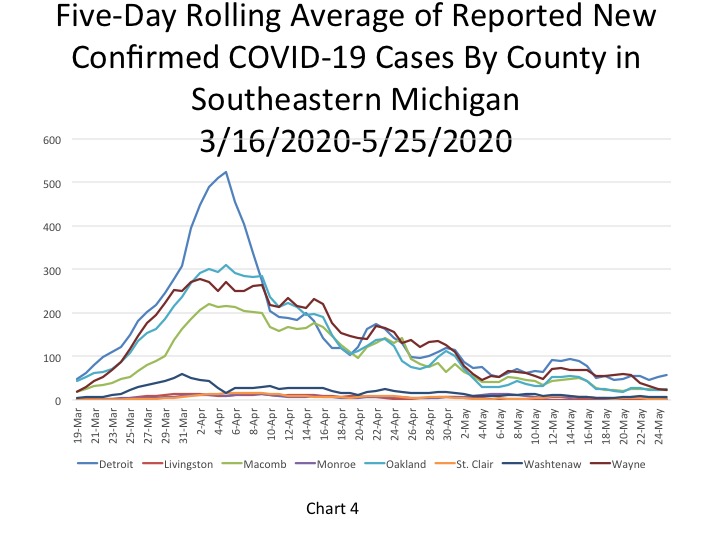
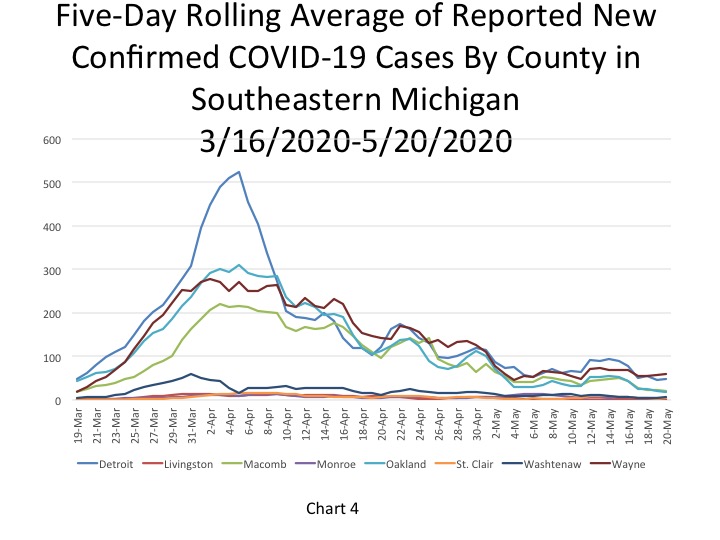
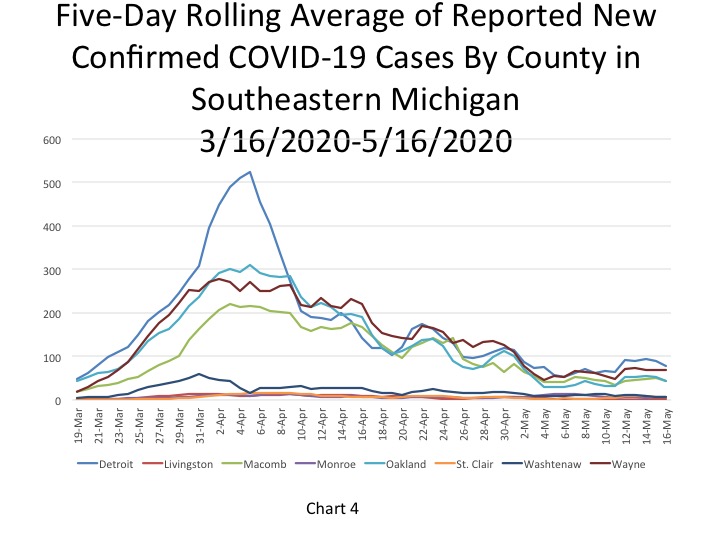
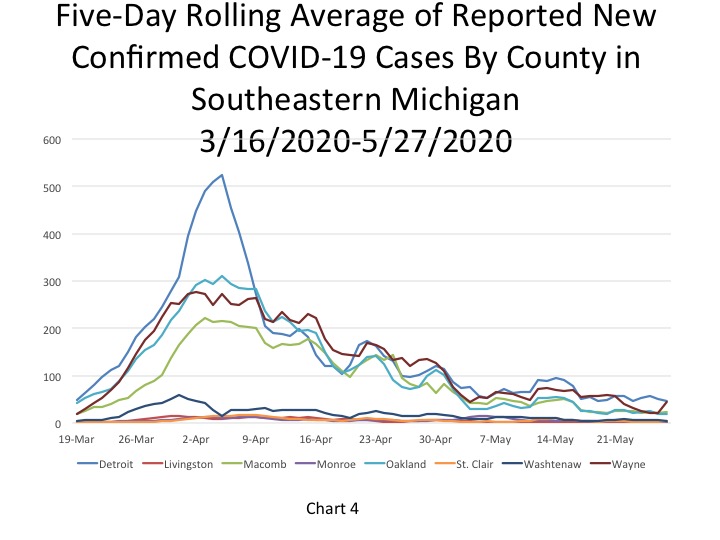
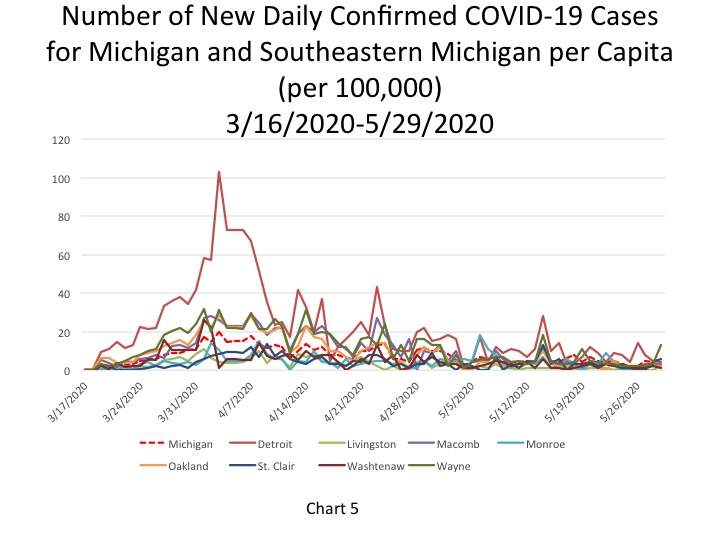
Presenting the five day rolling averages chart 4 shows that Detroit, among the units covered here, reported the highest number of daily cases at 46 on May 27, a decrease of 5 from the day prior. Wayne County’s numbers more than doubled on May 27; it reported 21 new cases on May 26 and 45 new cases on May 27.
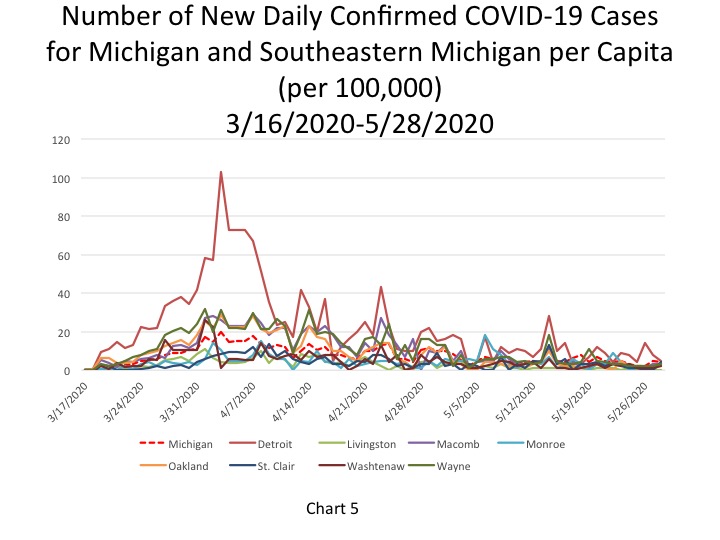
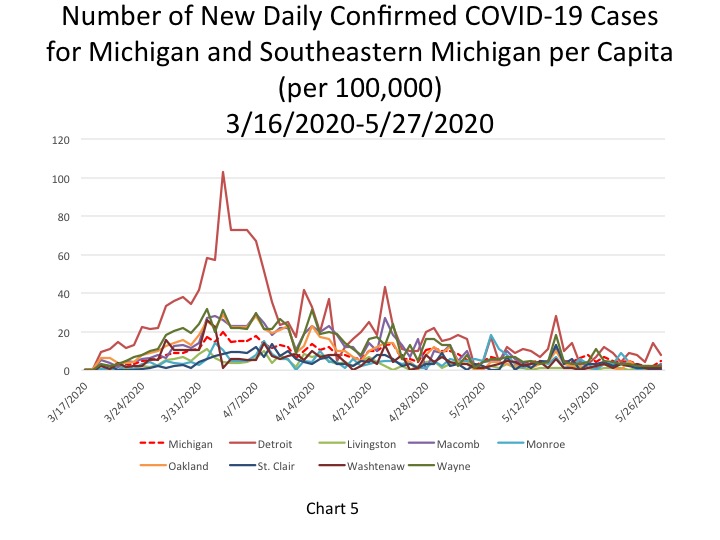
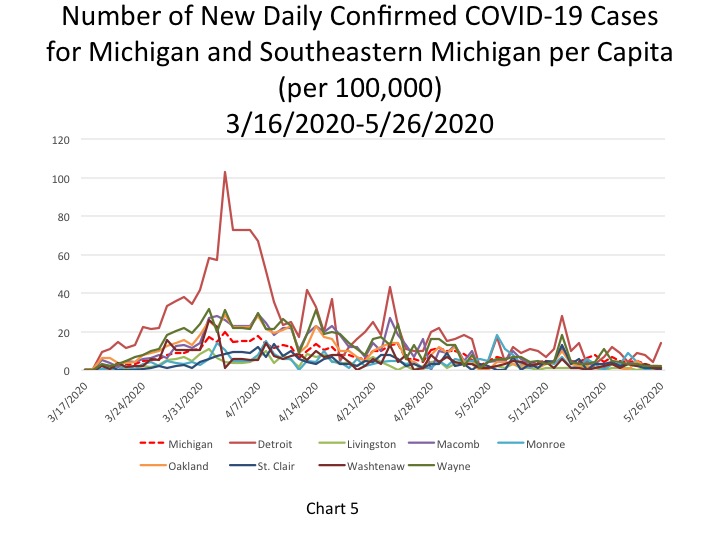
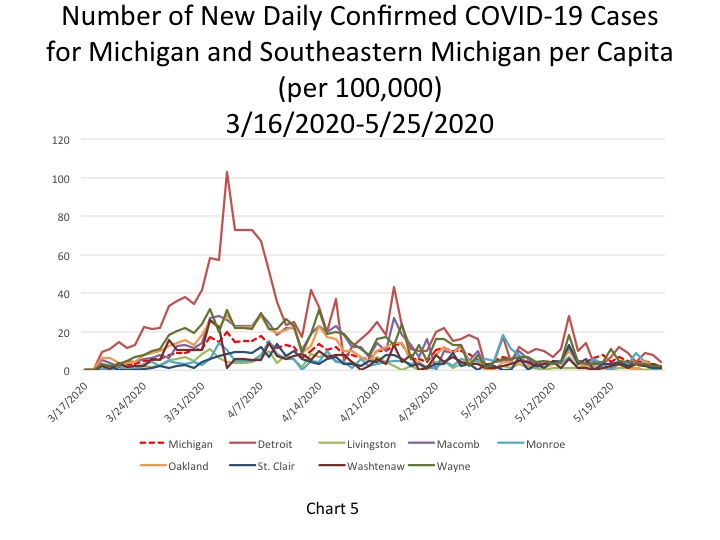
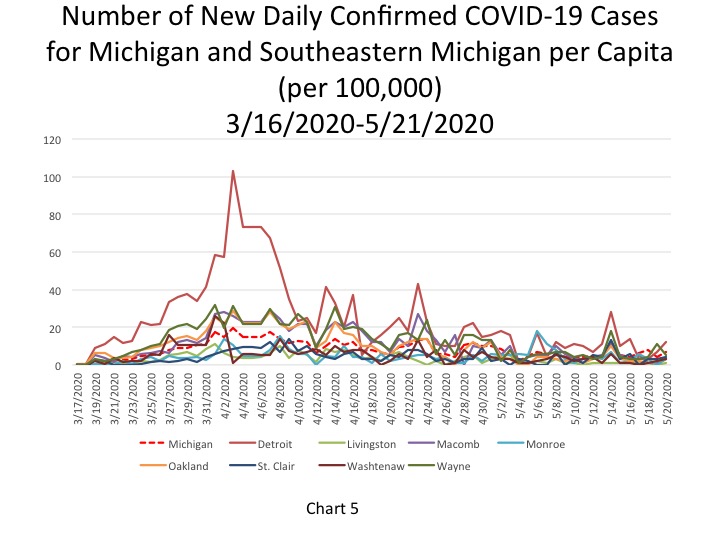
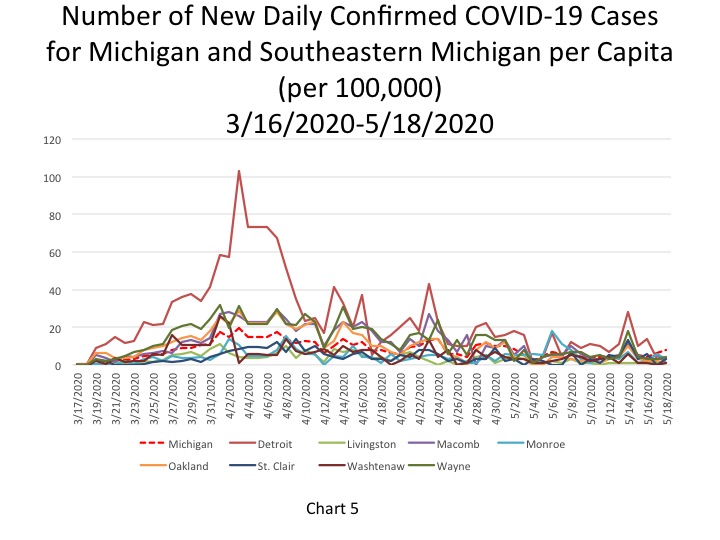
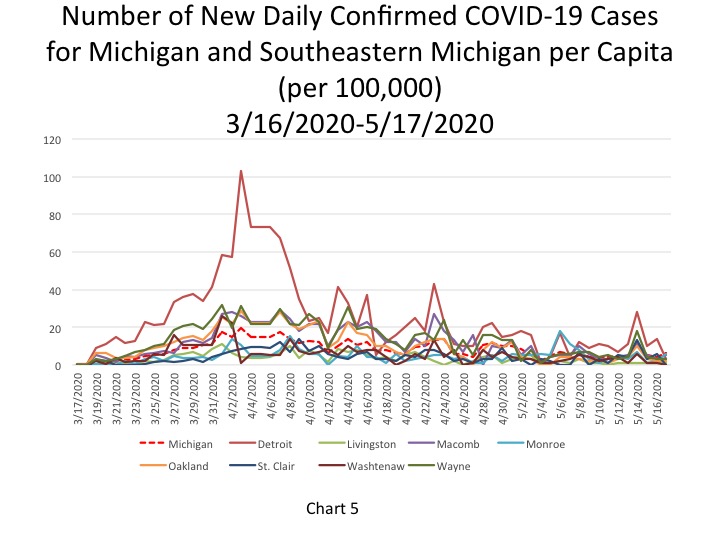
On May 29 the per capita rate for the number of new daily COVID cases per 100,000 people was 6 for the State, which was equivalent to 607 new cases. The State’s May 29 per capita rate was an increase from the day prior. The City of Detroit’s rate on the other hand decreased. On May 29 Detroit reported a per capita rate of 5 new COVID cases per 100,000 people, and on May 28 it reported a rate of 4. Detroit’s decreased rate was equivalent to 26 new cases. Wayne County reported 13 new COVID cases per 100,000 people, which was equivalent to 142 new cases. Wayne County’s rate increased by 10 from the day prior. Oakland County reported a per capita rate of 2 new cases per 100,000 people on May 29, which was equivalent to 30 new cases, and Macomb County reported a rate of 3, which was also equivalent to 30 new cases. Overall, 248 new COVID cases were reported in Southeastern Michigan on May 29. This is an increase of 120 from the day prior.
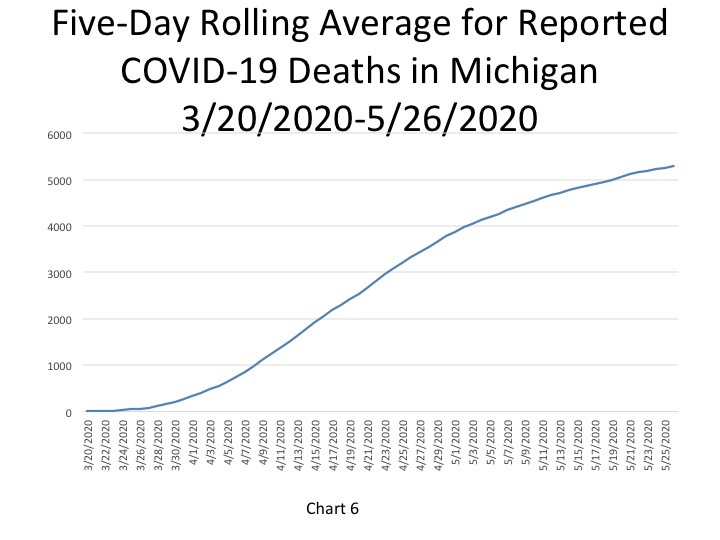
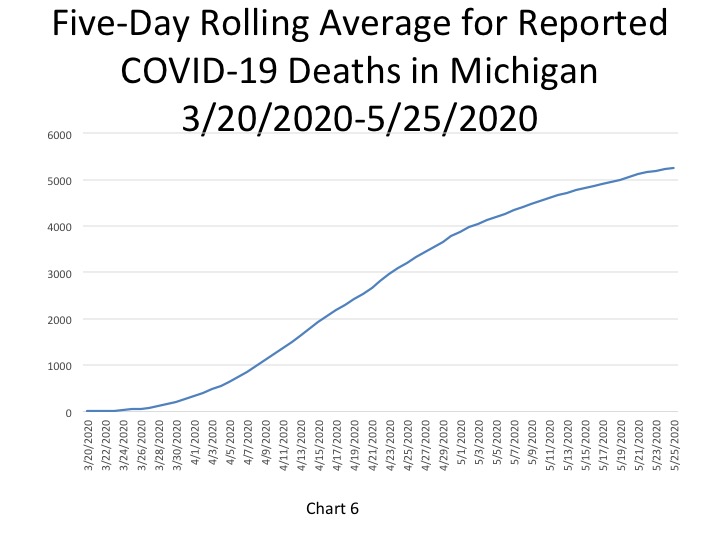
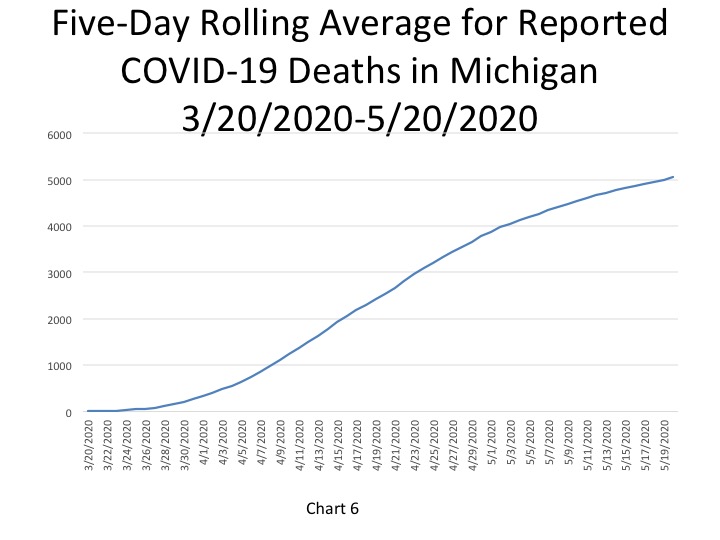
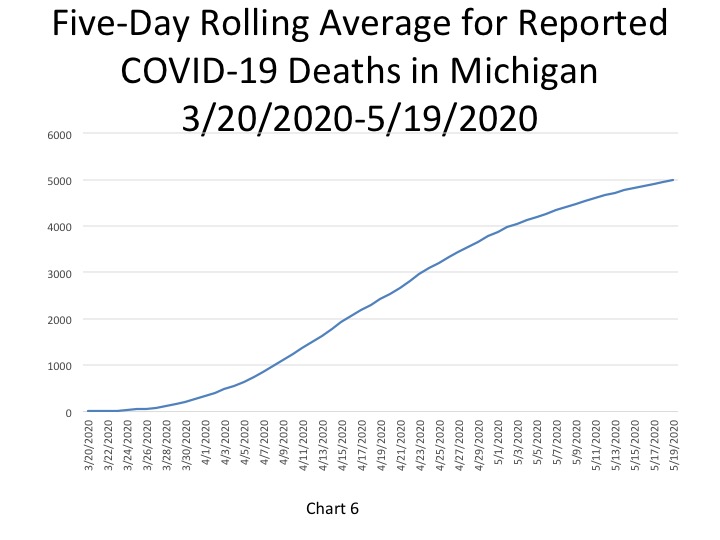
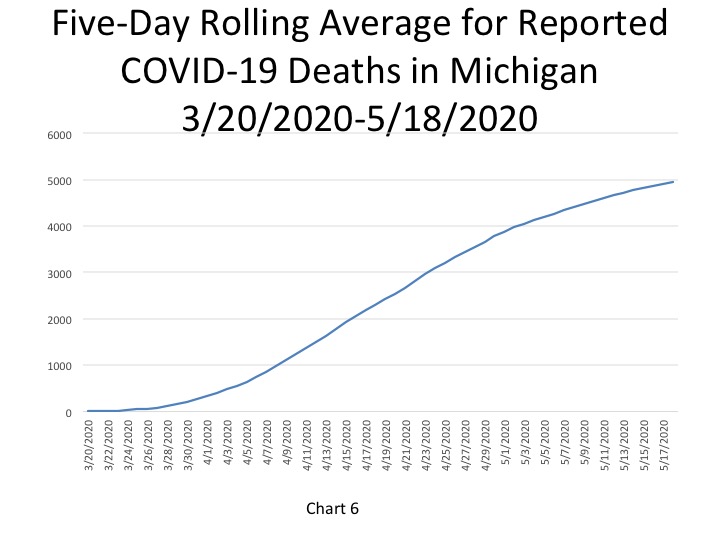
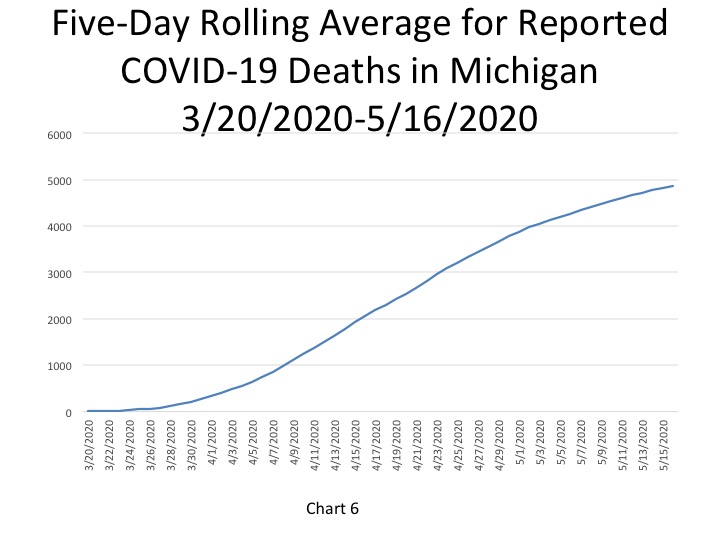
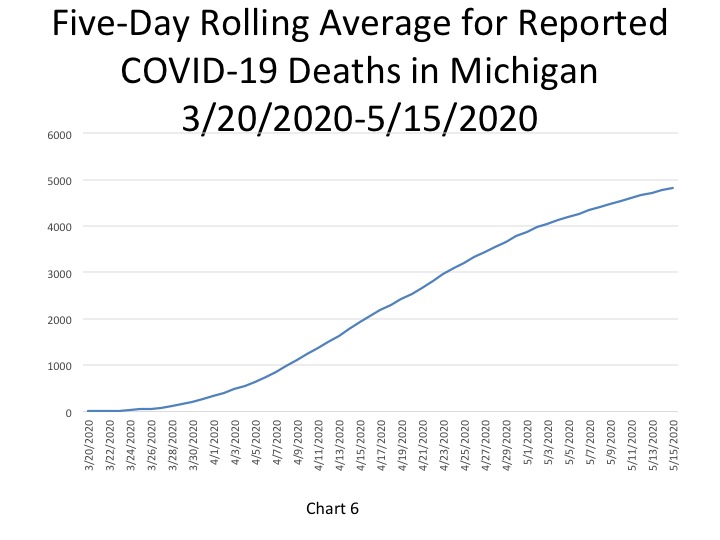
In Chart 6, the five-day rolling average for the number of deaths in Michigan shows a continuing slow increase (a lagged number of 5,324 deaths, an increase of 36 deaths). The actual reported COVID-19 on May 29 was 5,406, an increase of 34 deaths from the day prior. Of those 34 deaths Southeastern Michigan accounted for 27 of them.
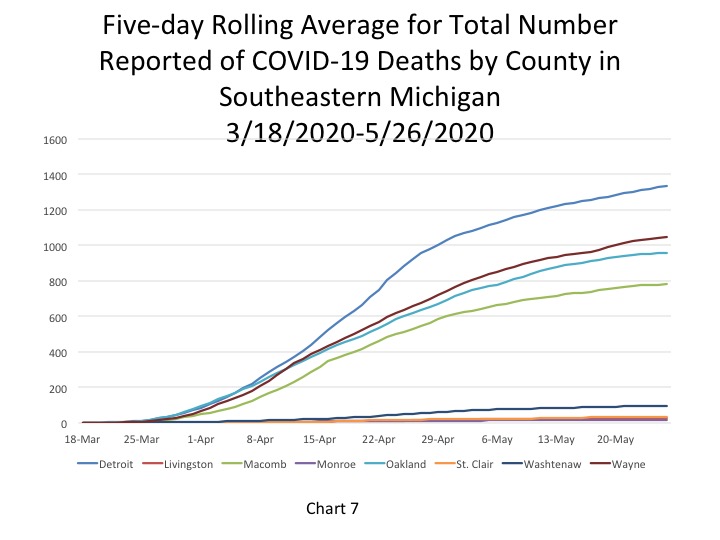
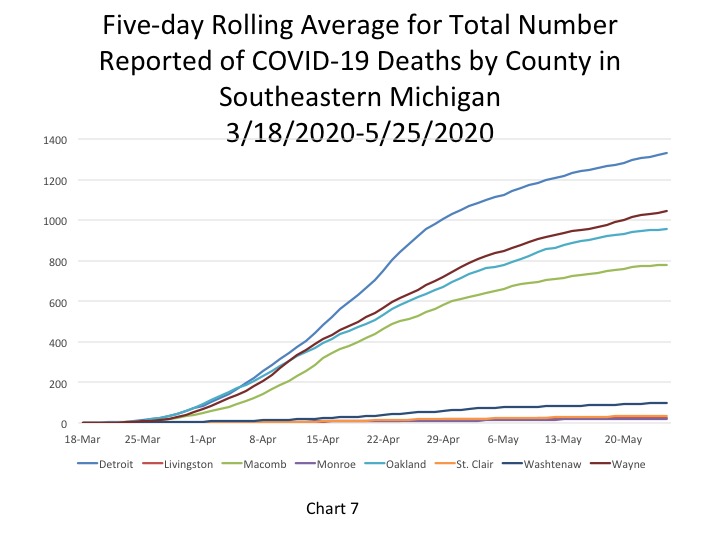
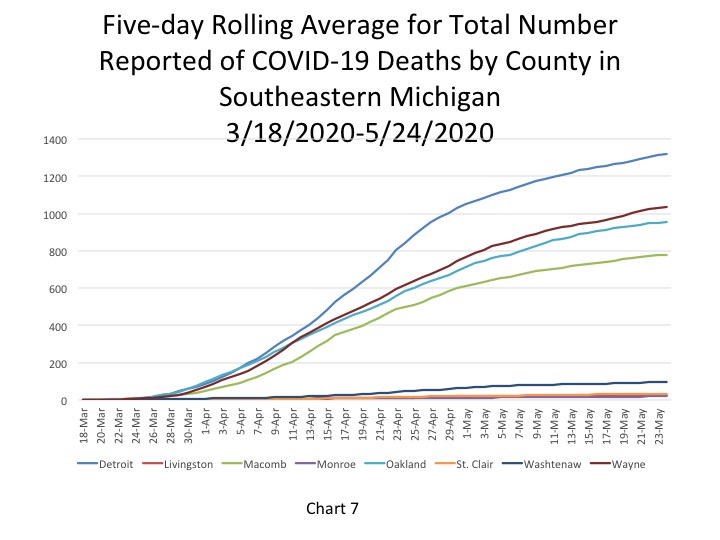
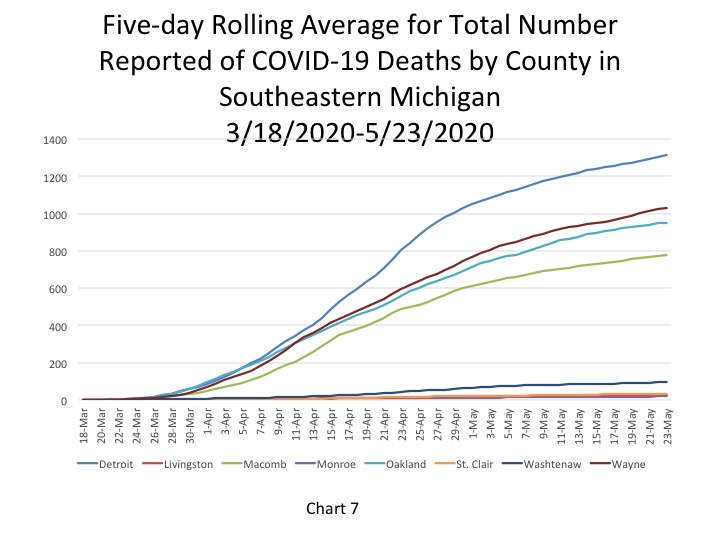
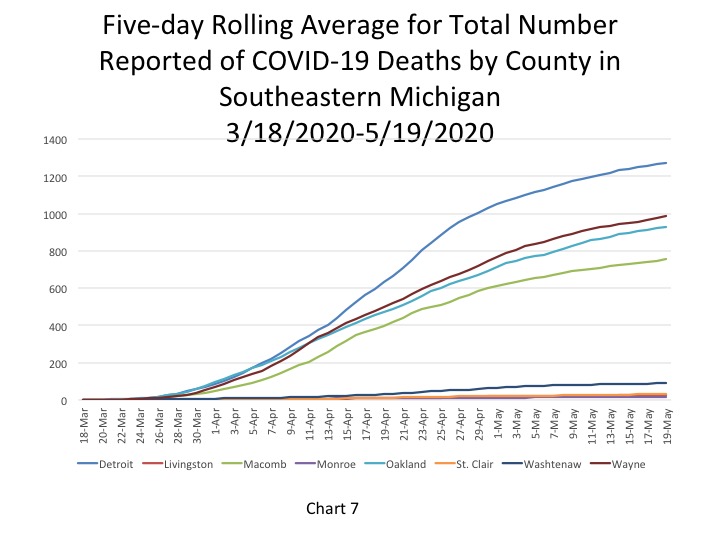
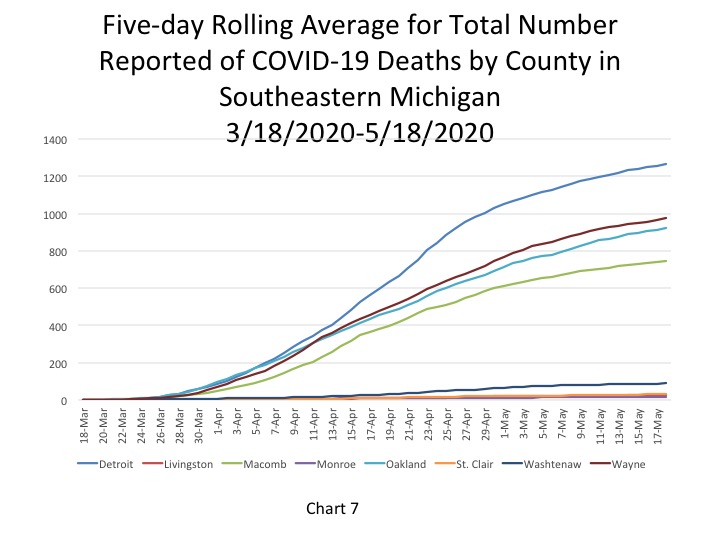
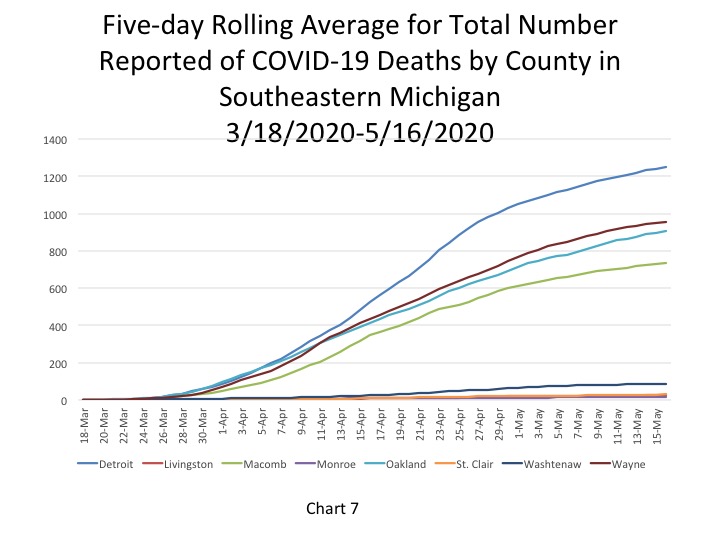
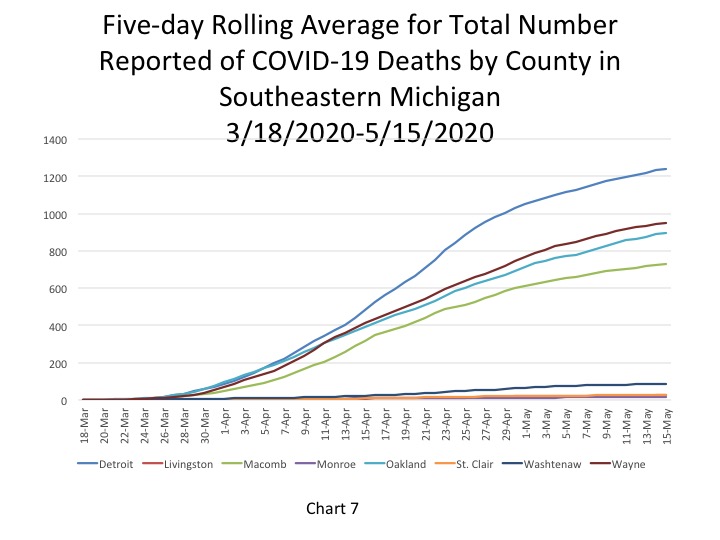
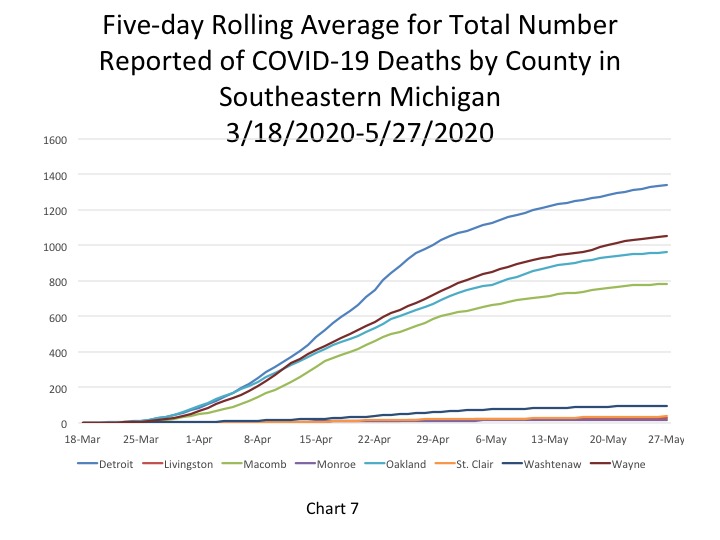
Chart 7 (a 5-day rolling average) portrays how the total number of COVID deaths in Southeastern Michigan continues to increase at a much slower rate, with Detroit reporting the highest cumulative number of deaths at 1,340 on May 27. Wayne County had the second highest total at 1,054 on May 26.
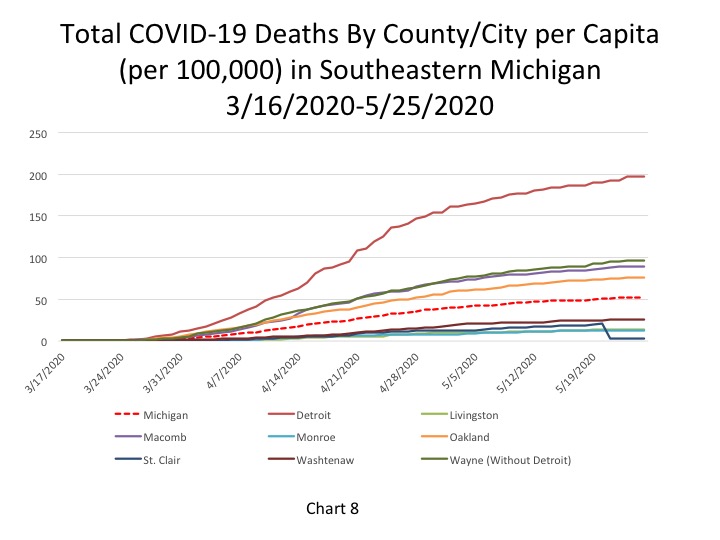
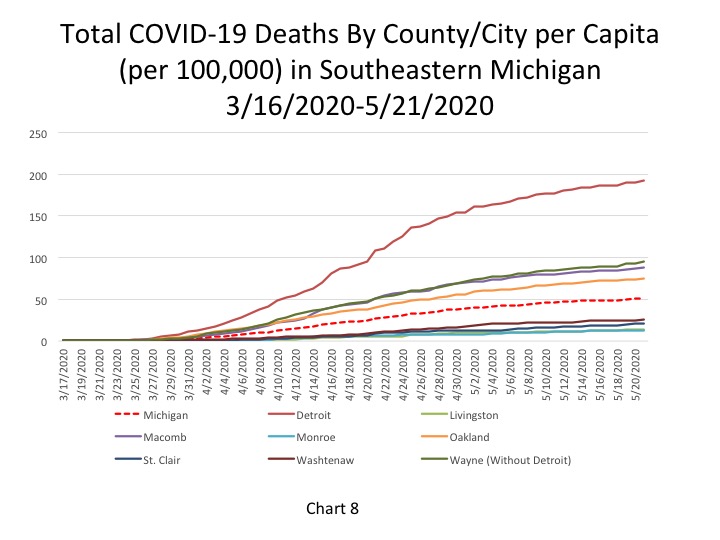
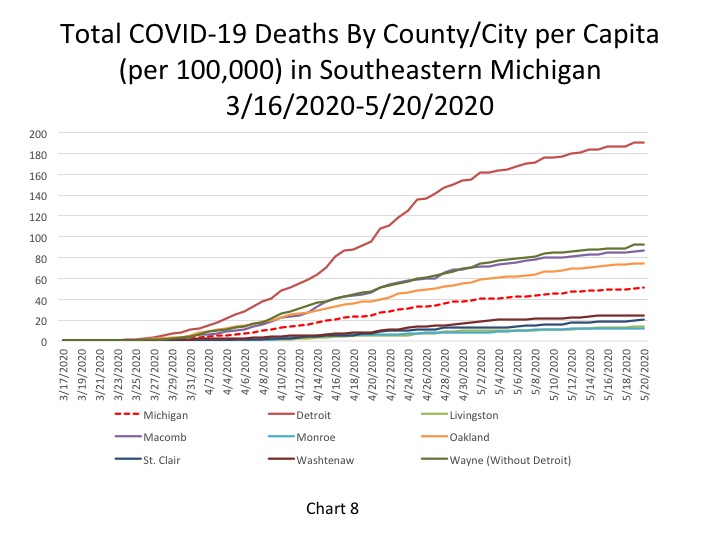
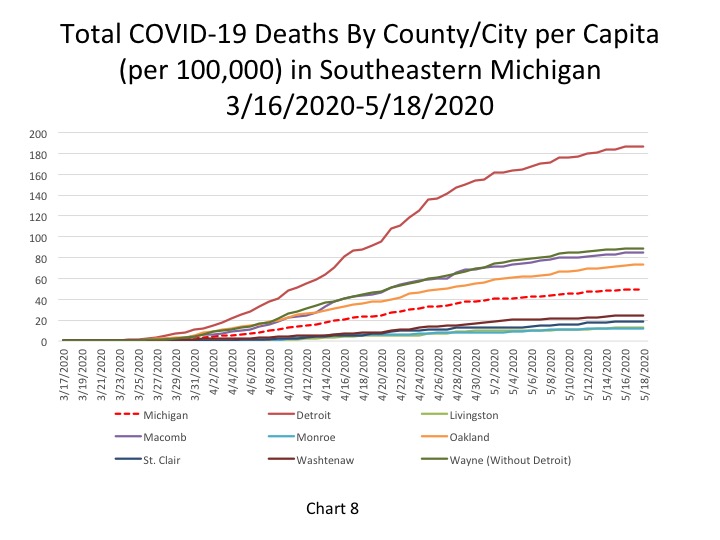
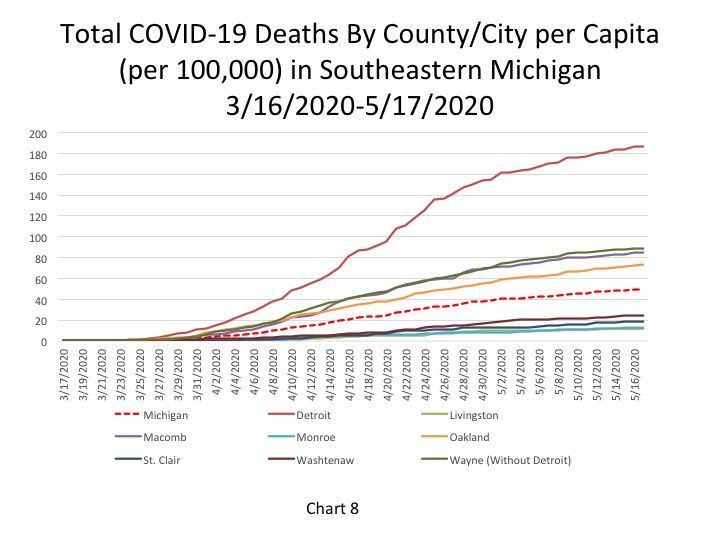
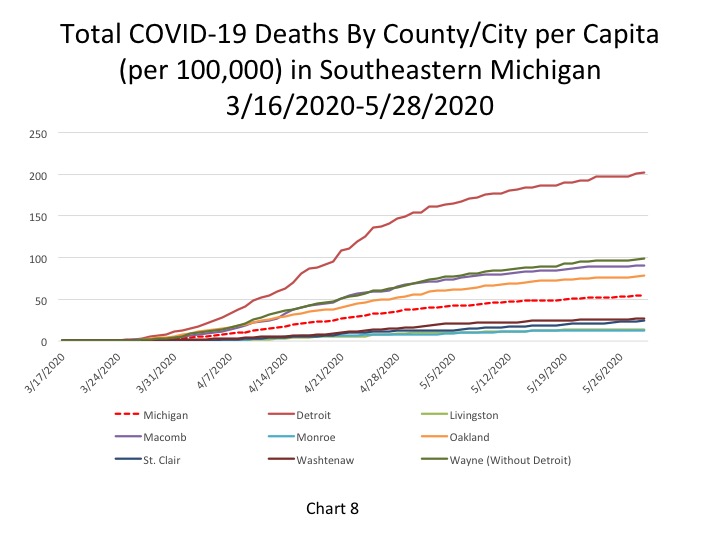
Chart 8 portrays the total number of COVID deaths per 100,000 people on May 29. The cumulative total of COVID deaths per 100,000 people in Detroit was 202 (representing 1,356 deaths). In Wayne County there were 99 COVID deaths per 100,000 people (1,069 total deaths). In Oakland County there were 78 deaths per 100,000 people (975 total deaths) and in Macomb County there were 91 COVID deaths per 100,000 people (793 total). Wayne County had the highest single day death count in Southeastern Michigan on May 29; 10 COVID deaths were reported. The State of Michigan had 54 COVID deaths per 100,000 people, which was equal to 5,406 total deaths.
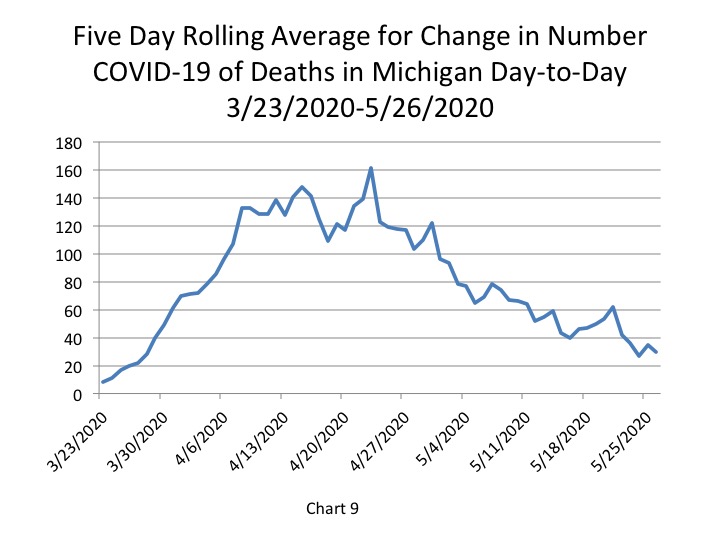
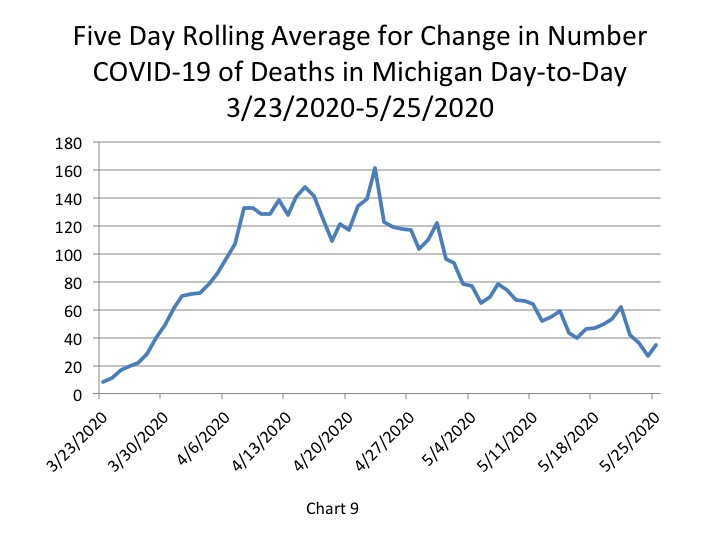
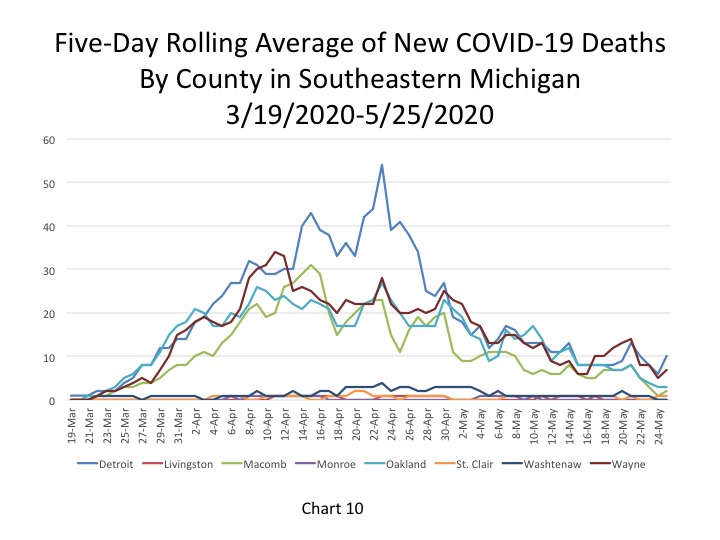
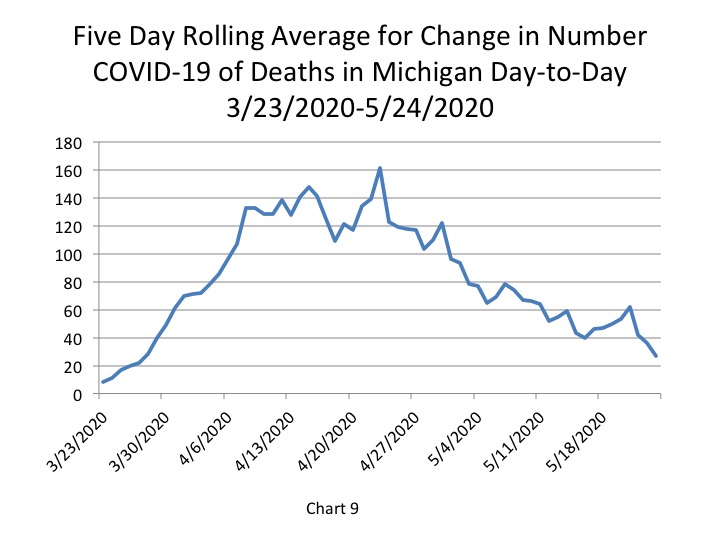
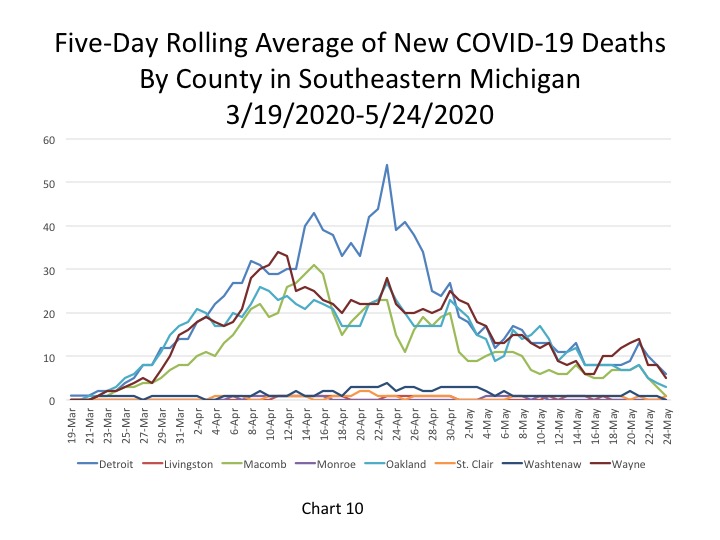
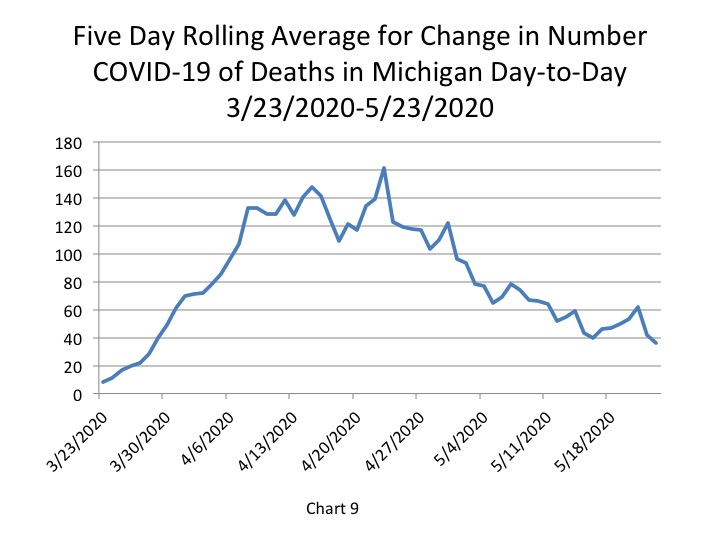
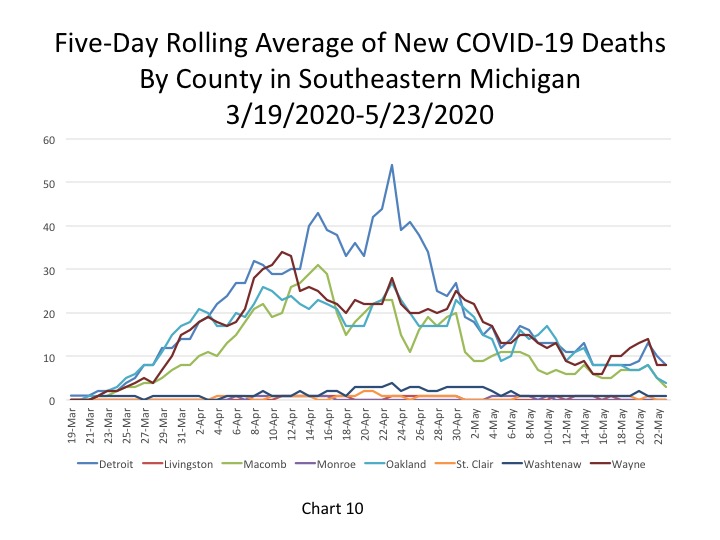
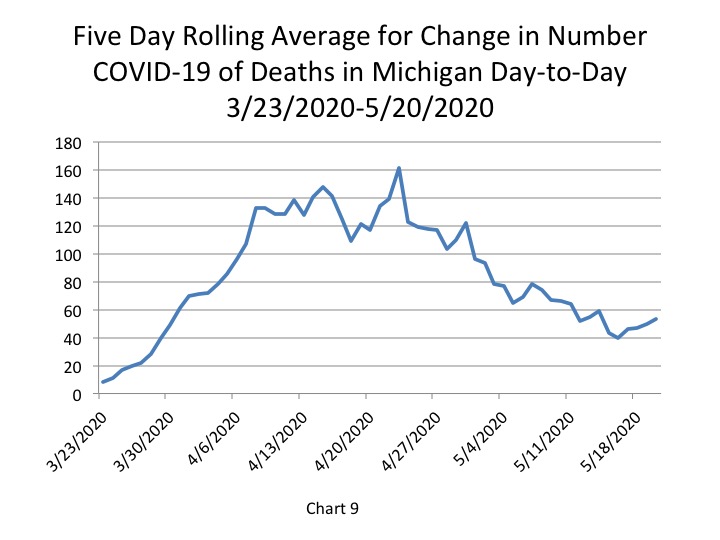
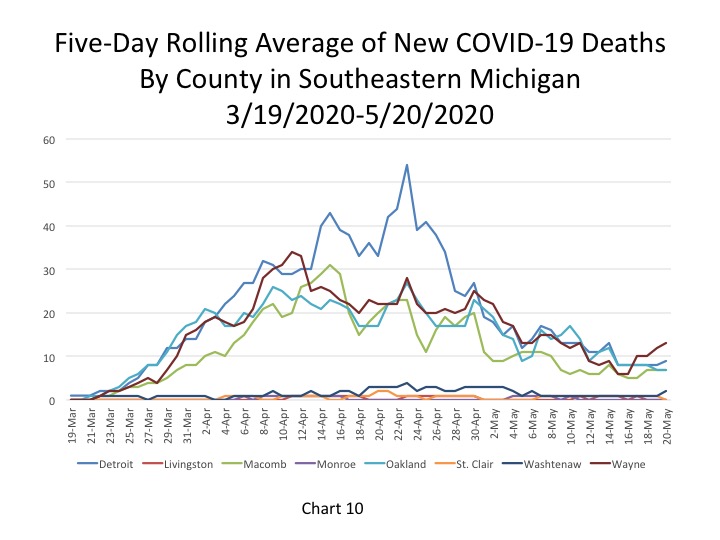
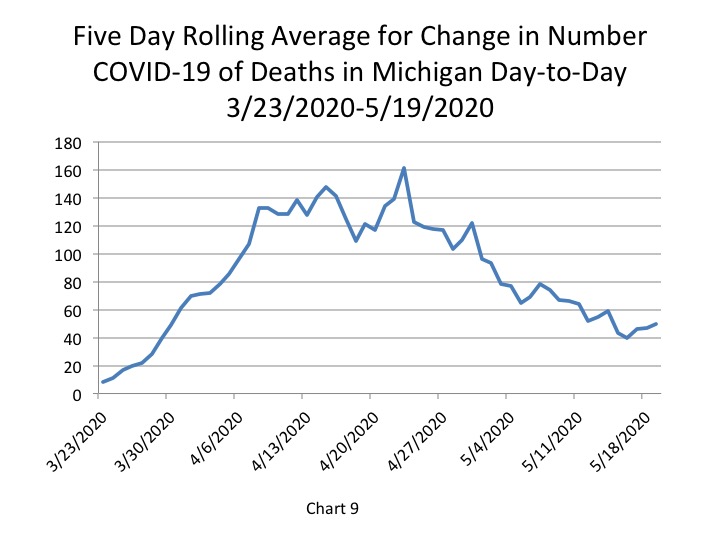
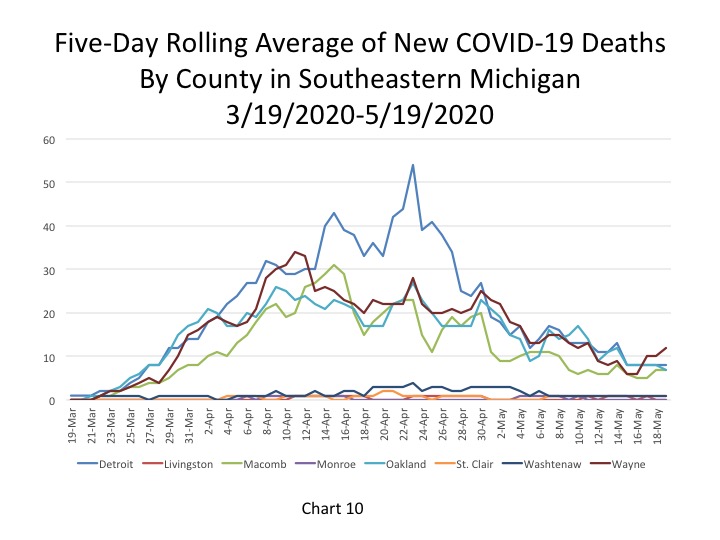
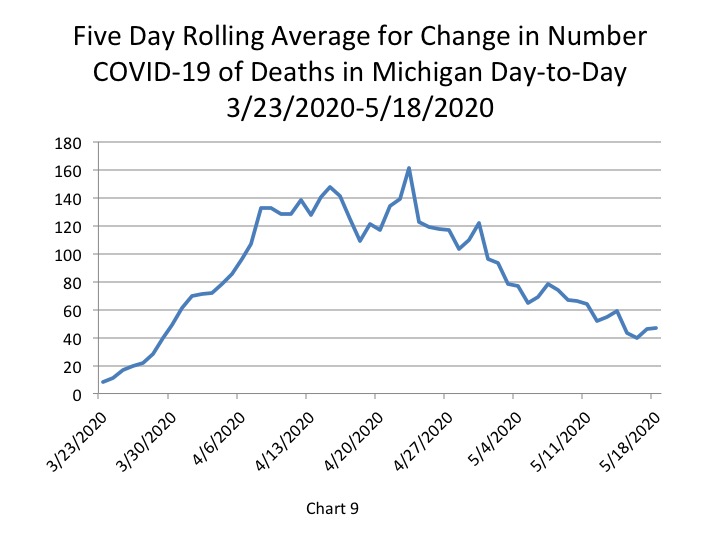
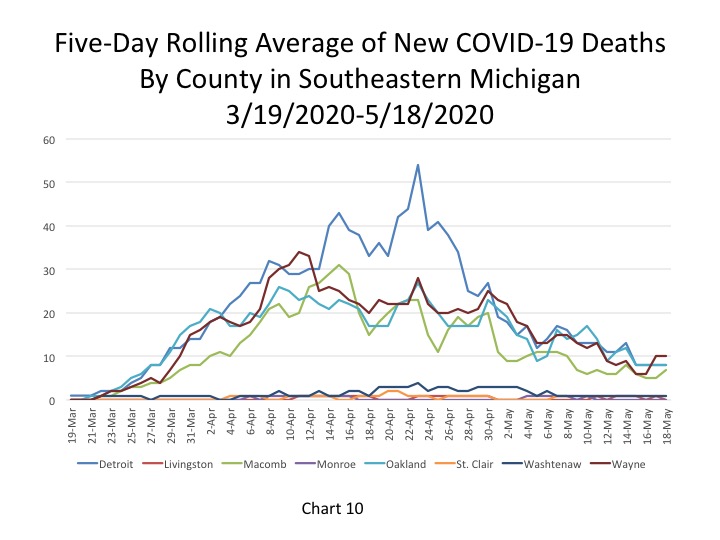
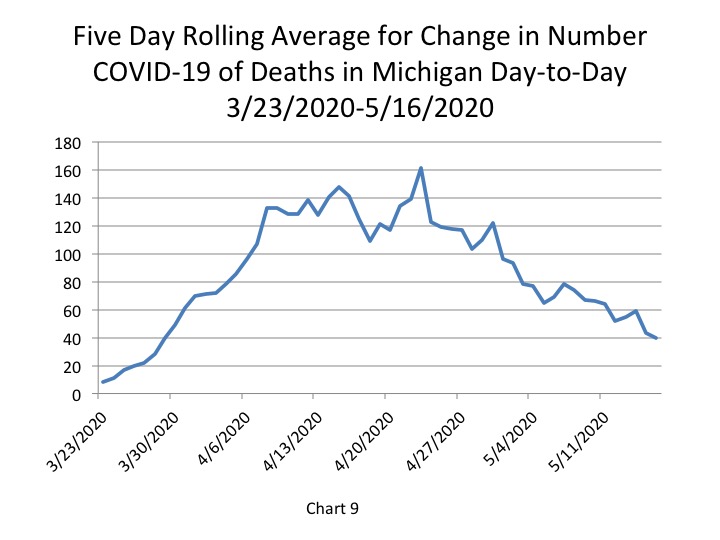
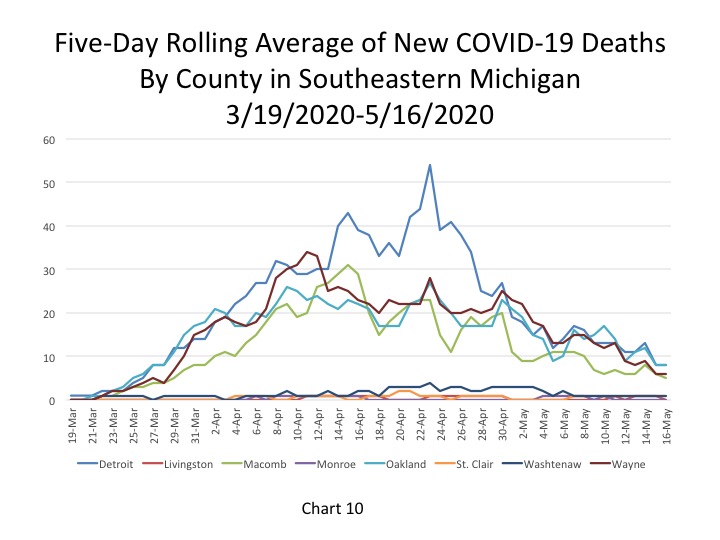
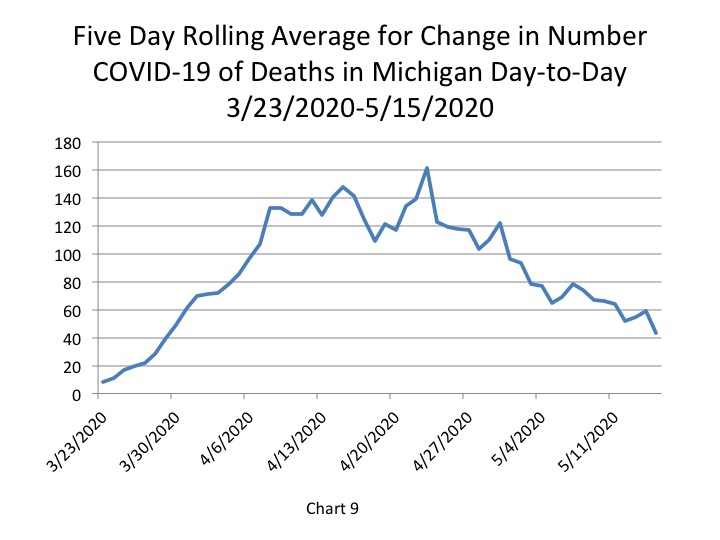
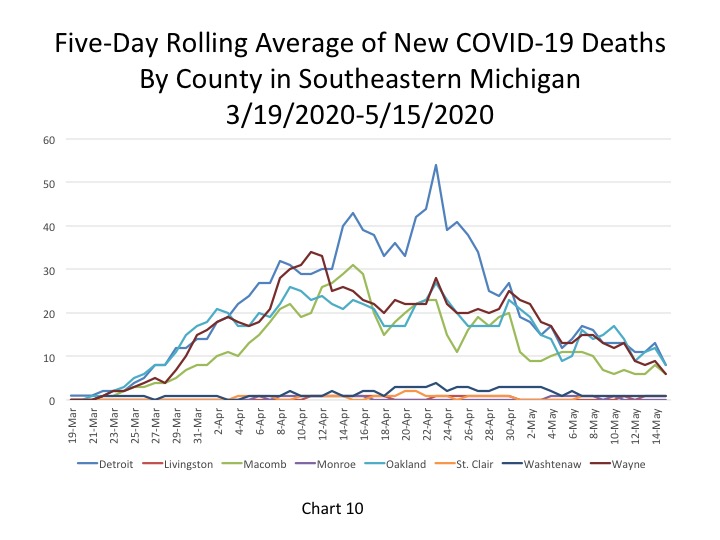
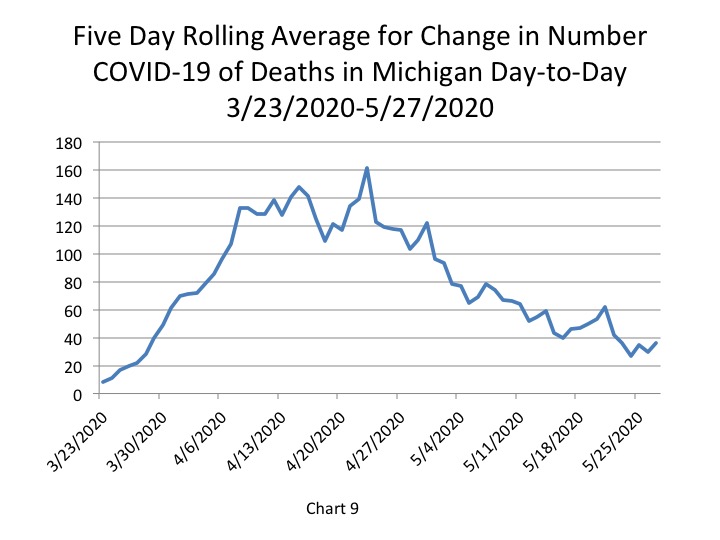
Chart 9, the five day rolling average of deaths, shows the number of new statewide deaths increased by 6 from the day prior. On May 27 the State reported 36 COVID deaths. Chart 10 shows how the number of deaths in Southeastern Michigan are overall continuing to decrease. Detroit reported 6 daily COVID deaths, as did Wayne County. Both Detroit and Wayne County also had the highest number of new daily deaths reported in the region. On May 27, of the 36 new statewide deaths reported, 21 were reported out of Southeastern Michigan (based on the 5 day rolling averages).


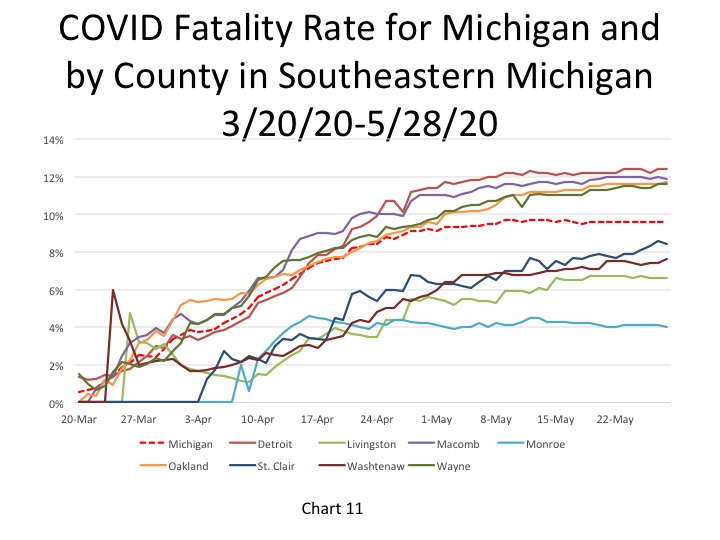
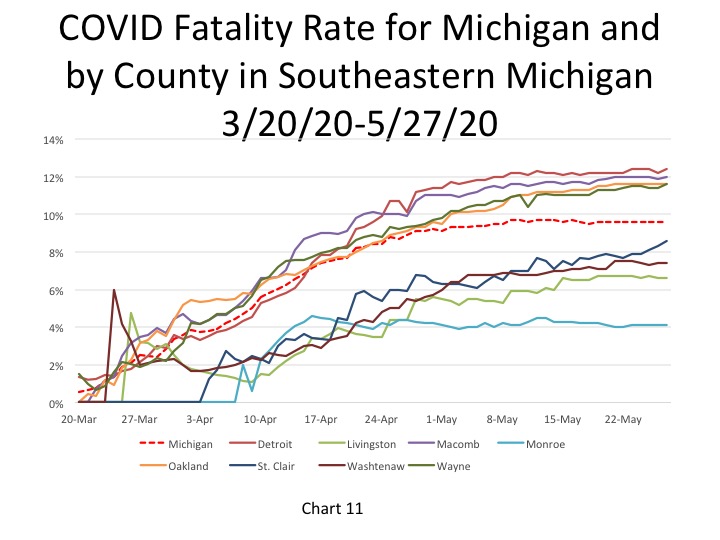
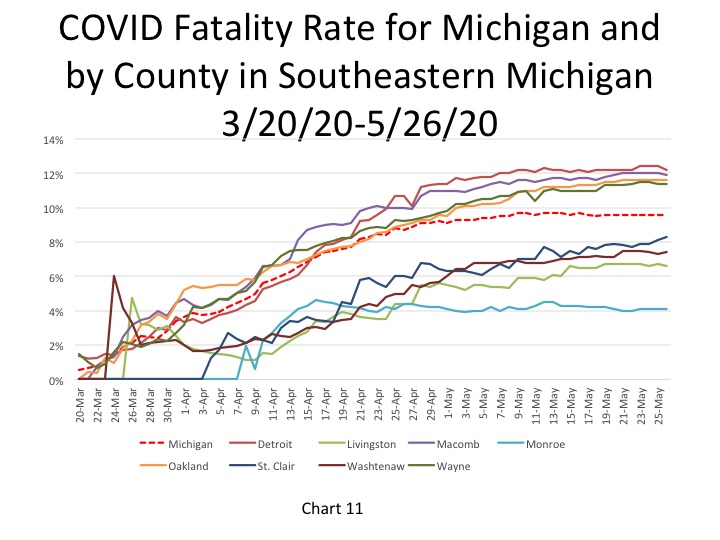
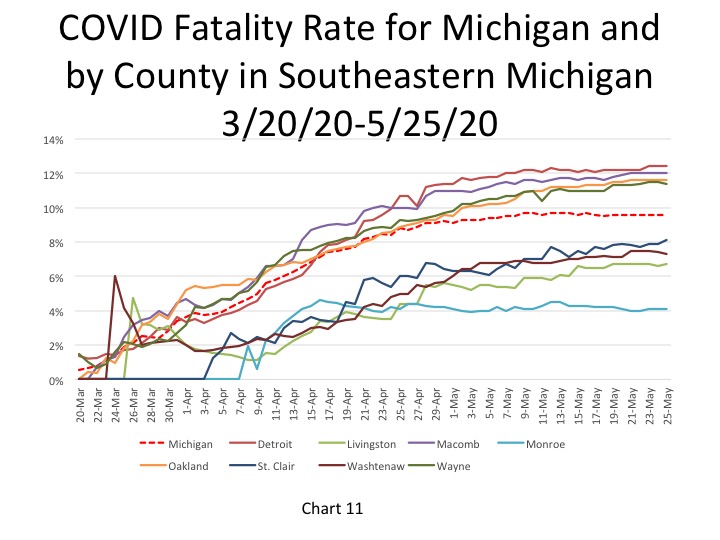
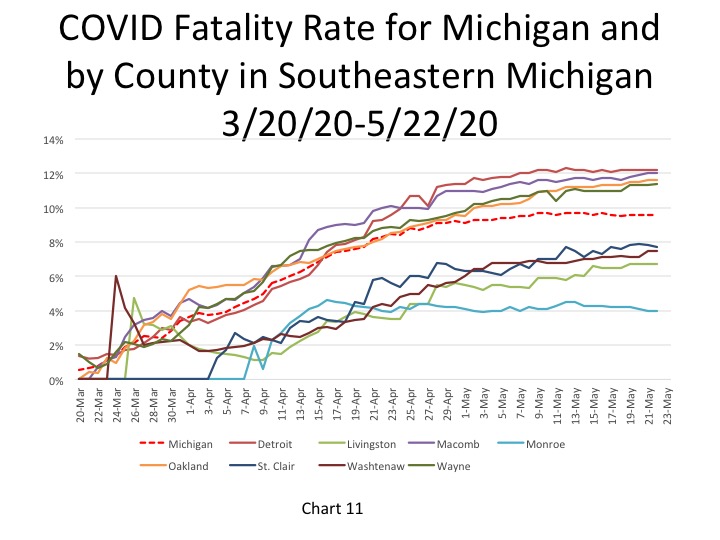
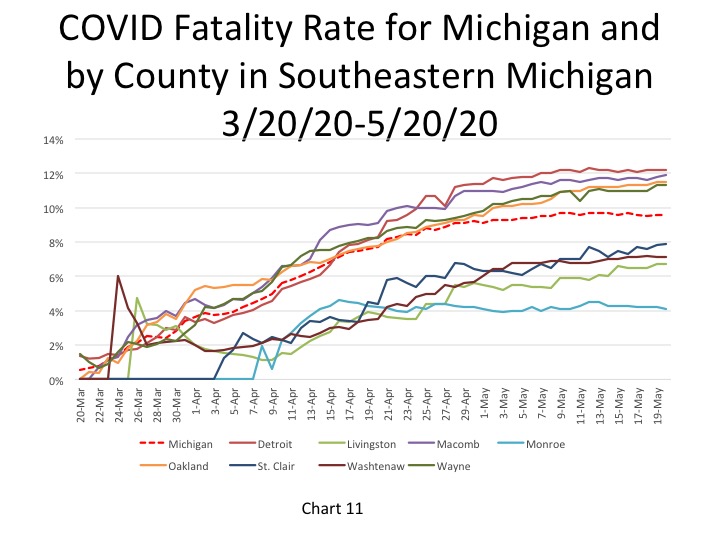
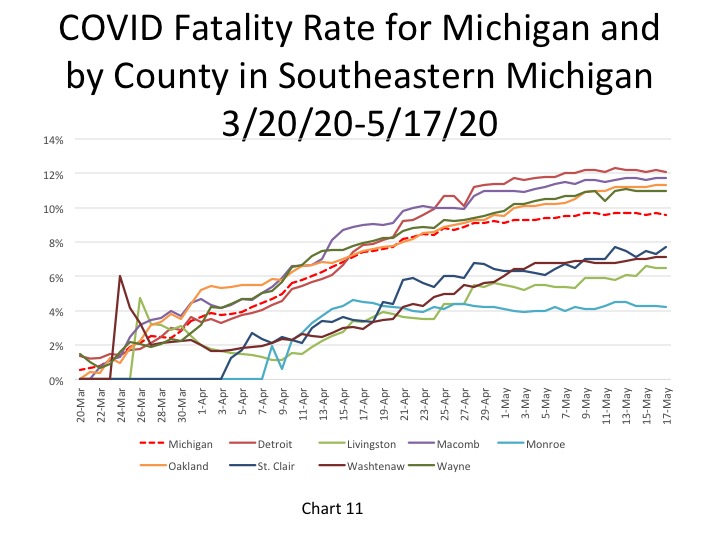
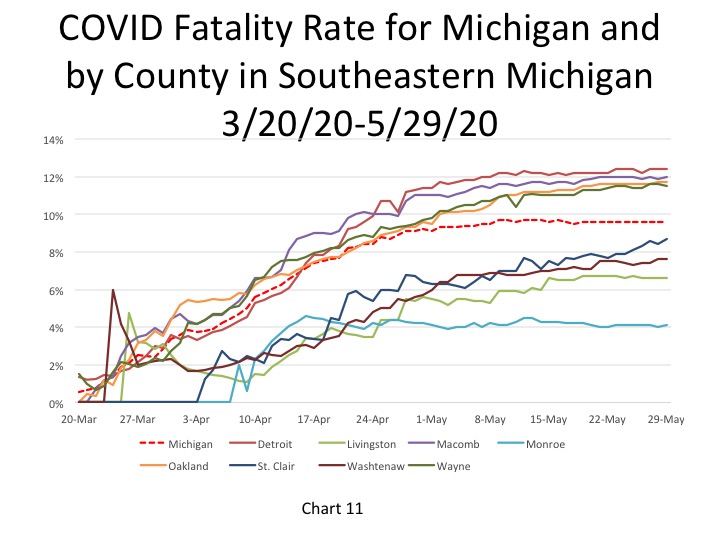
On May 29 Detroit reported a fatality rate of 12.4 percent, which has been consistent for several days now. The fatality rate in Macomb County increased back to 12 percent, and the State continued to report a fatality rate of 9.6 percent for 11 days in a row.
One reason we may be seeing such high fatality rates in Michigan is due to the low testing rates. When only having-presumably-a lower of number confirmed COVID cases than is actually likely due to the limited availability of tests, the fatality rate appears higher because the base comparison is smaller than it might be.
On May 29 we did see a slight jump in the number of new daily COVID cases in Michigan. Although majority of these numbers occurred outside of the Southeastern Michigan region, Wayne County did contribute 142 of those cases to the daily total. We do know that senior living facilities continue to be hot spots for the virus, and one in Wayne County has reported the highest number of cases in the State.