STD Rates on the Rise in Southeastern Michigan

Throughout Southeastern Michigan, Wayne County has consistently had the highest sexually transmitted disease (STD) rates since at least 2009, according to the Michigan Department of Health and Human Services. Below are three charts showing the rates per 100,000 people for chlamydia, gonorrhea and syphilis. All three charts show that the rate at which individuals in Wayne County have one of those STDs is much higher than any of the neighboring counties. Additionally, Livingston County had such low numbers of sexually transmitted infections accounted for there was no data available for some of the STDs.

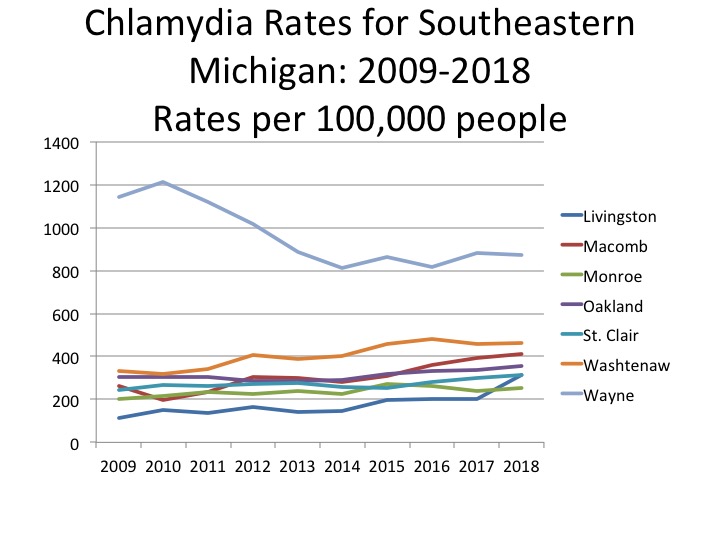
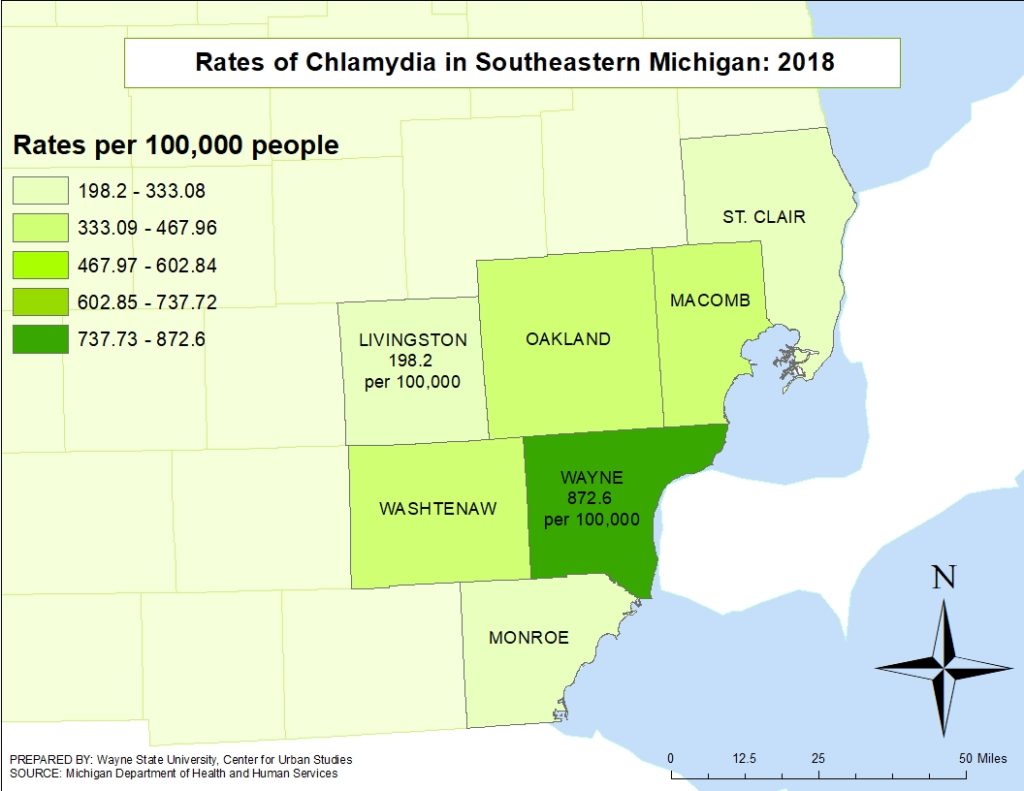
The first chart below shows the rates people with chlamydia per 100,000 between 2009 and 2018 for the counties in Southeastern Michigan. Wayne County’s rate peaked at 1,213.6 in 2010 but has since declined to 872.6 per 100,000 people in 2018. The sheer number of chlamydia cases reported in Wayne County in 2018 was 15,305. The county with the lowest number of cases per capita was Livingston County. In 2009 the rate was 112.1 cases per 100,00 people and by 2018 that number increased to 312.5 cases per people. In 2018, 318 cases of chlamydia were reported in Livingston County. Unlike with Wayne County, all the other counties in the region experienced an overall increase in the rate at which people were contracting the infection. Of the three types of STDs explored in this post, chlamydia has the highest number of cases reported, making it the most common.

The national trend also appears to show an increase in the number of people becoming infected with an STD. Although no specific reason was given for the decrease in Wayne County’s number it could be related to an increase in information related to sexual education and access to condoms, which are the primary prevention source beyond abstinence.

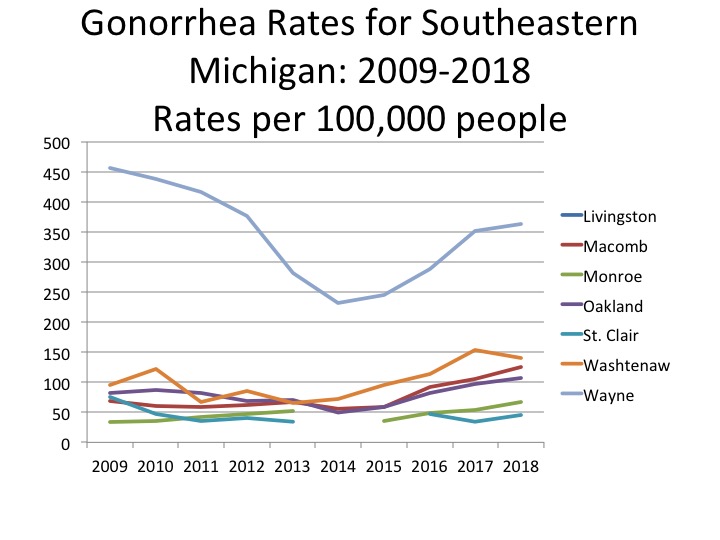
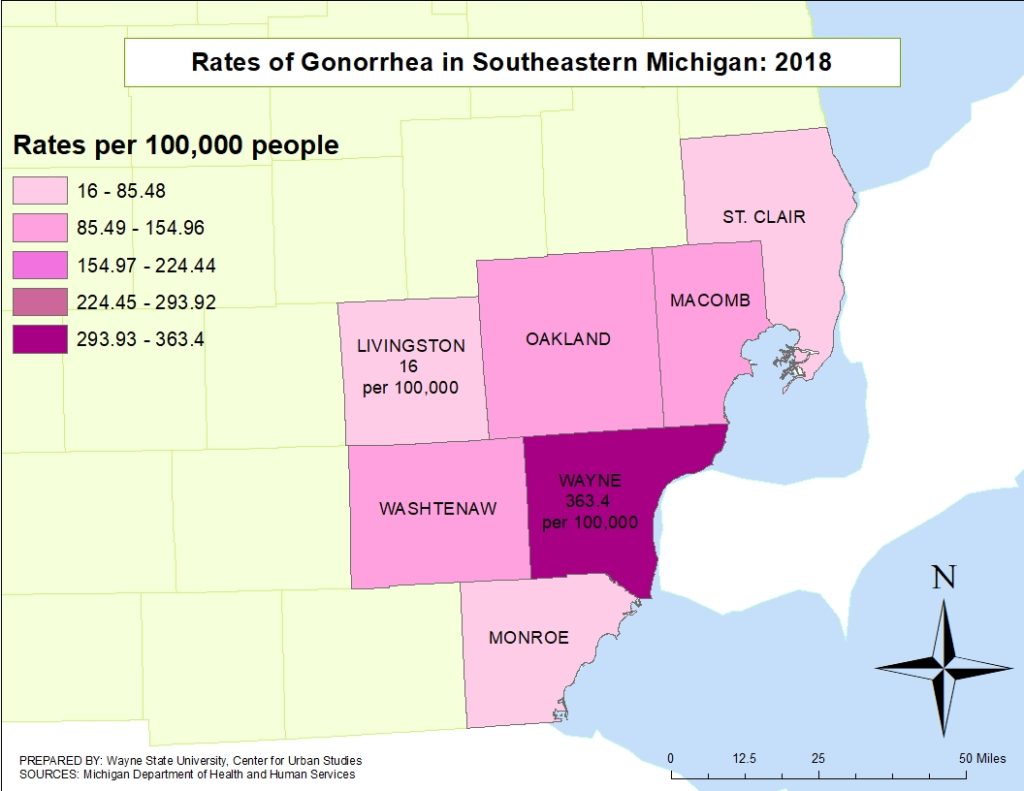
Wayne County again had the highest rate for the STD examined in the chart below, which is gonorrhea. However, the trend for this infection is not as similar to the trend for chlamydia. For Wayne County, there were 457.2 gonorrhea cases per 100,000 people reported in 2009, and while that number dipped to 213.4 cases per 100,000 people in 2014 it has since increased to 363.4 cases per 100,000 people. While it is fair there has been an overall decrease in the amount of gonorrhea cases reported over the last 10 years, there seems to be a trend of those numbers rising. In 2018 in Wayne there was a total of 6,374 gonorrhea cases reported.

St. Clair County regularly had the lowest rates reported for gonorrhea infections between 2009 and 2018. In 2009 there were 79 cases reported per 100,000 people and in 2018 that number decreased to 45.2 (72 cases total). However, the number of cases dropped so low in 2014 and 2015 a rate wasn’t able to be calculated, again showing the trend where there has been an overall decrease in cases, but the numbers are beginning to tick up.

For some counties, like Macomb, Oakland and Washtenaw, the per capita number has increased above the  number reported in 2009. Washtenaw County had the second highest per capita number of cases reported throughout the time frame. In 2018 the gonorrhea rate was 141 cases per 100,000 people (523 cases). While an overall increase from the 2009 rate of  95.8 cases 100,000 people, it is more than 200 points below the Wayne County rate.

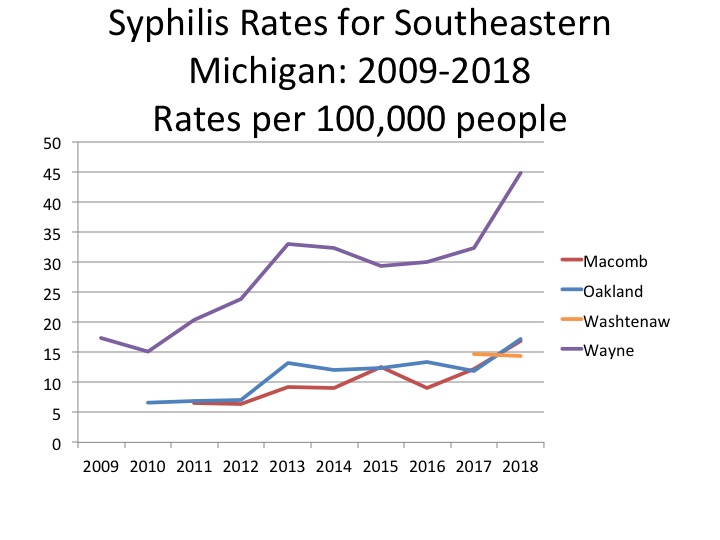
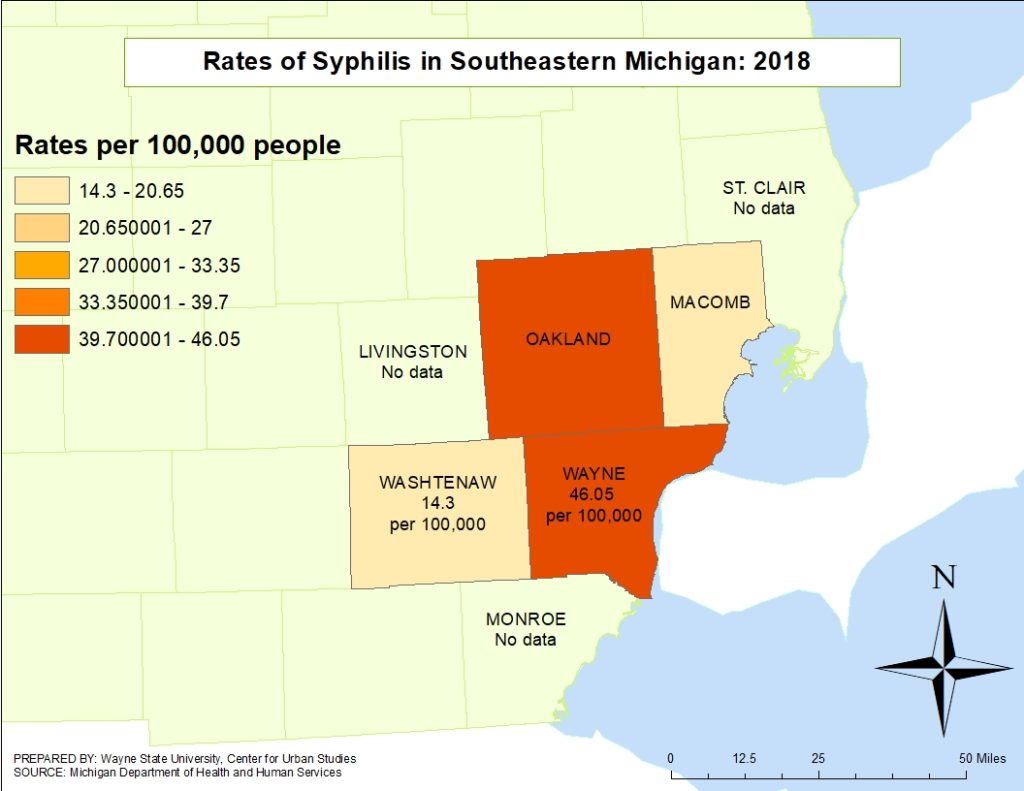
Syphilis has the lowest rate among the sexually transmitted infections examined in this post, so low that only data for Wayne, Macomb Oakland and Washtenaw counties was available. Wayne County had the highest rates between 2009 and 2018. In 2009 Wayne County had a rate of 17.4 cases per 100,000 people and in 2018 that increased to 44.8 cases per 100,000 people, or a total of 786 cases. Of the counties with reported data it was Macomb County with the lowest rates, in 2011 (the first year when per capita data was reported) the rate was 6.8 cases per 100,000 people and in 2017 (the most recent year for data) the rate increased to 11.8 syphilis cases per 100,000 people, or 148 cases.

Overall the trend remains that the number of STD cases continue to rise, with the 26 years of age and under population experiencing the largest number of cases, according to the Michigan Department of Health and Human Services. In the charts above you will see that Washtenaw County regularly falls in second or third in terms of rankings for the per capita rates of any one of the three infections discussed above. This likely has to do with the fact that Washtenaw County is home to both the University of Michigan and Eastern Michigan University.

Overall, experts believe part of the rise is related to misinformation or overall lack of information on STDs. They urge those who are sexually active to be open and honest with both their partner(s) and health care providers about regular testing, and proper treatment if necessary, to ensure the STD isn’t spread to additional people. Information on ways to best prevent STDs, such as use of condoms, regular testing and abstinence, are also encouraged to be discussed more with all individuals, particularly those under the age of 26.

For more information on STD testing, prevention and other information click here

Economic Indicators: Industrial Areas Seeing Increase in Leasing

In October of 2019 the unemployment rate for the State of Michigan was 3.5, the same as it was for the month of September, according to the most recent data provided by the Michigan Department of  Technology, Management and Budget. The State unemployment rate for October of 2018 was only slightly higher than it was this year in October, 3.7.

In October of 2019 Detroit’s unemployment rate was 7.8 percent.  That Detroit unemployment rate was 0.7 points lower in October of 2019 from the previous month. Also, the October 2019 unemployment rate for Detroit was 1.5 points lower from the previous year. In October of 2018 it was 9.3 percent.

The chart above displays the unemployment rates for each of the seven counties in Southeastern Michigan for October of 2018 and 2019. In October of 2019 Wayne County had the highest unemployment rate at 4.5. Washtenaw County had the lowest unemployment rate at 2.5.

Between October of 2018 and 2019 each county in the region had a lower unemployment rate in 2019 than the previous year; the county with the largest decrease was Macomb County. In October of 2018 the unemployment rate in Macomb County was 4.1 and in October of 2019 it decreased to 3. Also, Macomb, Livingston, Monroe and Washtenaw counties all had unemployment rates at 3 percent or lower while St. Clair and Wayne counties had unemployment rates at 4.1 and 4.5, respectively.

The availability of industrial spaces is another aspect of an area’s financial health and below is information from the quarterly reports of Cushman and Wakefield, a global real estate firm, which produces information related to Metro-Detroit. According to the company, leasing of industrial spaces in the third quarter of 2019 is up from the second quarter, with the Airport area having the strongest increase by landing companies such as DSV and Crane World Wide Logistics with their lease renewals. Additionally, the overall vacancy rate in the Metro-Detroit area is at 2.9 percent, and as shown in the first chart below the Downriver and East side areas have the lowest vacancy rates at 1.5 percent. The Southfield area has the highest vacancy rate at 5 percent.

The second chart below shows the average cost of industrial spaces in the region per square foot. There are three different types of industrial space as defined by Cushman and Wakefield and those are: manufacturing, office space and warehouse/distribution spaces. As the chart shows, office space has the highest market value, with the Southfield area having the highest cost at $14.19 per square feet. In nearly all the areas warehouse/distribution spaces has the second highest cost with Southfield again having the highest market rate at $7.15 per square foot. In the Downriver and Troy areas though manufacturing spaces have a higher market rate than the warehouse space. In Downriver, manufacturing spaces average $4.94 per square foot and warehouse spaces average $4.80 per square foot; in Troy manufacturing spaces average $7.22 per square foot and $5.60 per square foot for warehouse spaces. Troy also has the highest market value for manufacturing spaces in the region.

According to Cushman and Wakefield, there is an expectation that utilization of industrial spaces will continue to increase in 2020 meaning a continuation of low vacancy rates.

The above chart shows the Standard and Poor’s Case-Shiller Home Price Index for the Detroit Metropolitan Statistical Area. The index includes the price for homes that have sold but does not include the price of new home construction, condos, or homes that have been remodeled.

According to the index, the average price of single-family dwellings sold in Metro Detroit was $129,250 in September 2019; this was $800 lower than the average family dwelling price in August. The September 2019 price was an increase of $4,460 from September of 2018 and an increase of $11,650 from September of 2017, an increase of $19,470 from September of 2016 and increase of  $25,670 from September of 2015 and, finally, an increase of 
$30,910 from September of 2014.

Revenue Sharing for Michigan Counties Remains Stagnant

The State of Michigan has consistently disinvested in local government by providing less and less in revenue sharing. Cities, townships, villages and counties all rely on this funding to address there budget needs. But, since 2002 the State has withheld more than $8 billion. We have discussed the loss of revenue sharing-both constitutional and statutory-for the local municipalities, however we have not explored revenue sharing at the county level. Unlike cities, townships and villages, counties do not receive constitutional revenue sharing but rather only statutory revenue sharing. The chart below shows data from the Department of Treasury, which reported on the amount of revenue sharing each county received since 2013. The 2020 number below is the expected amount each county is to receive for fiscal year 2020.

According to the State Revenue Sharing Act of 1971 counties are to receive between 21 and 25 percent of sales tax revenue at the 4 percent rate. That changed for a short period of time when in Fiscal Year 2004-05 revenue sharing payments to counties were temporarily suspended. At that time counties were required to create a reserve fund with their own general fund dollars; counties were then allowed to withdrawal funds in lieu of the state revenue sharing funds that were not being dispersed, according to the Senate Fiscal Agency. Once a county exhausted its reserve fund then it could again become eligible for state revenue sharing funds. To add to that, in 2013 counties also became eligible for County Incentive Program Funds; 20 percent of a counties revenue sharing was based on eligibility in this program. These funds are allocated if a county meets certain transparency and accountability standards set by the State.

As the chart shows above, there has not been a serious increase in county revenue sharing since 2015, and between 2014 and 2015 Wayne County received the largest increase of about $10 million. This increase did not come from the County Incentive Program Funds, which accounted for about $10 million in 2014 and 2015, but from its statutory funding. In 2014 Wayne County received about $40 million in revenue sharing and in 2015 that increased to about $50 million. For Fiscal Year 2020 Wayne County it was proposed Wayne County receive about $52 million in revenue sharing, a small increase from its $50 million appropriation in 2015. In 2020 Wayne County’s revenue sharing payment is to be eligible to be $42 million from statutory funding and $10 million from the County Incentive Program. 

Another item to note is how Oakland County did not receive revenue sharing in 2013 and 2014. According to the data Oakland County was not eligible for any type of revenue sharing funding in either year. Although no specific information was available as to why, it could have been that the County used its reserve funds by 2013 and was not eligible for restored funding from the State until 2015.

One of the components of revenue sharing formulas is population, which is reflected in the amount of funding each county received in the chart above. Wayne County has the largest population, which is why it has consistently received the highest amount of funding and counties like Monroe and St. Clair or more rural with more lower populations and lower funding amounts.

Overall, the chart above show how revenue sharing for counties in Southeastern Michigan (and at a greater level, across the state) has remained stagnant for several years. The stagnation, and loss, of revenue sharing funds directly impacts that services a county provides. According to the Michigan Association of Counties, counties have lost $2.4 billion in revenue sharing funds. Additionally, in 2019, cities, townships and villages received more than $1 billion total in both constitutional and statutory revenue sharing funds and counties received $221 million in statutory funding. We will also look

Fertility Rates in Michigan Continue to Decline

Fertility rates in the United States and in Michigan have been steadily declining. According to the Michigan Department of Health and Human Services, since the year 2000 fertility rates in the U.S. peaked at 69.5 births per 1,000 women of child bearing age in 2007. Since then the rates have continued to fall. Between 2011 and 2016 the fertility rate hovered between 63.2 and 62 before dropping to 60.3 in 2017 and 59.5 births per 1,000 women of child bearing age in 2018. In Michigan, the fertility rate has consistently been lower than that of the U.S., but it too has been on the decline. Since the year 2000 the fertility rate peaked in 2000 at 63 births per 1,000 women of child bearing age. Up until 2009 the fertility rate fluctuated between about 62 and 60.5, then in 2009 the rate dropped to 58.8 births per 1,000 women of child bearing age. Between 2013 and 2016 the fertility rate again increased to about 60 births per 1,000 women of child bearing age  before again dropping to 59.5 in 2017 and 58.5 in 2018. In raw numbers, in 2018 there were 110,293 births in Michigan, the lowest number since 1941.

According to a recent New York Times article, fertility rates tend to decrease with economic downturns. This happened with the Great Depression and then again with the Great Recession in 2008. However, while fertility rates rebounded following the Great Depression this has yet to happen following the recent recession. Stable fertility rates are important as they help ensure there will be a healthy workforce to keep the economy moving and to care for the elderly populations.

Below is a chart detailing the fertility rates for all of the seven counties in Southeastern Michigan in 2018, along with the rate for the State of Michigan and the City of Detroit. The only county to have a higher fertility rate than the State was Wayne County. In 2018 the fertility rate for Michigan was 58.5 births per 1,000 women between the ages of 15 and 44 and for Wayne County the fertility rate was 66.2; the City of Detroit had a fertility rate of 70.2. Washtenaw County had the lowest fertility rate at 40.5 births per 1,000 women between the ages of 15 and 44. One possibility for the low fertility rate in Washtenaw County is the fact that the county is home to the University of Michigan. With such a high college population, where the typical age is concentrated in the lower 20s, it is quite possible that the fact that fewer women in their 20s are having children contributed to the county’s low fertility rate.

In addition to publishing fertility rate data by county, the Michigan Department of Health and Human Services also publishes it by race. Below is the data for the year 2018 by county for white women. The fertility rate for white women in Michigan in 2018 was 55.2 births per 1,000 women between the ages of 15 and 44, and Wayne and St. Clair counties were the only two in the region with higher fertility rates. Wayne County had a fertility rate of 58.7 in 2018 and in St. Clair County the fertility rate for white women between the ages of 15 and 44 was 57.8. White women in the City of Detroit also had a fertility rate higher than the state; Detroit’s fertility rate per 1,000 white women between the ages of 15 and 44 was 57.9.

The fertility rate for black women in 2018 in Michigan was 67.6 births per 1,000 women between the ages of 15 and 44. Again, there was a higher fertility rate for black women in Wayne and St. Clair counties than at the state level; those rates were 71 and 70.7, respectively. The City of Detroit also had a higher fertility rate than the state at 69.2. A fertility rate was not available for Livingston County.

It should also be noted that the fertility rate for black women in the State of Michigan and across the counties in Southeastern Michigan was higher than the fertility rates for white women in the region and at the state level.

As fertility rates decline it is also important to understand that there seems to be a shift in the age women are choosing to have children. According to the same New York Times article, at the national level, fertility rates have declined the most among teenage women; the fertility rate for teenagers has declined 70 percent since 2001. Women in their 20s are also having fewer children, despite this age group traditionally having the highest fertility rate. In 2016 it was women in their early 30s who had the highest fertility rate. By 2018, the only age group that experienced an increase in fertility rates was women in their late 30s and early 40s.  Also, according to the article, more than half the women in the U.S. who had children in their 30s had a college degree; this was more than the amount of women in their 20s with children and college degrees. There is a belief that women are waiting longer to have children to ensure their financial stability, career trajectory and that they have enough resources to provide for their children.