Metro-Detroit Women Less Represented on Elected Bodies

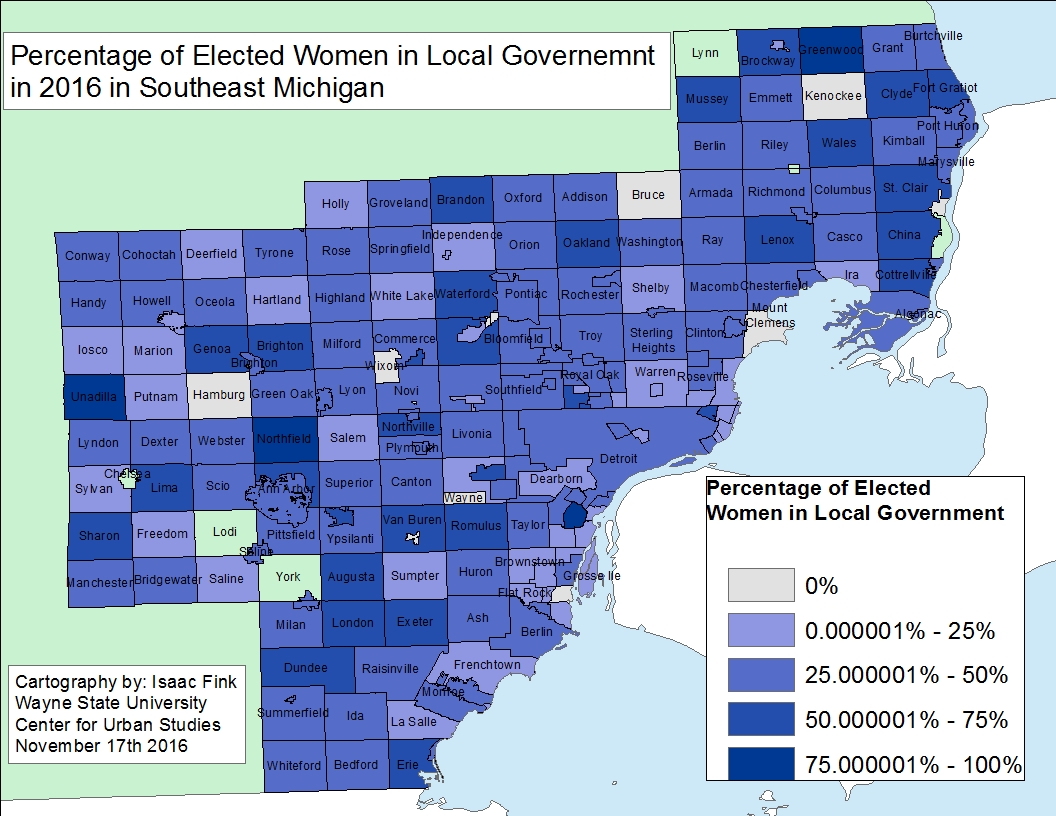
While women make up 51 percent of the Nation’s population, they do not hold at least 50 percent of the elected positions. This is true at the national level where women currently hold less than 20 percent of the seats in Congress. In Michigan women make up 20 percent of the state legislature (women currently hold 31 of the 148 seats). Digging beyond elected positions at the national and state level, we see that at the local level in Southeastern Michigan women generally hold between 25-50 percent of the elected seats in a municipality.

The data used for the maps represent individuals currently holding office; the maps do not reflect who was elected to serve beginning in 2017. Municipalities with an “NA” have that designation because the information could not be found.

In Southeastern Michigan there are nine municipalities where there are no women currently sitting on the city council or township board. The majority of the region though has elected bodies where women make up 25 to 50 percent of the council or board. Greenwood Township in St. Clair County is the only municipality in the region with an entirely female board. In Greenwood Township the board is made up of five positions-supervisor, clerk, treasurer and two trustees-each of which is currently held by a female. Of all the counties in the region, St. Clair County has the highest percentage of municipalities where more than 50 percent of a township board or city council is made up of women. In Wayne County, the average percentage of women holding a seat on a township board or city council is 31 percent; three of the municipalities with no women elected to the public body are located in Wayne County. In Detroit, 44 percent of the City Council is made up of women.

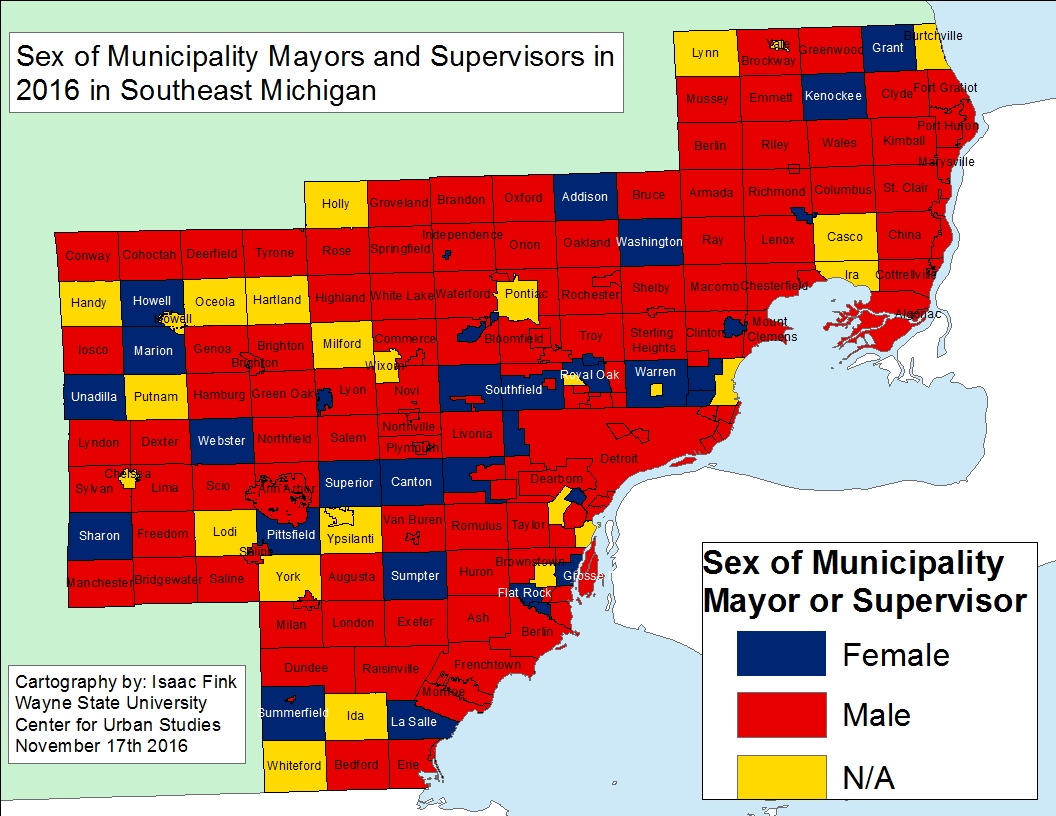
In the second map below we see that women are less represented in the top leadership roles of elected bodies of a township board or city council. Of the about 220 municipalities in Southeastern Michigan only 29 have women serving as a Township Supervisor or a Mayor. Wayne County had the bulk of these women; there are currently eight municipalities there with a woman township supervisor or mayor. In Oakland County there are six municipalities with women serving as a township supervisor or mayor and in Macomb County there are five. Monroe and St. Clair counties both had the least amount of women elected to serve in such roles. There are only two municipalities in each county with women serving as a township supervisor or mayor.

While there are pockets of Southeastern Michigan where women are more represented on local elected bodies than those in Congress or in the Michigan Legislature, the overall trend still shows that women typically make up less than 50 percent of an elected body. Although not an elected position, women are also less represented in leadership roles when it comes to local government administration. In a future post we will look at what sex of city managers and top administrators of local municipalities.

percentage-of-women-in-local-government-with-labels-and-city-boundaries_jpeg

sex-of-mayor-or-supervisor-with-labels-and-city-boundaries_jpeg

Fatal Alcohol Related Traffic Accidents Least Common in Northern Michigan

In 2015 it was counties in the Upper Peninsula of Michigan that had the highest amount of traffic accidents and deaths, per capita, from traffic accidents, according to the Michigan of State of Police. Luce County had the highest number of traffic injuries per 10,000 residents at 17.15 (40 total) and Baraga County had the highest number of deaths from traffic crashes per 10,000 residents at 1.17 (1 total). Of these injuries and deaths several were directly related to alcohol, a trend that occurred throughout the state. However, when looking beyond the per capita numbers, we see that it was in Southeastern Michigan where the highest number of traffic related injuries and deaths occurred, both where alcohol was and was not a factor, throughout the state. These high numbers can be, at least in part, attributed to the denser population in that region of the state.

In Wayne County in 2015 there were 191 traffic fatalities, 59, or 31 percent, of which were related to alcohol. Additionally in Wayne County, there were 15,713 total traffic crash related injuries in 2015. Of those injuries, 836, or 5 percent, were related to alcohol being involved in the crash. In Oakland County, of the 67 total traffic fatalities, 18 were related to alcohol (27%) and of the 10,406 traffic injuries 608 (6 %) were related to alcohol. In Macomb County, there were 17 fatal accidents related to alcohol out of 59 total fatal traffic accidents (28%) in 2015. In addition, there were 389 alcohol related traffic injuries in Macomb County; this accounted for 5 percent of the total number of traffic crash related injuries.

Of the fatal traffic accidents throughout Michigan in 2015 there were four counties where alcohol was a factor in 100 percent of the traffic fatalities. These counties were: Mackinac, Baraga, Gogebic (all in the Upper Peninsula) and Mecosta. All three of the Upper Peninsula counties had one traffic fatality, all of which were attributed to alcohol being involved in the crash. Mecosta, in Mid-Michigan in the lower Peninsula, had four fatal traffic accidents in 2015, all of which alcohol played a factor in.

Conversely, there were 31 counties in the state where there were no alcohol related traffic fatalities. However, 28 of those 31 counties had zero total traffic related fatalities. Majority of these counties were located in Northern Michigan. Traffic accident injuries related to alcohol though occurred in every county in 2015, according to the Michigan State Police.

slide3

slide4

slide5

slide6

Vacancy Rates in Detroit Remain Stagnant

In the City of Detroit in September 2016 the total percentage of vacancies was 21.9 percent, according to the U.S. Postal Service. This vacancy percentage was nearly unchanged from the 22 percent total vacancy rate the U.S. Postal Service reported in June of 2016. Similarly, when looking at the percentage of residential vacancies and business vacancies in the City these too nearly went unchanged between June and September. The U.S. Postal Service reports that the September 2016 residential vacancy rate was 22.4, down 0.1 percent. The September 2016 business vacancy rate was 25.9, up .02 percent from June.

Overall, in the month of September there were 87,762 reported total vacancies, 80,002 of which were residential, 7,670 of which were businesses and 104 of which were considered “other.” Between June and September, the total 0.1 percent vacancy decrease was equivalent to a decrease of 579 vacant addresses; there was a decrease of 641 vacant residential addresses and an increase of 62 vacant business addresses.

The first two maps below show, by Census Tract, the total number of vacancies and the total percentage of vacancies. The Census Tract with the highest number of total vacancies is on the east side, just north of Belle Isle. This Census Tract had 906 vacancies, which was 50.6 percent of the total number of structures in that Census Tract.

As the first map shows, majority of the Census Tracts with vacancies above 400 were located either on the cities east side, or just west of the downtown area of Detroit. When looking at the total percentage of vacancies in Detroit by Census Tract we see there is a slight shift in which Census Tracts have among the highest amount of vacancies in terms of percentage versus total numbers. This is directly related to the total number of structures in each Census Tract. For example, just east of Hamtramck there is a Census Tract with 229 vacant addresses, a number that does not put in amongst the Census Tracts with the highest vacancy numbers. However, these 229 vacant addresses in that Census Tract mean there is a 42.9 percent vacancy rate. Just south of that Census Tract is another where there are 307 vacancies which make up 18 percent of the structures there.

slide4

slide5

When comparing the total number of vacancies between September 2015 and 2016 we see that there are several Census Tracts that experienced an increase in the total number of vacancies. It was a Census Tract just north of Highland Park that experienced the greatest increase at 7.8 percent. Vacancy increases over the last year occurred the most on the City’s east side, however they were not isolated there.

Overall, while there were Census Tracts with vacancy rate increases there was a total decrease of 5,446 vacant addresses between September 2015 and September 2016.

In addition to these changes, in September of 2016 there was a decline in the number of “no stat” addresses; that number decreased by 2084 in the last year. Mail carriers denote properties as being either “vacant” or “no-stat.” Carriers on urban routes mark a property as vacant once no resident has collected mail for 90 days. Addresses are classified as “no-stat” for a variety of reasons. Addresses in rural areas that appear to be vacant for 90 days are labeled no-stat, as are addresses for properties that are still under construction. Urban addresses are labeled as no-stat when the carrier decides it is unlikely to be occupied again any time soon — meaning that both areas where property is changing to other uses and areas of severe decline may have no-stat addresses.

slide7

Discrepancies Exist Between Detroit Demolitions and Vacancy Rates

Since January 1, 2014 the City of Detroit reports on its Demolition Program webpage that there have been 10,667 demolitions of vacant buildings as part of its blight removal program, as shown in the maps below. These demolitions were made possible through the Detroit Demolition Program, which receives federal funding to aid in the removal of blight. Just last week it was announced the U.S. Department of Treasury released an additional $42 million in funds to support the program. However, that funding, and the program, was suspended from August through just a few weeks ago while the U.S. Department of Treasury and the Michigan State Housing and Development Authority worked to create new guidelines for the demolition program. These guidelines create greater oversight by limiting the number of houses in a bid package, requiring more transparency in what subcontractors are used and having state employees working in the Detroit Land Bank and Building Authority offices, according to the Detroit News.

According to the City of Detroit’s demolition project page, there are 2,459 structures in the demolition pipeline, meaning they are scheduled to be demolished in the near future, and 3,096 that have already been demolished in 2016. The first two maps below show the 10,667 demolitions that have occurred in the City, by Census Tract, since January 1, 2014. The data used to create those two maps was provided from the City of Detroit’s Open Data Portal.

The third map shows vacancies in the City of Detroit, as reported by the U.S. Postal Service.

slide7

slide8

slide6

The first two maps above illustrate how certain areas of the City experience much lower rates of demolition than others. The third map shows what the vacancy rates were in the City of Detroit as of June 2016. In comparing the first two maps with the third we are able to identify discrepancies there are between where demolitions are occurring and where vacancy rates are the highest.

When examining the first two maps we see on the City’s northwest side (in the Evergreen/Rosedale area), within one Census Tract there were 295 demolitions between January 1, 2014 and October 13, 2016. The third map shows that as of June 2016 there was a 35.9 percent vacancy rate in that Census Tract, according to the U.S. Postal Service. There was only one other Census Tract in the City that had more than 200 demolitions. This Census Tract was located in the Cody/Rouge area on the west side of the City. This Census Tract had a vacancy rate of 37.5 percent in June of 2016, according to the U.S. Postal Service.

The Census Tract with the highest vacancy rate in June of 2016 is just east of Groesbeck Avenue (M-97); it had a vacancy rate of 50.3. However, according to the demolition data there have only been 15 demolitions in that Census Tract since January 1, 2014. Overall, this pocket of the City (northeastern area of the City along M-97) had vacancy rates ranging between 38 and 51 percent while the number of demolitions per Census Tract, in general, ranged between 15 and 54. There were exceptions, such as the two neighboring Census Tracts just east of I-94 where the vacancy rates were 33.6 percent and 31.6 percent and the number of demolitions in both areas were among the highest in the City, 147 and 145 respectively.

Areas in the City with among the lowest vacancy and demolition rates are Midtown, Downtown and Corktown. Also, Midtown and Downtown have some of the City’s newest housing units. Other areas in the City with the lowest demolition numbers are located on and around the Woodward Corridor, both north and south of Highland Park. The Palmer Park area, and the neighborhood to the west had several Census Tract where there were less than 10 demolitions in the time frame mapped. This area, in general, also had lower residential vacancy rates in June of 2016, ranging between 6 and 15 percent by Census Tract.

Near the Woodward Corridor though there are three Census Tracts, all of which border Highland Park, that had between 121-200 demolitions with vacancy rates for those three Census Tracts ranging between 20 and 35.

While a great deal of blight removal has already occurred in the City, there is still plenty of work to do. According to the City’s website, the goal is to remove 40,000 blighted properties within an eight year time frame. This post shows certain areas where there have been high rates of demolition in areas with high vacancy rates. However, this post also shows the opposite-Census Tracts with high vacancy rates and low demolition numbers. As the City moves forward with reaching is 40,000 structure demolition goal vacancy rates should continuously be monitored to help determine demolition priorities.