Southeastern Michigan Median Incomes Have Yet to Catch Up to Pre-Recession Numbers

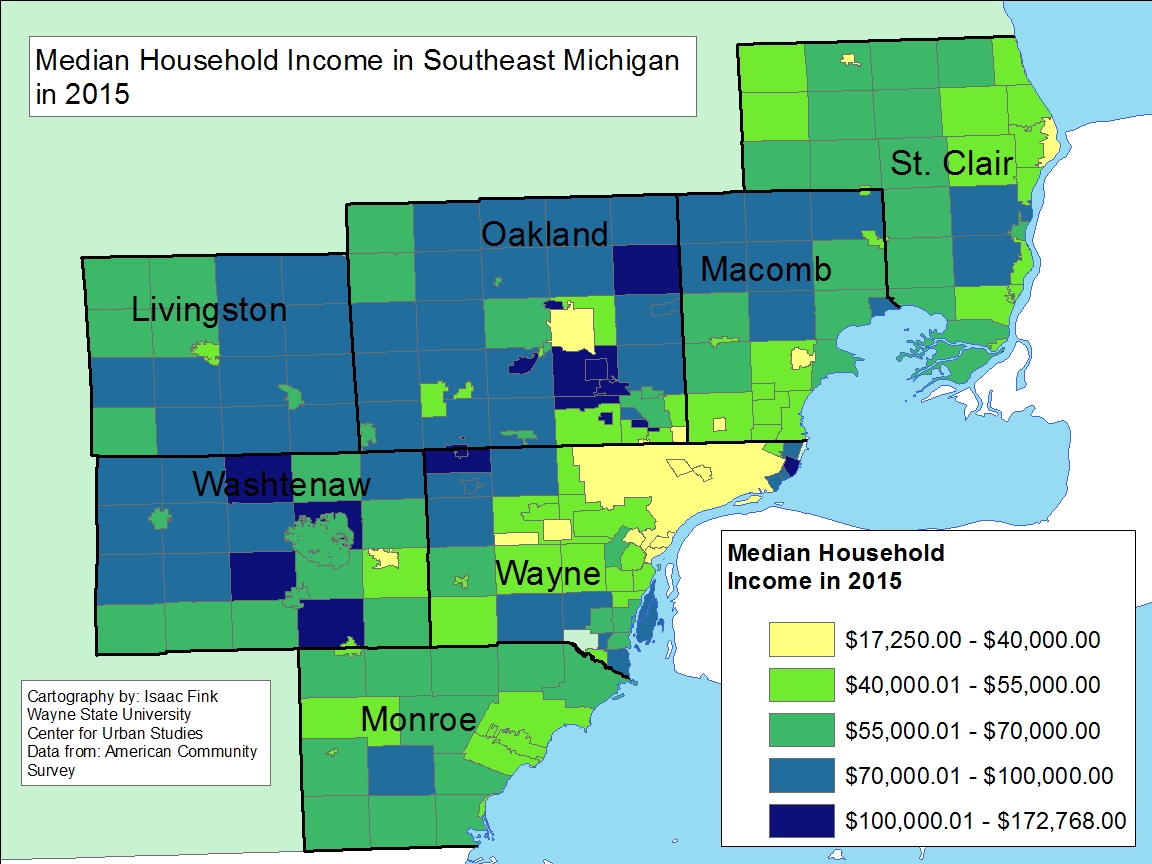
Between 2000 and 2015 median incomes in cities and townships throughout Southeastern Michigan declined by an average of 20 percent, according to U.S. Census Data. This percentage, and all percentages discussed in this post were adjusted to 2015 dollars to best show the true decline in incomes throughout the region. (Note that this percentage is the average across cities and townships, each treated equally. Therefore it will be different from a number aggregated across individuals as opposed to municipalities.)

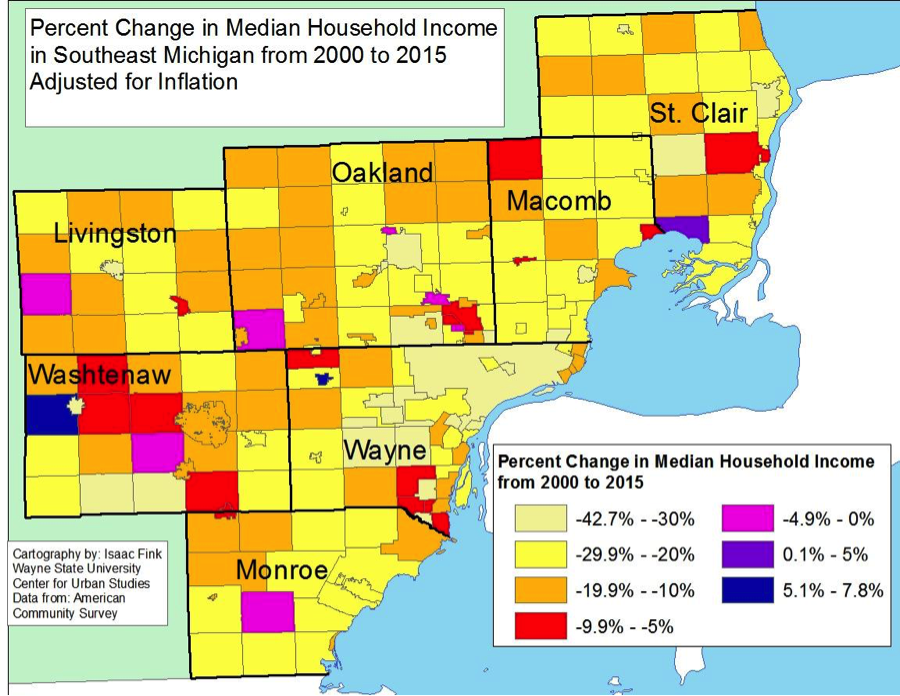
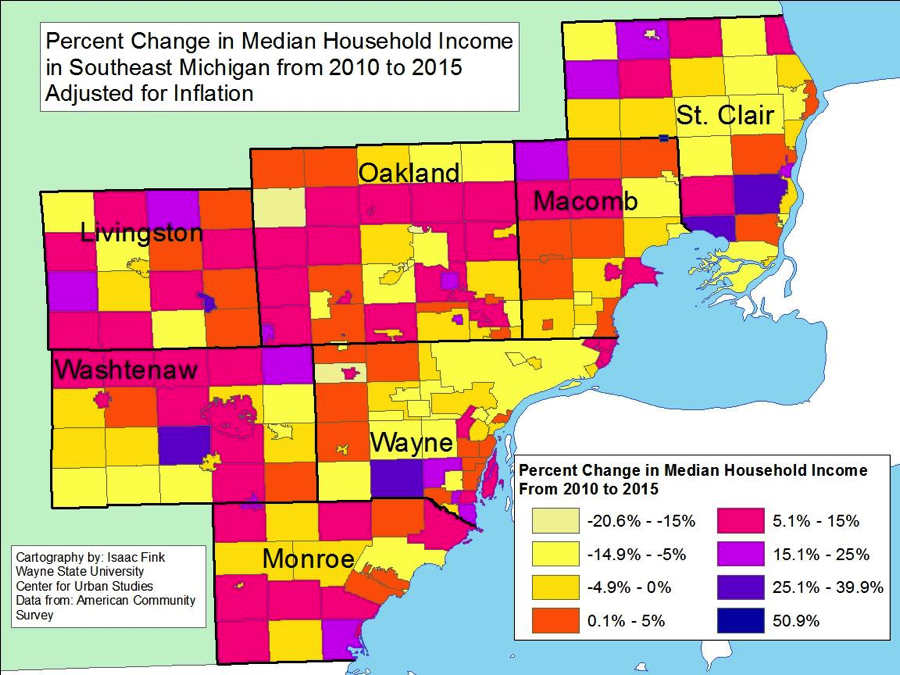
In our last post we highlighted how the city of Bloomfield Hills had the highest median income at $172,768 in 2015. This data shows that incomes for Southeastern Michigan’s highest income community decreased by 26.5 percent overall from 2000 through 2015, but this broken down between a 36.7 percent decline between 2000 and 2010 and a 16 percent increase between 2010 and 2015. These statistics further add weight to the narrative that the wealthiest are financially bouncing back much more quickly since the recession, while the middle class and low income families have been making minimal gains, at best. Between 2010 and 2015 there were 15 communities where median incomes increased at least 20 percent. Of those communities, the average median income in 2015 was about $77,000 while the average median income for the region was about $66,500. In total, there were 117 communities in Southeastern Michigan that experienced an increase in median income between 2010 and 2015. On the opposite end of the spectrum, there were 10 communities with median incomes above $80,000 in 2015 that experienced a decline in median income between 2010 and 2015; of those 10 communities seven experienced a decline of less than 5 percent.  

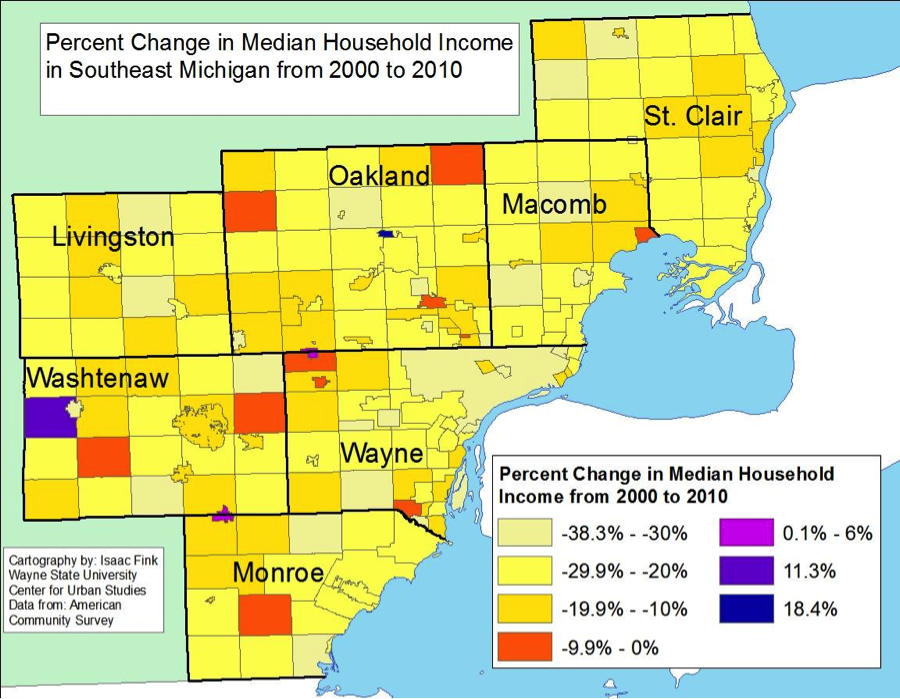
Between 2000 and 2010 there were only 5 communities that experienced median income growth. Overall though, the average change in median income (adjusted) between 2000 and 2010 was negative 22 percent; there were 136 communities in Southeastern Michigan that experienced median income declines above 20 percent during that time frame.


There were 117 communities in Southeastern Michigan that experienced an increase in median income between 2010 and 2015. These communities showed an average increase of almost 10 percent. At the same time, 91 communities in the region experienced decreases in median income by an average of roughly 6 percent. Between 2010 and 2015 median incomes in all of Southeastern Michigan increased by an average of nearly 3 percent.


While the data shows a modest median income growth post recession (2010 to 2015), median incomes were down by approximately 20 percent in 2015 compared to what they were in 2000. Since then, there have been only 5 communities that have experienced any median income growth—City of Northville, Sylvan Township, City of Plymouth, Ira Township and City of Memphis. All of these communities experienced an increase in median incomes under 10 percent, with two of them being lower that 5 percent. The other 203 communities in the region exhibited decreases in median incomes by an average of almost 21 percent between 2000 and 2015. It is clear that majority of the regional population is still trying to earn back the wages that once existed in the early years of this century.


The city of Hamtramck experienced one of the largest decline at 34 percent. For the city of Hamtramck, there was an even larger decrease in the adjusted median income between 2000 and 2015 than there was between 2000 and 2010. In 2000 the median income for Hamtramck (adjusted to 2015 dollars) was $36,634 and in 2015 it was reported at $23,759; overall there was a 35 percent decrease. The city, which has one of the region’s lowest median incomes, also experienced a decline in median income between 2010 and 2015.


The city of Detroit is another community where the median income decreased since both 2000 and 2010. According to the data, Detroit experienced a 36 percent median income decrease since 2000 and a 9 percent median income decrease since 2010. In 2000 the median income was reported at about $40,000 (adjusted for inflation) and in 2010 it was reported at about $28,000 (adjusted for inflation). The 2015 median income for the city of Detroit was about $25,000.


Overall, the data show that economic growth since the recession has been slow, at best. Majority of the communities in Southeastern Michigan have yet to recover to their adjusted 2000 incomes. Studies suggest that has to do with several factors, including job availability, average wages, out migration and educational attainment. In this series, we will further explore these factors to better help highlight why the growth has been so slow and what areas are suffering the most.

Bloomfield Hill’s Median Income Ranks Top in Southeastern Michigan

In Southeastern Michigan the average median income was $50,750 in 2015, according to the American Community Survey. Of the seven counties in the region, Wayne County had the lowest median income at $41,210 while Livingston County had the highest at $75,200. Although Livingston County had the highest median income in the region it was Oakland County that had the most number of communities with median incomes above $100,000. In total, there were 12 communities in Oakland County with median incomes above $100,000 and the city of Bloomfield Hills had the highest median income, both county and region-wide, at $172,768.

Income disparity is a growing issue at the national and local levels. In Michigan, this disparity is particularly exemplified due to the fact that the average hourly wage in the state has decreased from what it was a decade ago. According to a recent Crain’s Detroit article, the median hourly wage in Michigan in 2017 is $17.32 and in 2007 it was $18.67. In 2010 in Michigan, residents had a 46 percent chance of out earning their parents, according to a recent Stanford study, which is highlighted in the Crain’s article. The example in the article used to highlight this decline in wages is that in 1977 a newly employed high school graduate at General Motors was earning about $26 an hour (number adjusted with inflation) and today that wage is about $16. Other aspects that contribute to an individual’s economic mobility include access to jobs, particularly those with higher wages, and educational attainment.

In next week’s post we will see how median income has changed regionally since 2000 and 2010, further exploring the claim that upward mobility has declined.


Detroit’s Liquor Licenses Above 1,000

In the City of Detroit there are a total of 1,017 liquor licenses, which equates to about 15 liquor licenses per 10,000 people. A look at the Detroit map below shows that establishments with these licenses are located throughout the city, but patterns occur on major roadways, such as Gratiot and Woodward avenues, and in the larger business districts, such as the downtown area and up into Midtown. There is also a concentration of establishments with liquor licenses in Southwest Detroit.

In Michigan there are several types of liquor licenses which can be obtained, according to the Department of Licensing and Regulatory Affairs, which provided the data for this post. These include licenses needed to sell just beer, those need to sell beer and liquor at a golf course, a hotel, a bar and at a private event. Additionally, brewpubs, distilleries, wholesalers (both those in state and those out of state bringing goods in), winemakers, and stores selling beer and/or liquor need a license. All liquor licenses in the state of Michigan are issued by the Michigan Liquor Control Commission; each license (with the exception of special designated ones) can be transferred anywhere within the county in which the original license was issued.

For this post, there are maps of seven different communities, each one represents the community in each Southeastern Michigan county with highest number of establishments with liquor licenses per 10,000 people. The maps however are dot maps, showing the total number of establishments in each community. The regional map though, which is the first map shown below, represents the number of establishments with liquor licenses per 10,000 people. The per capita calculation was used to best show how many establishments there are per person, or in this case per 10,000 people, so the data could be comparable for each community in the region. Due to how the per capita rate is calculated (taking the old total number of establishments, multiplying it by 10,000 and then dividing that number by the total population) the rate often appears larger than the total number of establishments with liquor licenses.

While Detroit has the highest total number of establishments with liquor licenses in Southeastern Michigan, the village of Memphis has the highest total of liquor licenses per 10,000 people at 63. In total, Memphis, of southern St. Clair County, has 5 establishments with liquor licenses, most of which are concentrated in the downtown business district. The total population of Memphis about 800, a number that plays a role in its high number of liquor licenses per capita. Each community with the highest number of establishments with liquor licenses per 10,000 people in each of the seven counties has smaller population numbers, and of those other six communities The cities of Plymouth and Utica are the only two that have more than 20 establishments with liquor licenses. The city of Plymouth has 39 and Utica has 25 establishments with liquor licenses. The rate per 10,000 people for Plymouth is 44 and the rate for Utica is 53. Plymouth’s population is nearly double of Utica’s at about 9,000 people. The total number of establishments with liquor licenses and the per capita number for the other communities with the highest per capita in each county are:

  • Plymouth (city)-39 (total); 44 (per capita)
  • Uitca: 25, 53
  • Chelsea-19; 37
  • Village of Dundee-14; 35
  • Pinckney-7; 48
  • Clarkston—5; 54

In all of the maps featured below there are two common themes on where the establishments are located. Particularly in Plymouth and Utica, there is a concentration of establishments with liquor licenses in the centrally located downtown districts. In the smaller communities, such as Dundee or Clarkston, the establishments are located along major roadways in the community.

Throughout Southeastern Michigan there are 10 communities with more than 100 establishments with liquor licenses; all of these communities have populations of 75,000 or more. In terms of sheer volume, Ann Arbor has the second highest number of establishments with liquor licenses at 214, which is about 800 less than the number of establishments the City of Detroit has.

According to a study by the Pacific Institute, a high concentration of liquor stores holders can may be related to several public safety and health problems, ranging from high rates of alcohol related hospitalizations, to pedestrian injuries, to high levels of crime and violence. According to data from the Federal Bureau of Investigation we know that Detroit’s violent crime rate was 1,749 per 100,000 residents in 2015 (the most recent data available) and the city’s property crime rate was 4,070, while the state of Michigan’s violent crime rate was 415.5 per 100,000 residents and its property crime rate was 1,889. In Ann Arbor, the violent crime rate was 192 in 2015 and the property crime rate was 1,991.

Unemployment Decreases throughout Southeastern Michigan

  • The unemployment rate decreased at the State and local level(monthly);
  • Regionally, Washtenaw County’s unemployment rate remains the lowest;
  • The average 30-year mortgage interest rate in Detroit is higher than the national average, lower than the week the federal interest rate was increased;
  • The Standard and Poor’s Case-Shiller Home Price Index for the Detroit Metropolitan Statistical Area shows home prices continue to increase monthly and annually.

According to the most recent data provided by the Michigan Department of Technology, Management and Budget, the unemployment rate for the State of Michigan decreased slightly to 5 percent in March of 2017 from 5.3 percent the previous month. The City of Detroit’s rate also decreased, but at a slightly larger rate. In March 2017, the City of Detroit’s unemployment rate was 10.3 percent, a substantial cut from February’s 12 percent. Additionally, unemployment in the City of Detroit decreased from to 11 percent in March of 2016 to 10.3 percent in 2017.

The chart above displays the unemployment rates for each of the seven counties in Southeastern Michigan for March of 2016 and 2017. St. Clair County had the highest unemployment rate for both 2016 and 2017 (7.1 and 6.2, respectively) while Washtenaw County had the lowest rates (3.1 and 2.8, respectively). St. Clair County and Wayne counties were the only two in the region with unemployment rates at or above 6 in March for both years. St. Clair County also had the largest unemployment rate decrease between March 2016 and 2017 at .9; Monroe County had the lowest at .1.

Four of the seven counties (Livingston, Monroe, Oakland and Washtenaw) all had unemployment rates at or below 5 for March of 2017.

Above are three average 30-year mortgage interest rates at the national, state and local levels for the week of May 15, 2017. These rates were provided by bankrate.com, which does a national survey of large lenders on a weekly basis. As a 30-year fixed rate mortgage is the most traditional type of home financing, this was chosen to show the rate differences. The State of Michigan had the lowest average interest rate for the week of May 15, 2017 at 3.82, which was lower than the last time we examined that data (week of May 20, 2017 the rate was 4.14 percent). Also during the week of May 15, 2017 Detroit’s average 30-year fixed mortgage interest rate was higher than the national average; this was not the case during the week of March 20, 2017. During the week of May 15, 2017 Detroit’s average 30-year fixed mortgage rate was 4.12 and the national average was 4.02.

Compared to two months ago, when the Federal Reserve Raised the federal interest rate by .25 percent, mortgage rates at the local (Detroit), state (Michigan) and national level are lower. While the rates are currently lower, the federal interest rate increase is expected to impact credit products, such as mortgages and auto loans, in addition to savings, home equity lines of credit and credit cards.

The above charts show the Standard and Poor’s Case-Shiller Home Price Index for the Detroit Metropolitan Statistical Area. The index includes the price for homes that have sold but does not include the price of new home construction, condos, or homes that have been remodeled.

According to the index, the average price of single-family dwellings sold in Metro Detroit was $111,790 in February 2017; this was $940 higher than the average family dwelling price in January. Also, the February 2017 price was an increase of $8,440 from February of 2016 and an increase of $14,720 from February of 2015 and an increase of $18,370 from February of 2014.