Rural counties in Southeastern Michigan have higher access to vehicles

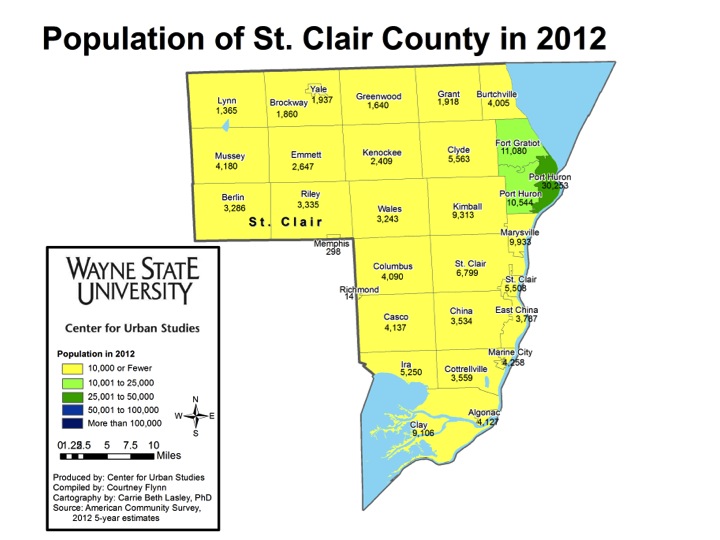
With a weak public transportation system in Southeastern Michigan, access to a vehicle is critical for the commuting to and from work, school and other necessary places. In this post we examine the average number of vehicles residents in Southeastern Michigan residents have access to. The maps will show that at the county level the more rural counties have workers with more access to a vehicle, but at the census tract level it is the wealthier areas with a higher access number.

Data for this post was received from the 2012 American Community Survey. All workers age 16 and above in a household were considered when determining the average number of vehicles a worker has access to.

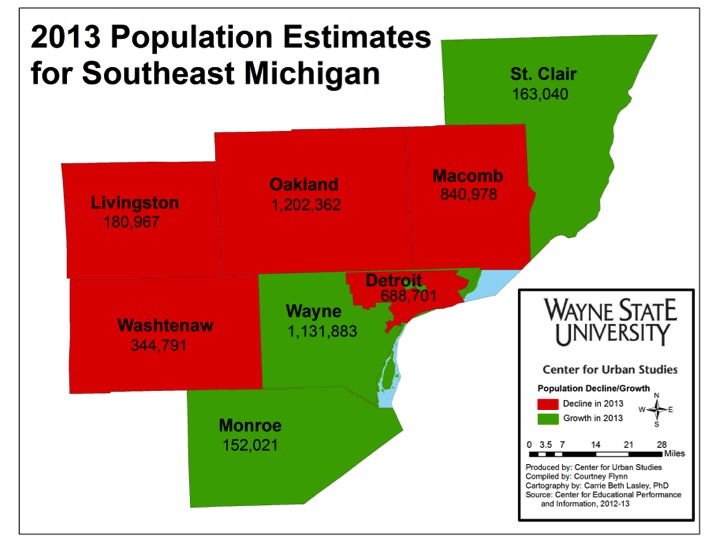
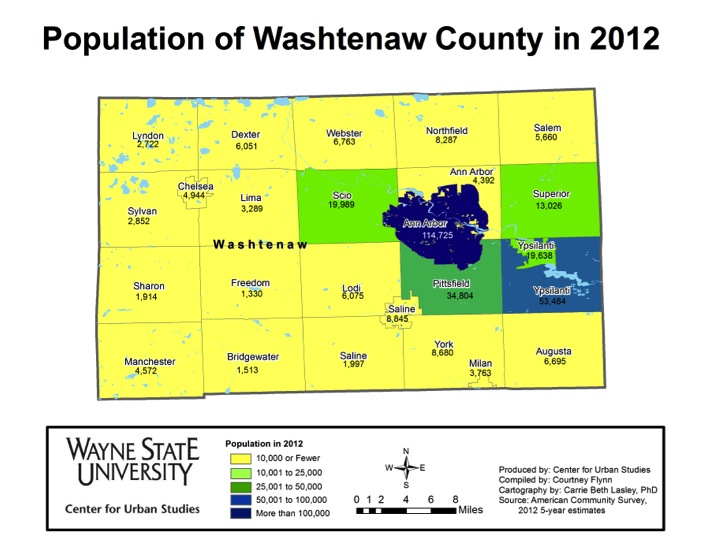
In 2012, in every county in the region, there was, on average, at least one vehicle or more per worker. When examined at the municipal level, even Detroit, where there was less than one car per worker in many census tracts, the average number of vehicles per worker was 1.54.

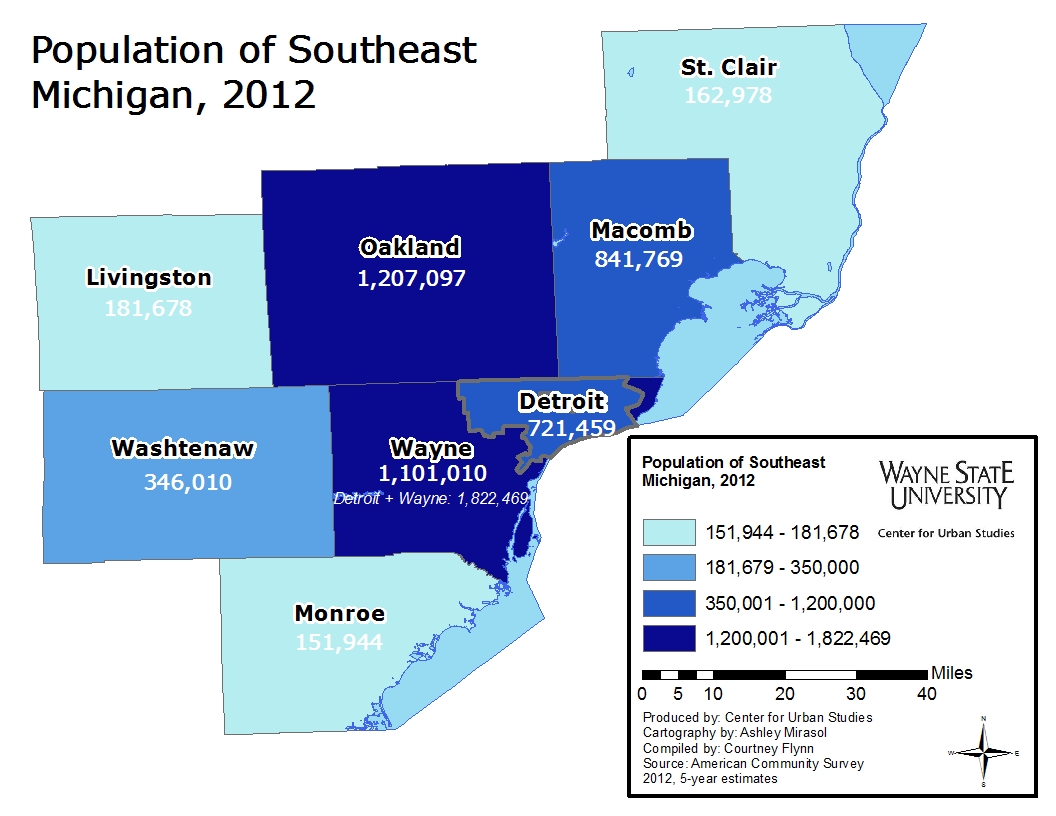
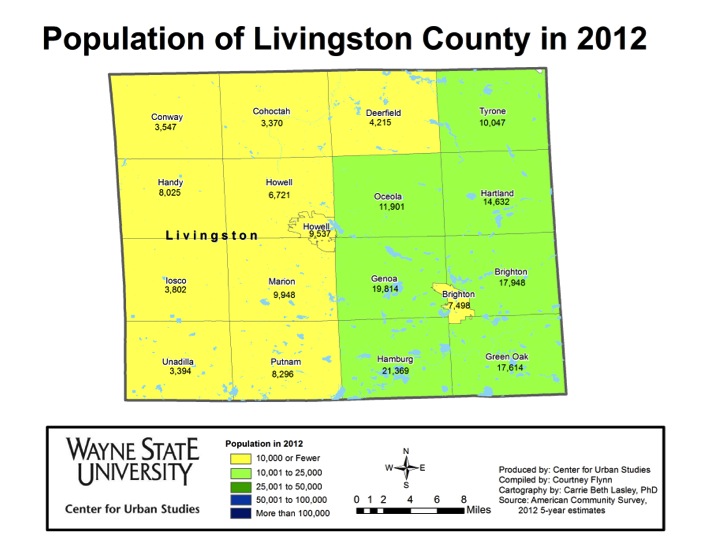
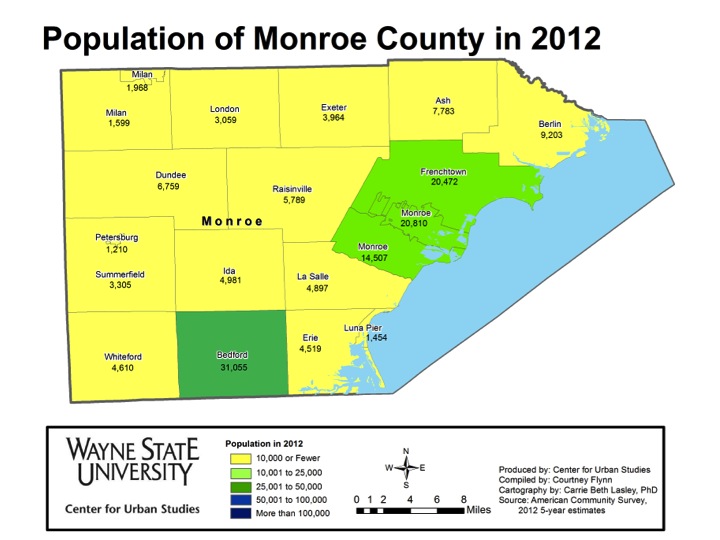
Livingston and Monroe counties, which are both rural, averaged access to the highest number of vehicles per worker in the region. Livingston County averaged access to 2.28 vehicles per worker in 2012 and Monroe County averaged access to slightly less, with 2.20. Wayne County had the lowest average access to vehicles per worker in the region. The average in 2012 was 1.89.

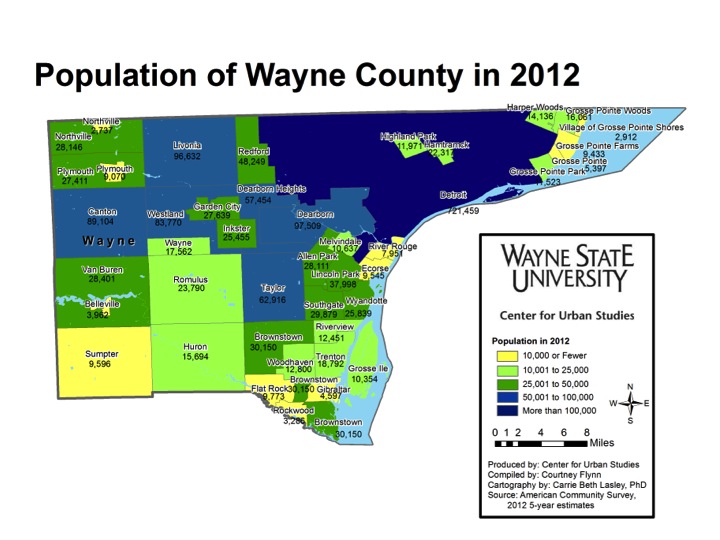
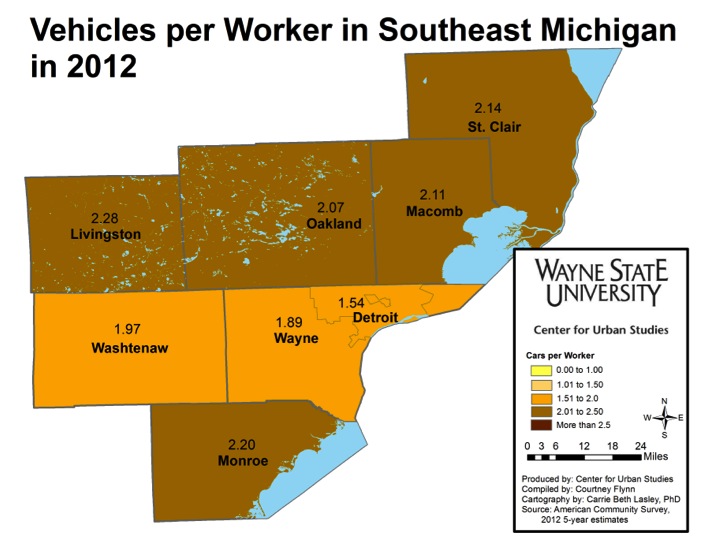
A closer look at the municipalities in the region shows that Highland Park had the lowest access average to the number of vehicles per worker in the region. This access number was 1.34 vehicles per worker. York Township in Washtenaw County averaged access to 2.62 vehicles per worker, making it the municipality with the highest average in the region.

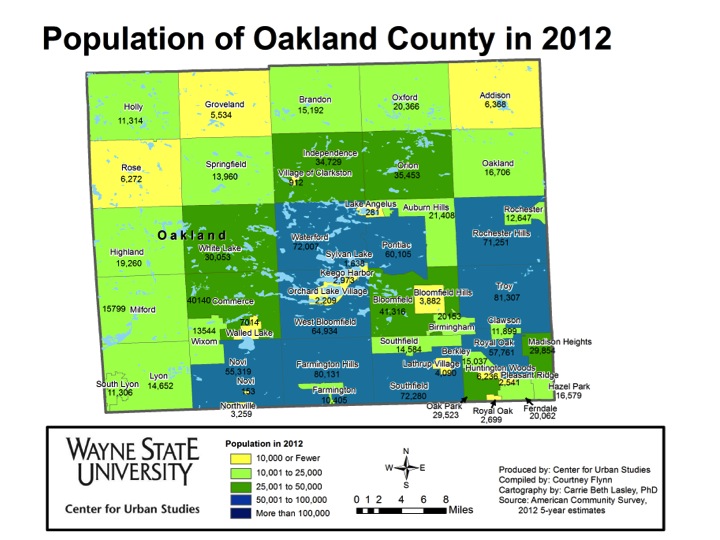
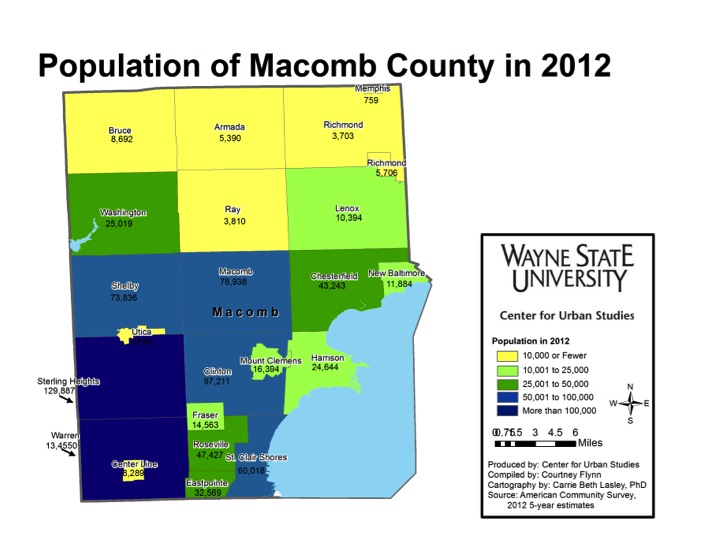
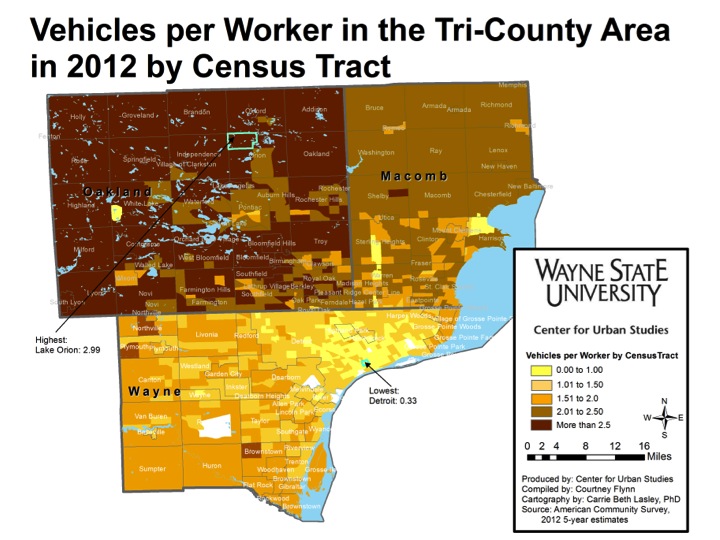
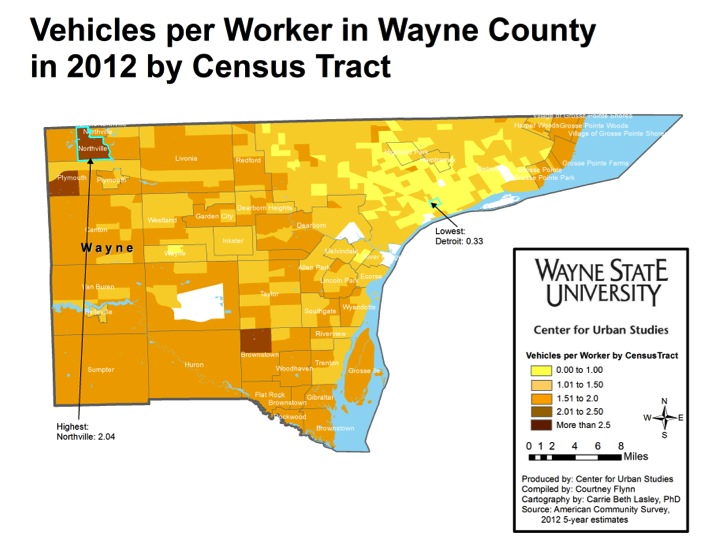
When examining this data at the census level, there are clear differences between the counties in the tri-county area in terms of access to vehicles per worker. Overall, a majority of the census tracts in Oakland County, particularly those in the northern, western and eastern sides of the county, averaged access to more than 2.5 vehicles per worker. While the majority of census tracts in Macomb County had workers with access to over 2 vehicles per worker, only one, located in Shelby Township, had workers with access to 2.5 vehicles or more per worker. In Wayne County, there were no census tracts where workers had to access to, on average, more than 2.5 vehicles. However, one tract in Detroit had an average of 0.33 vehicles per worker. Viewing cars as a critical asset and a de facto necessity for getting work in a region where jobs are sprawled throughout the metropolitan area, these data clearly represent another dimension of the mal-distribution of resources across these seven counties.

Overall region experiences slight population loss from 2012 to 2013

One important aspect of understanding a region is to understand its population distribution and demographics. To keep our readers updated on this we regularly update our maps to reflect the most current population statistics.

In this post, 2012 population statistics from the American Community Survey are presented.

Slide05


Overall, this post will examine the 2012 population numbers for the municipalities located in Southeastern Michigan; this is because 2013 population statistics are not yet available at the local level. However, above we provide a comparison of the counties’ populations from 2012 to 2013. Wayne County experienced the largest decrease from 2012 to 2013, about 47,196 residents left, about 32,000 of those residents left from within the city of Detroit. According to the American Community Survey, every other county lost residents as well, with the exception of Monroe and St. Clair counties. These losses were minute next to the loss experienced in Wayne County. The county that lost the second highest number of residents from 2012 to 2013 was Oakland County; about 4,700 residents left from 2012 to 2013. Monroe County gained 77 residents and St. Clair County gained 62.

Although Detroit’s population has been declining since the early 1960s, it still remains the largest city in both the region, and the state. In 2012, the population was reported to be 721,459, about a 1 percent increase from the population of 713,000 in 2010.


In Wayne County, the City of Detroit was the only municipality in which the population exceeds 100,000. In the seven-county region there were only four municipalities with a population exceeding 100,000– Detroit (721,459), Warren (134,550), Sterling Heights (129,887) and Ann Arbor (114,725). Warren and Sterling Heights are located in Macomb County and Ann Arbor is in Washtenaw County. In Oakland County, where the total population was 1,207,297 in 2012, the municipality with the highest population was the city of Troy (81,307).

The Tri-County Region (Wayne-Oakland-Macomb) contained the largest portion of the population in Southeastern Michigan in 2012, about 84 percent. Livingston, Monroe St. Clair and Washtenaw counties did not have one municipality with a population above 35,000. Washtenaw had just Ann Arbor and Ypsilanti exceeding this figure. In Livingston County, Hamburg Township had the highest population at 21,396. In Monroe County, Bedford Township had the highest population at 31,055. Port Huron had the highest population in St. Clair County at 30,253. As already noted, Ann Arbor had the highest population in Washtenaw County at 114,725.

Since 2010 the overall population in Southeastern Michigan has experienced a population increase, despite decades of population decline, with the city of Detroit falling from the fourth-largest American city in the mid-twentieth century to barely cracking the top 20 today. However, the region is still home to around four million people, and it is second only to Chicago among other Midwestern metropolitan areas.

Highland Park has highest percentage of Supplemental Security Income recipients

Supplemental Security Income (SSI) is administered on a monthly basis by the federal government to the disabled, blind, or those above the age of 65. It is only provided to such recipients in these categories who have a limited income, with the purpose of aiding in the purchasing of food, clothing and shelter (for more info-click here). In 2014, the monthly SSI benefit rate increased to $721 for an individual and $1,082 for a couple; these increases were reflective of an increase in the Consumer Price Index, according to the Social Security Administration.   Thus an individual receiving SSI in 2014, would receive an annual income of $8,652.

This post examines the percentage of residents who received SSI in 2012 throughout the seven-county region of southeast Michigan. At that time, an individual’s monthly benefit was $698 and a couple’s was $1,048. In examining the percent of residents throughout the region who collect SSI, it is also helpful to understand the percentage of residents age 65 or older in each community and county. To view this information, please click here for our previous post.

Slide03Slide04Slide05Slide06

As noted earlier, SSI recipients must be either legally disabled, blind, or above the age of 65, and have limited incomes. The first map shows that Washtenaw County had the lowest percent of residents who received SSI in 2012. There were only four municipalities’ in that county where more than 4.01 percent of the population received SSI checks, and none of those communities had more than 8.01 percent of the population collecting SSI. It is important to note that Washtenaw County also had the lowest population of residents aged 65 or older in 2012. According to American Community Survey data, 10.3 percent of Washtenaw’s County was 65 years of age or older in 2012.

Macomb and St. Clair counties had the highest population of those 65 years of age and above in 2012 at 14.4 percent and 14.6 percent, respectively. However, both of these counties had fewer municipalities with more than 4.01 percent of the population collecting SSI benefits than Wayne County. Macomb had eight municipalities and St. Clair had 10 municipalities with more than 4.01 percent of the population receiving SSI benefits. Wayne County, where seniors comprised 12.7 percent of the population, had 22 communities with more than 4.01 percent of residents receiving SSI in 2012. In St. Clair County, the city of Memphis had the highest percent of residents collecting SSI benefits at 12.8 percent. In Macomb County, Richmond Township had the highest percentage of residents receiving SSI benefits at 5.1 percent.

The second map above breaks down the percentage of residents in each community who collect SSI benefits by census tract. For example, in St. Clair County, both the city of St. Clair and Casco Township are split in half with the percent of residents who collect SSI benefits. For both of these municipalities, one half has 4 percent or less of the population collecting SSI benefits while the other half has between 4.01 and 8 percent of the residents collecting SSI benefits. One reason for this may be that those census tracts with a higher percent of the population collecting SSI benefits house facilities such as nursing homes.

Slide08Slide09

In 2012 in Wayne County, there were five different municipalities where more than 10 percent of the population collected SSI benefits. Highland Park had the largest percentage at 19.2 percent. The City of Detroit was also one of the top five municipalities; 11.9 percent of that population collected SSI benefits in 2012. During that same year, 12.5 percent of Wayne County’s population, 14.3 percent of Highland Park’s population and 11.5 percent of Detroit’s population were 65 years of age or above.

The final map shows the percent of residents receiving SSI in each census tract in Detroit and the surrounding areas. There were five tracts where 32.1 percent or more of residents collected SSI benefits.


Females make up majority of Southeastern Michigan’s population

In this post, we use American Community Survey data from 2012 to examine the male/female, or sex, ratios across Southeastern Michigan. A population’s male/female ratio is reported as the number of males per 100 females. In each of the seven counties in the region, and in a majority of the region’s municipalities, there were more females than males. There were, however, about three dozen rural municipalities where males outnumbered females.

SEMCOGGender (2)

In 2012, Wayne County had the highest percentage of females in the seven county region. The county’s population was comprised of 52 percent females and 48 percent males. This is the same as a male/female ratio of of 92.44, where there were 92.44 males for every 100 females. The city of Detroit, located in Wayne County, had an even lower male/female ratio; there were 89.2 males for every 100 females.

In the region, Livingston County was the closest to having the population equally divided between males and females. The 2012 male/female ratio was 99.83 males per 100 females. For this county that meant the population was almost exactly 50 percent male and 50 percent female.

Gender - SEMCOG City SUBs (only calledout)

There were several municipalities throughout the region with a male/female ratio that was either much higher or lower than that county’s average. For example, the small rural community of York Township in Washtenaw County had the highest male percentage in the region. York’s population was 59.2 percent male and 40.8 percent female. Lyndon Township, also located in Washtenaw County, had the second highest male population at 56.8 percent; 43.2 percent of the population was female. A majority of the municipalities with more males than females are located in the rural areas. One might speculate that these communities have many farmers who may be either widowers or single males.

Royal Oak Charter Township in Oakland County was the municipality with the lowest percentage of males in the region. The township’s population was 59.9 percent female and 40.1 percent male. Overall, Oakland County was 51.5 percent female and 48.5 percent male.

Genderdetroitcensus (only3callouts)

In the city of Detroit in 2012, there were 89.2 males for every 100 females. In the same year, there were also census tracts with disproportionate ratios of either males or females. For example, census tract 9851, which borders the city of Hamtramck, had 233.3 males per 100 females. This meant that 70 percent of the population was male and 30 percent was female. In tract 5064, north of Hamtramck, the ratio was even higher; there were 363.8 males for every 100 females. This meant that 78.4 percent of the population was male and 21.6 was female. The lowest ratio was in census tract 5337, where there 44.5 males per every 100 females; this also meant 69.2 percent of the population was female.