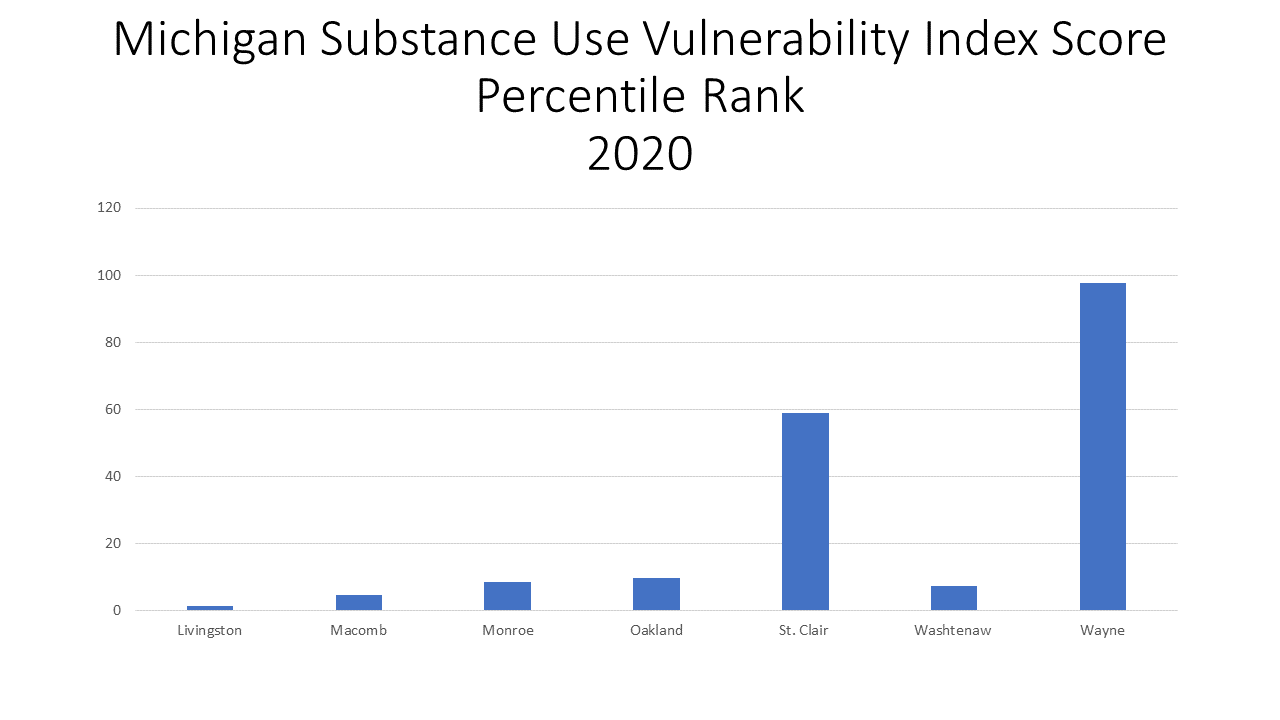
In Southeast Michigan, St. Clair and Wayne counties are the most vulnerable when it comes to substance use, according to the Michigan Substance Use Vulnerability Index (MI-SUVI). This index provides a score, balancing the eight factors listed below:
- Overdose death rate
- Nonfatal overdose emergency department visit rate
- Opioid prescribing rate
- Drug-related arrest rate
- Percent of the population within a 30-minute drive to a treatment center
- Percent of the population within a 15-drive drive to a syringe service program
- Buprenorphine prescribing rate
- And the Social Vulnerability Index (This is the Centers for Disease Control’s own measure that looks at social detriments to health, like technology access and healthcare access. We explored this in a previous post.)
The scores above are separated into three categories (Burden Rank, Resource Rank and Social Vulnerability Rank), each receiving a score in and of itself. Once the factors and rankings are determined, a final score is then provided to determine the vulnerability of an area to substance use. The factors listed below all use data from 2020, 2021 or an average of 2016-2020.
The information described above is part of the State of Michigan’s new Overdose data to Action Dashboard, which digs deep into the data above, serving as resource to stakeholders across the state who are working to address substance use disorders.
In this post we not only show the percentile rank of MI-SUVI scores for each of the seven counties in the region, highlighting which ones have higher or low index scores, but also dig deeper into the factors behind each score.
As noted, Wayne and St. Clair counties had the highest MI-SUVI index percentile ranks in the region at 97.6 percent and 59 percent, respectively. Wayne County not only had the highest index in the region, but the second-highest in the state (Oscoda County had the highest index in the state at 98.8 percent). In other words, Oscoda County was the most vulnerable county when it came to substance use and Wayne County was the second most vulnerable county.
What contributed to such a high score? Well, as shown through several data points below, Wayne County had the highest fatal and nonfatal overdose rates in the region in 2020 and is in the middle-third of opioid prescriptions issued in a county statewide. Wayne County does provide a greater amount of access to resources that some counties throughout the state and region, but even so, its burden rank weighs heavily on the county’s scoring.
Livingston County had the lowest Michigan Substance Use Vulnerability Index percentile rank at 1.2 percent. Overall, Livingston County ranked 83rd on the MI-SUVI index—there are 83 counties in Michigan. This ranking is because of its low burden and social vulnerability index rankings and its average resource ranking.
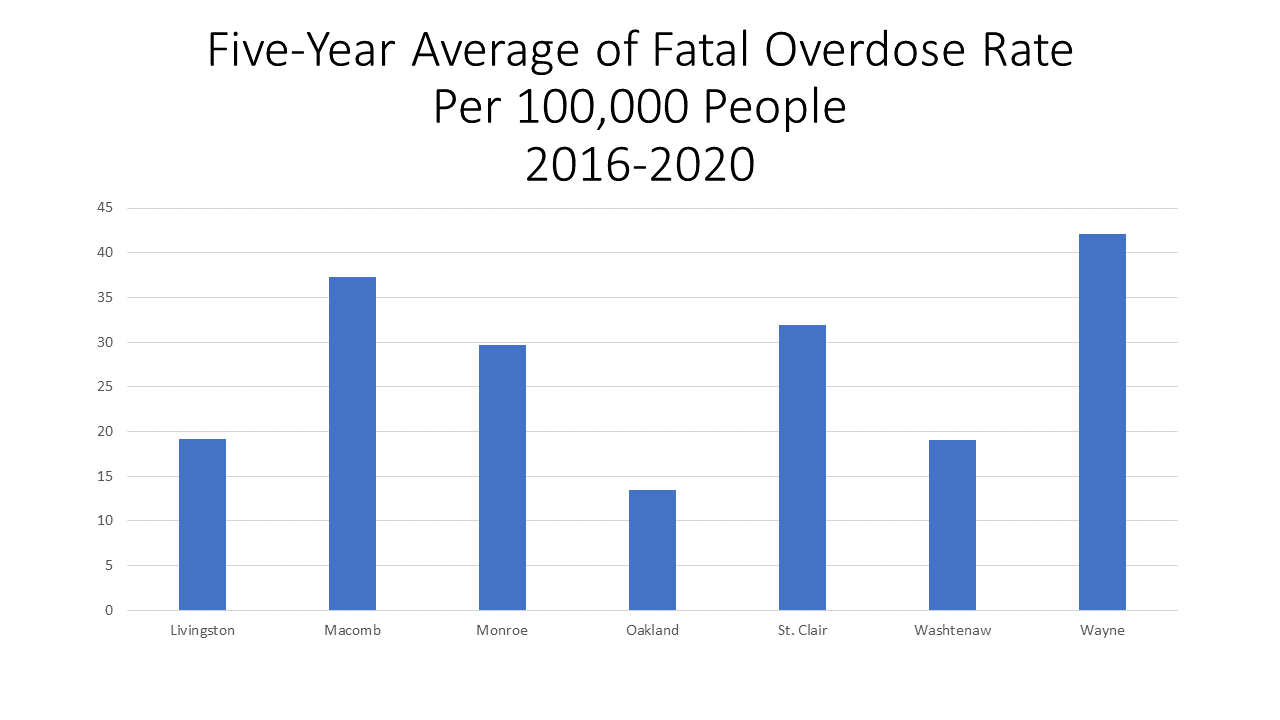
Between 2016 and 2020 the five-year average for the number of all fatal overdoses in Wayne County was 42.1 per 100,000 people, according to the Michigan Opioid Data to Action Dashboard. Wayne County had the second highest fatal overdose rate in the state; Genesee County had the highest rate at 42.9. Regionally, Macomb County had the second highest fatal overdose rate at 37.3 per 100,000.
Oakland County had the lowest five-year average fatal overdose rate per 100,000 people at 13.4.
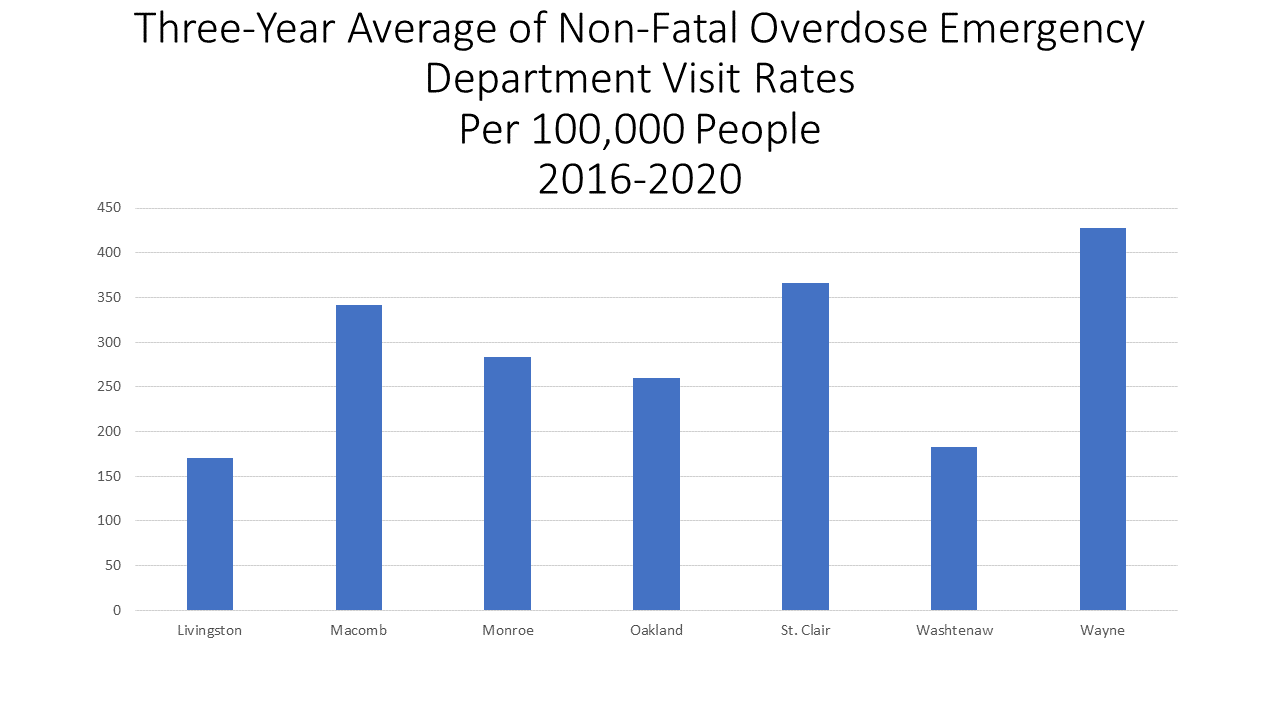
Regionally, Wayne County also had the highest non-fatal overdose emergency room visit rate per 100,000 people at 427.8. This rate ranked fourth in the state. The drug overdoses counted for this emergency room visit category represents all drug overdoses—not just opioid overdoses. St. Clair County had the second highest non-fatal overdose emergency room visit rate per 100,000 people at 365.8. Livingston County had the lowest rate at 170.3.
The rates for this data set are based on a three-year average between 2016-2020.
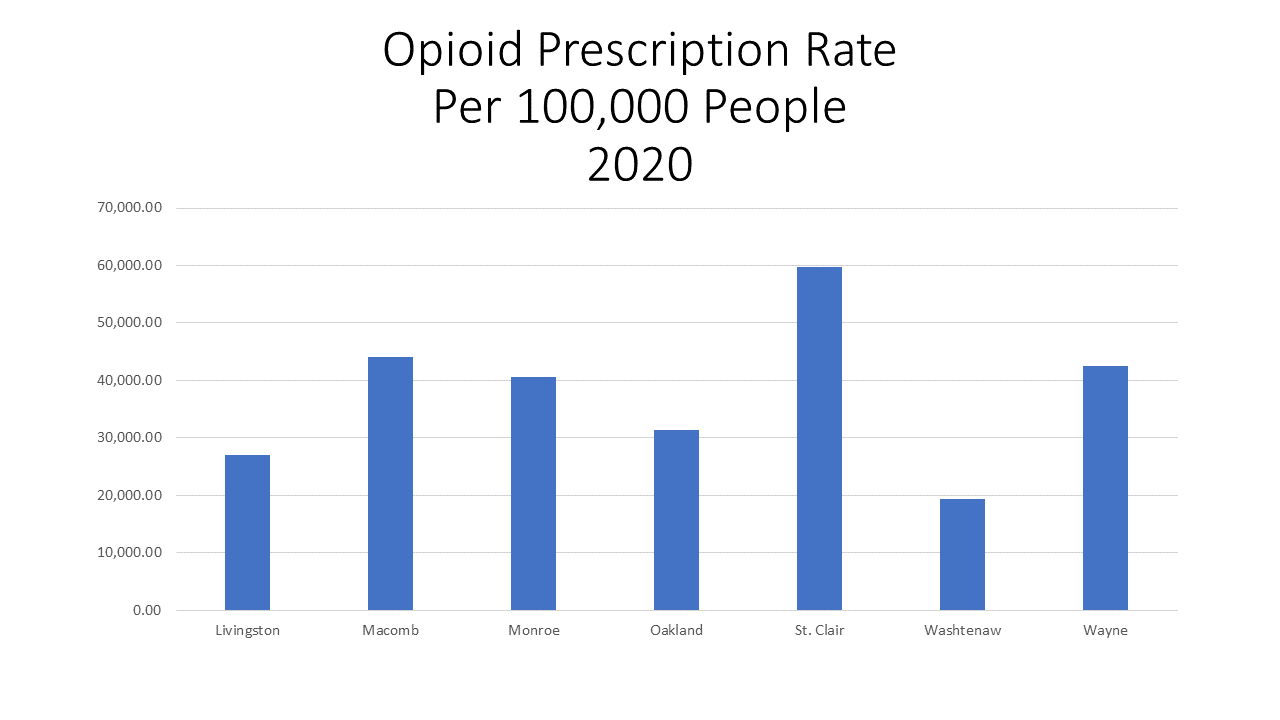
For the opioid prescription rate per 100,000 people, it was not Wayne County that had the highest rate regionally, but rather St. Clair County. In 2020, according to data from the Michigan Overdose Data to Action Dashboard, St. Clair County had an opioid prescription rate of 59,685.5. St. Clair County had the 15th highest opioid prescription rate in the state. Wayne County had an opioid prescription rate of 42,580.2 per 100,000 people, which was the 52nd highest rate in the state.
Regionally and statewide, Washtenaw County had the lowest opioid prescribing rate of 19,420.8.
The opioid prescription rate is based on the number of prescription opioid units dispensed to treat pain.
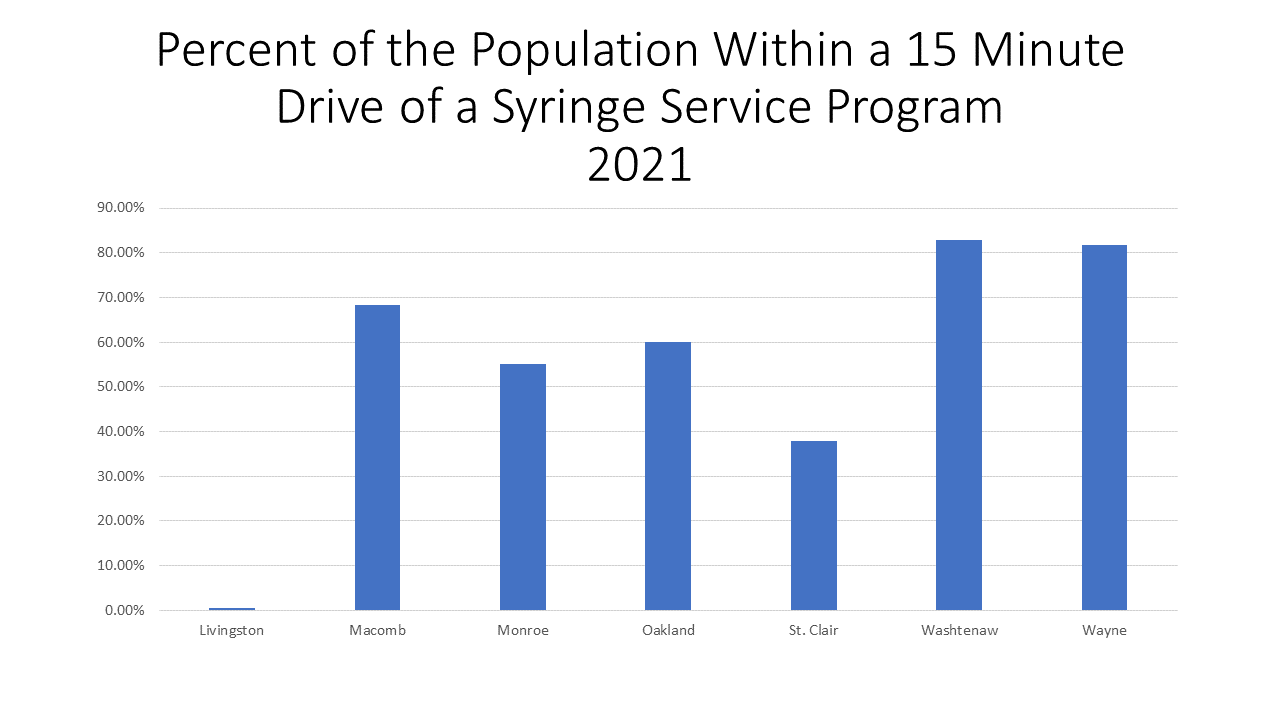
The percent of the population within a 15-minute drive of a Syringe Service Program measure is one of the factors in the MI-SUVI rate because it is a harm reduction indicator. This indicator represents the number of Syringe Service Programs funded by the Michigan Department of Health and Human Services. These programs are considered a form of harm reduction because they offer sterile injection equipment and provide a linkage to substance use disorder treatment.
Washtenaw County had the highest percentage of the population that lived within a 15-minute drive of a Syringe Service Program in Michigan at 82.9 percent. Wayne County had the second highest percentage of the population within a 15-minute drive of a Syringe Service Program at 81.7 percent.
Livingston County had the lowest percentage regionally with 0.5 percent of the population being with a 15-minute drive to a Syringe Service Program. While this percentage was much lower than the other counties’, Livingston County had the 53rd highest percentage of the population within a 15-minute drive to a program.
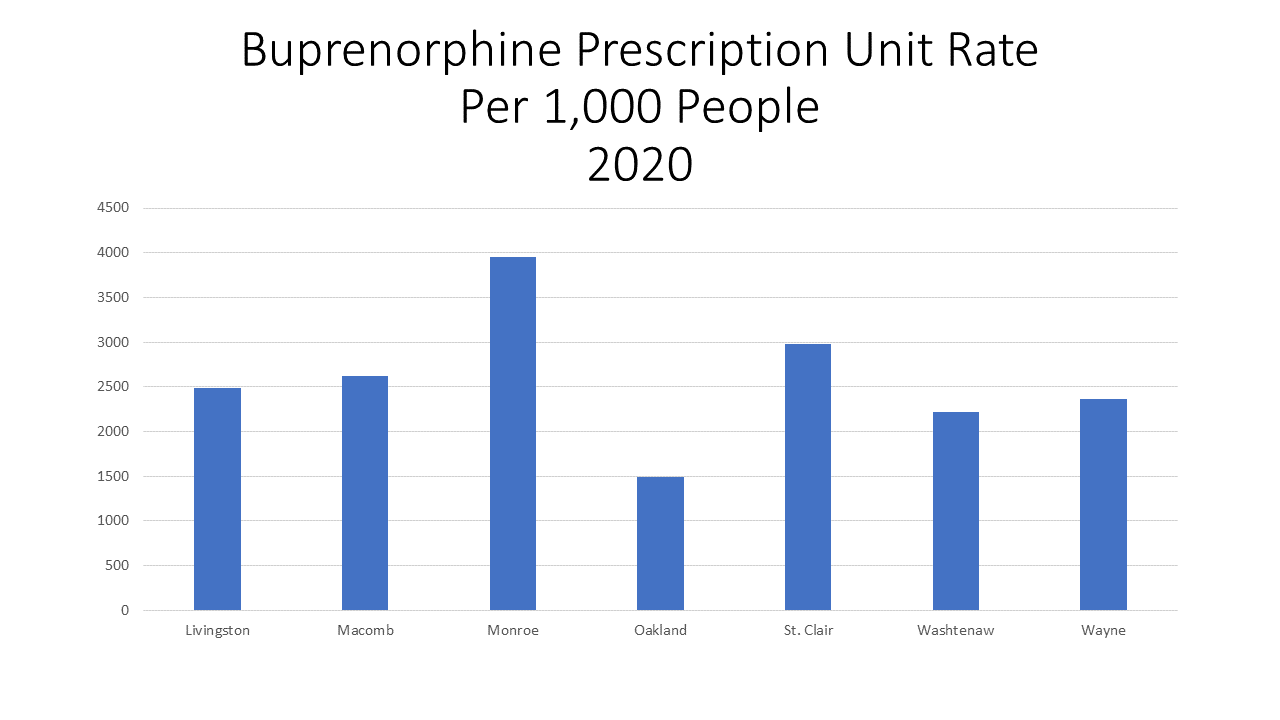
Buprenorphine is a medication, approved by the Food and Drug Administration, to treat opioid use disorder. Access to this prescription is also viewed as a harm reduction indicator, which is why it is one of the factors in determining the MI-SUVI rate of a county.
In Southeast Michigan, Monroe County had the highest Buprenorphine prescription unit rate per 1,000 people in 2020 at 3,950.5, followed by St. Clair County with a rate of 2,978.5. Higher rates of Buprenorphine are viewed as favorable in the calculating the MI-SUVI rate because the drug aims to treat addiction. Oakland County had the lowest Buprenorphine prescription rate at 1,485.6 per 1,000 people.
As with the opioid prescription rate, the Buprenorphine rate is based on the prescription units.
The data discussed above provides a fair amount of insight into the ever-growing concerns and consequences of opioid addiction across Southeast Michigan and the state. And while we have a better understanding of what counties are more vulnerable to the impacts of this disease than others, there is still much more to be known. Over the next several weeks we will further examine the hard reduction programs in place—what services they offer, what their impacts are and how they are growing in numbers. We will also dig deeper into who is most impacted by opioid addiction and what factors impact that. And finally, we will discuss the National Opioid Lawsuit and its impact on Michigan and its communities.
Just as with addiction itself, understanding the intricacies of the data presented by the State is vital in establishing a comprehensive and effective plan to reduce the harm, and existence itself, of opioid addiction.