Great Lakes Continue to Rise

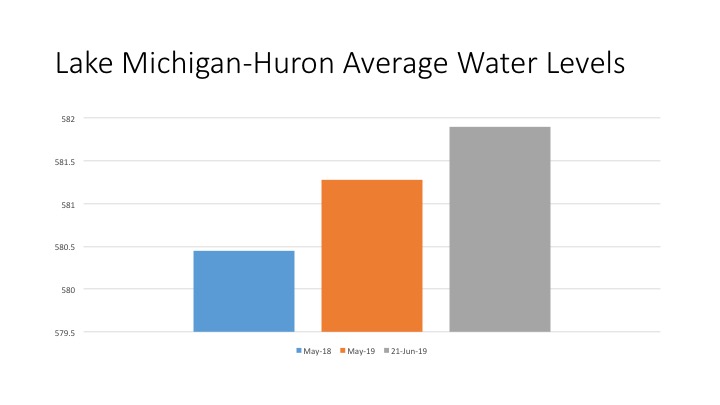
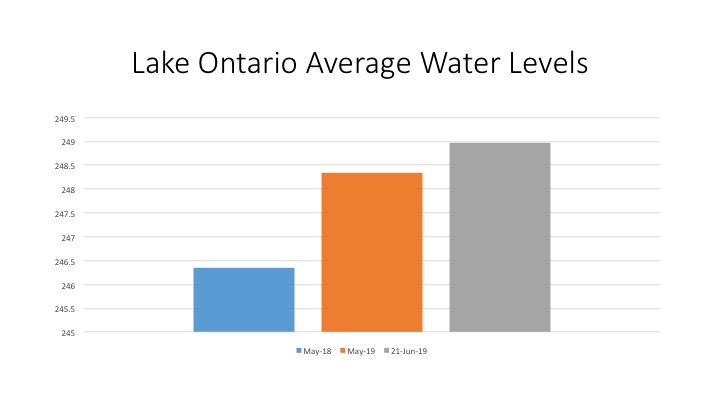
Water levels in the Great Lakes continue to rise as the rain continues to fall. According to U.S. Army Corps of Engineers, each of the Great Lakes had higher average water levels in the month of May in 2019 than the prior years. Each lake had water levels that were almost a foot higher than the previous year. Additionally, as of June 21, 2019 water levels throughout the Great Lakes continued to reach above average levels, increasing well beyond the May 2018 and May 2019 averages. Between May 2019 and June 21, 2019 water levels in Lake Superior have increased an additional 3 inches, which is the lowest increase of the five water basins the U.S. Army Corps of Engineers tracks as part of the Great Lakes. Lake Ontario experienced the highest increase between the May 2019 average and the recorded water levels on June 21, 2019; the increase in that time frame was 8 inches. Lake Michigan-Huron has had the second highest increase in the last few weeks at 7 inches.

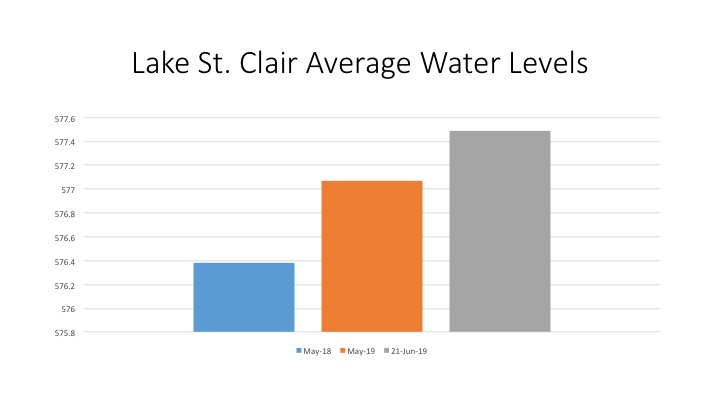
The charts below further show that as of May, Lake Ontario experienced the highest average increase between May of 2018 and 2019 at about a foot and a half. Lake St. Clair’s average increased the least, but was still up 8.4 inches from the 2018 May average.

Such water levels are a result of above average rainfalls for 2019 and below average evaporation rates. For some perspective, as of June 1, 2019 there had been 1.57 inches of rain during the month, compared to 0.57 inches by the same time in 2018. Additionally, the average temperature for the month of June this year is about 68 degrees when last year the average temperature for June was about 72 degrees.

Weather models predict that cooler temperatures and increased amounts of precipitation will become more of the norm for Michigan, as a result of climate change. Such a long-term shift in the state’s climate not only affects water levels in the Great Lakes, but also farming throughout Michigan. This is a topic we will further explore in an upcoming post.

Birth Rates Continue to Decline in Michigan

In 2017 Kent County had the highest birth rate per 10,000 people in the state of Michigan at 136.5. This means there were 8,684 live births in Kent County in 2017 with a population of 636,376. Wayne County had the second highest birth rate in the state at 131.9 live births per 10,000 people; this equates to 23,257 live births for a population of about 1.7 million. Of the 83 counties in Michigan 38 of them had live birth rates above 100 per 10,000 people in 2017. Additionally, in terms of the total number of live births Wayne County had the highest total with Oakland County having the second highest total at 13,184.

As the second map below shows, most of the state had between 13 and 4,660 live births in 2017. There were 12 counties where the total number of live births was below 100, with Keweenaw County having the lowest number of live births in 2017 at 13.  Keweenaw County is in the Upper Peninsula, and like Keweenaw County several of the other counties in the UP had less than 100 live births in 2017. On the opposite end of the range, there were only five counties in the state that had more than 4,660 live births, those counties being Wayne, Oakland, Macomb, Genesee and Kent counties.

onitoring the number of births and birth rates in an area is important because it directly impacts policy and budgeting as it relates to education and health care. In the U.S., and in Michigan, the number of births are dropping. For example, in 2017 in Michigan there was a total of 111,507, which was about 2 percent lower than what it was the previous year. As Michigan’s population ages but birth rates decline some are concerned that long-term this will affect the state’s economy and the talent pool.

Hamtramck Schools Have Highest Percentage of Students Eligible for Free and Reduced Lunch

A few weeks ago Drawing Detroit explored how many students are eligible for Free and Reduced Lunch services by county. With the percentage of students being eligible for Free and Reduced Lunch services being a proxy measure of poverty, we wanted to dig deeper into the data to see what areas of each county had the highest and lowest percentage of services eligible for the service. 

Those who are eligible for free or reduced lunch prices are children in households that receive benefits from the Food Assistance Program or Family Independence Program. For example, in 2018, a family of four that has an annual income of about $33,000 or less was eligible for free or reduced lunch prices.

Hamtramck Public Schools may not be the most populated school district in Southeastern Michigan, but it has the highest percentage of students eligible for Free and Reduced Lunch services. According to the Michigan Department of Education, out of the 3,300 students enrolled in Hamtramck Public Schools, 3,115 are eligible for Free and Reduced Lunch services. This translates to 94 percent of the school population being eligible for Free and Reduced Lunch services. In total, there are only seven school districts in the region where 80 percent or more of the students in the district are eligible for Free and Reduced Lunch services. Of those seven districts, four are in Wayne County (Hamtramck Public Schools, Detroit Public Schools, Highland Park Public Schools and Inkster Public Schools), two are in Macomb County (Mount Clemens Public School District and Van Dyke Public Schools) and one is in Oakland County (Oak Park Public Schools).

On the opposite end of the spectrum there are 14 school districts in the region where 20 percent or less of the student population is eligible for Free and Reduced Lunch services. Northville Public Schools has the lowest percentage of students eligible at 6.5 percent. In total, of the 7,355 students enrolled in the school district, 483 are eligible for Free and Reduced Lunch benefits. Macomb and St. Clair counties are the only two in the region with no school districts with less than 20 percent of students eligible for Free and Reduced Lunch services. In St. Clair County, all the school districts have between 20 and 60 percent of students eligible and in Macomb County, majority of the school districts are in that same range. The exception in Macomb County is the Mount Clemens School District and the inner-ring Detroit school districts, such as Van Dyke Public Schools, Warren Consolidated Schools and others that are near the City of Detroit. In the more rural school districts to the west (in Washtenaw and Livingston counties) nearly all the school districts have less than 40 percent of students eligible for Free and Reduced Lunch services.

With majority of the school districts in the region having at least 20 percent or more of students eligible for Free and Reduced Lunch services, this highlights a need for more investment in our children, ensuring they have the resources mentally and physically grow. As noted earlier, this data also relates to the poverty levels in the region and further highlights how it affects our youth. 

Water Rates Vary Due to Location, Use

Water rates throughout Southeastern Michigan vary greatly, despite the fact that most communities in the region receive their water through the Great Lakes Water Authority (GLWA). The GLWA was approved by Wayne, Oakland and Macomb counties’ Board of Commissioners in October of 2014 and on January 1, 2016 the regional authority became fully operational, ultimately as a result of Detroit’s bankruptcy. The county boards’ approval allowed the authority to form and for the GLWA to lease water and sewer infrastructure from the City of Detroit for 40 years at a cost of $50 million a year. The approval of the GLWA also meant that all Detroit Water and Sewer wholesale customers, with the exception of the City of Detroit (127 in all, 75% of which are in the tri-county area) are now customers of the Great Lakes Water Authority.

The Detroit/GLWA system consists of:

  • 640 miles of large water and sewer pipes
  • Five water treatment facilities
  • One major sewage treatment plant

The map below shows the commodity charge rates for Fiscal Year 2020, as approved by the GLWA. In total, the GLWA represents 127 different communities, not all are shown in the map below though because some receive their services through the smaller water authorities, such as the South Oakland County Water Authority (which is a member of the GLWA and then services communities in that area).   As the map shows, Bruce Township has the highest rate at $75.53 per million cubic feet (MCF). However, majority of the communities in the region that participate in the GLWA have commodity charge rates that range between $4.28 per mcf and $18.53 per mcf. The City of Ecorse has the lowest rate at $4.28 per mcf.

According to the GLWA, the charges vary across communities for a number of reasons. Of course, communities are in charge of their end rates but the GLWA starts with setting their commodity prices by creating a water budget, which is capped at a 4 percent increase each year. This budget is reflective of operating expenses, the cost of infrastructure and other costs. The GLWA then looks at the usage patterns of each community and where it is located in terms of its elevation and distance from a water plant. Location matters because the more electricity that is used to pump water to a community the more a city’s commodity charge will be. So, for example, Bruce Township is in the northern part of Macomb County so transportation is farther. Additionally, it does not have a storage facility (such as a water tower) that would allow it to store water at cheaper rates and distribute to customers. In addition to storage options, cities can also manage their water rates as charged by the GLWA by not exceeding max volume usage during peak hours and conserving.