Hospital Bed Access Highest in Ann Arbor

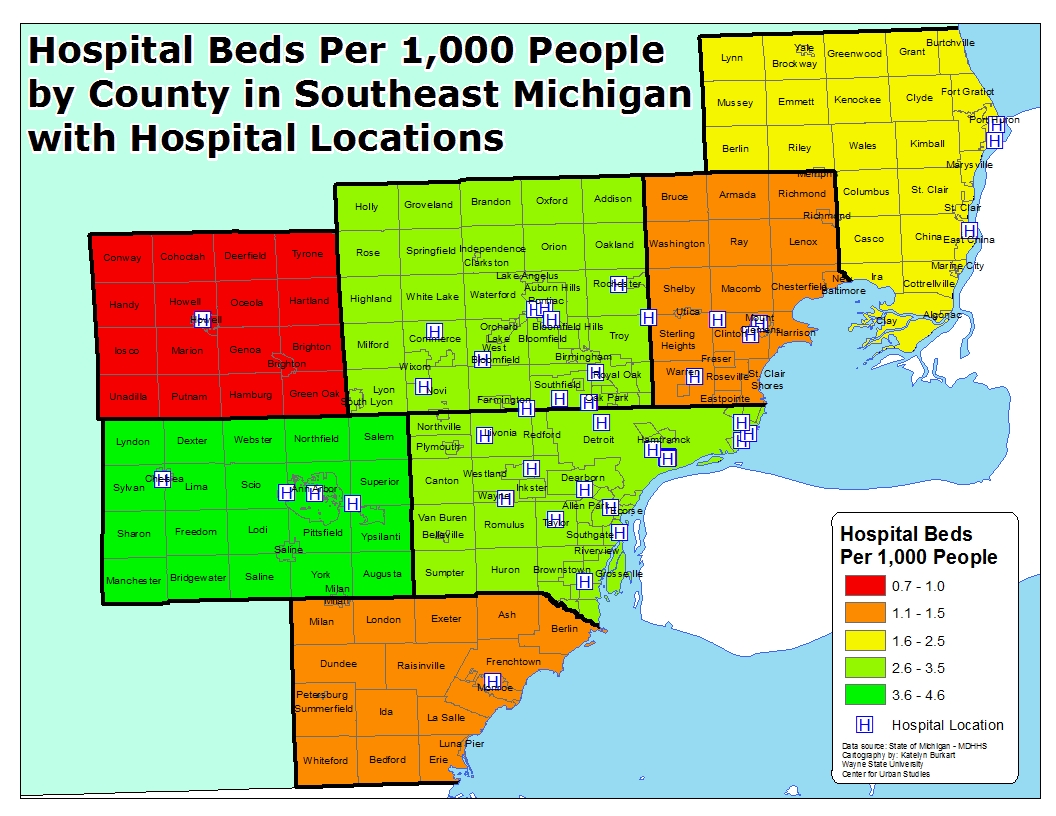
Access to healthcare is necessary for disease prevention, a longer life expectancy and an overall increased quality of life. Both regionally, and nationally, those living in rural areas have far less accessibility to hospitals. Under the Medicare Rural Hospital Flexibility Program created by Congress in 1997 Critical Access Hospitals were created to strengthen health care access in rural areas. There are 36 Critical Access Hospitals in the state of Michigan, none of which are located in Southeastern Michigan. Critical Access Hospitals must be located in a rural area and be more than 35 miles from another hospital. Hospital bed access throughout Southeastern Michigan is concentrated in more heavily populated areas, leaving dozens of rural communities with limited access. The city of Ann Arbor has the highest overall hospital bed per capita (per 1,000 people) access, largely due to the University of Michigan Health System being located there.

All data for this post was provided by the Michigan Department of Health and Human Services. According to the department, the number of registered hospital beds can remain registered to a hospital even if it is closed. This is particularly true if the beds from the closed hospital are being transferred to a new hospital. This is the case for DMC Surgery Hospital in Oakland County; this hospital is closed but 25 of its beds are being transferred to the Children’s Hospital of Michigan (also located in Oakland County). The remaining 11 beds will be delicensed.

hospbeds (1)

In total, the University of Michigan Health System had 1,000 licensed beds in 2016, according to the Michigan Department of Health and Human Services. Regionally, this hospital has the second highest hospital bed count next to Beaumont Health Systems’ Royal Oak location, which has 1,040 licensed beds. Aside from the University of Michigan Health System located in Ann Arbor, there is also St. Joseph Mercy in Ann Arbor with 513 registered beds. Outside of Ann Arbor in Washtenaw County there were two other hospital facilities.


Despite Washtenaw County having the highest hospital bed access per capita in the region, Wayne County had the highest number of hospitals, 12 of which were located in the city of Detroit. In Wayne County, Henry Ford Hospital in Detroit had the most number of licensed beds at 877.

While hospital bed access is prevalent in the more densely populated areas, such as Ann Arbor, Detroit, and the tri-county metro region, it lacks in the rural areas. For example, in Monroe County there is only one hospital-Promedica Monroe Regional Hospital-with 217 registered beds. Per capita hospital bed access in Monroe County is 1.5 per 1,000 people, which is actually higher than Macomb County’s Per capita hospital bed rate (1.4 per 1,000 people). This difference though is not because of the total number of licensed beds in each county (there are 1236 in Macomb County) but the differing population numbers.

In Livingston County there was only one hospital-St. Joseph Mercy Livingston Hospital-with 136 licensed beds. This put the hospital bed access rate per 1,000 people for the county at .7, the lowest in the region, furthering highlighting the lack of hospital bed access in rural areas. Much of northern Macomb County and St. Clair County also had such lack of access.

Percentage of Renters in Spike Across Southeastern Michigan

Southeastern Michigan followed a trend similar to that of the entire state between 2000 and 2014 in that majority of the region experienced up to a 50 percent increase in the percentage of renters between 2000 and 2014. Statewide there were 998 communities (about 65 percent of the state) that experienced an increase in the total percentage of renters, and regionally there were 154 communities (about 70 percent of the region). Both regionally, and in the state, the city of Grosse Pointe had the highest change in percentage of renters between 2000 and 2014 at 967 percent. According the U.S. Census Bureau the city’s percentage of renters increased from 2 percent in 2000 to 19 percent in 2014.

The data for this post is from the American Community Survey (ACS) and the Census. The 2014 data is ACS and provides the total estimate of houses in the county subdivision, how many were owner-occupied and how many were renter-occupied. The margin of error ranges from 1,919 to 5 units. The 2000 data is from the Census and provides a sample of each county subdivision, along with the number of owners and renters in the sample. No margins of error were provided. For both 2000 and 2014, the percentage of renters was calculated and then used to determine the change between 2000 and 2014.

pct_chng_renters (1)

pct_chng_renters-Semcog (1)

The three communities in the state, and regionally, with the highest percentage increase in renters between 2000 and 2014 were located in Southeastern Michigan. With the city of Grosse Pointe at the top, the city of Memphis in Macomb County came in second and Pittsfield Township in Washtenaw County came in third. Between 2000 and 2014 Memphis experienced a 746 percent increase in renters and Pittsfield Township experienced a 643 percent increase.

In Wayne County there were four communities where there was more than a 100 percent increase in the amount of renters between 2000 and 2014. Those communities were Grosse Pointe, Gibraltar (232%), Dearborn (118%) and Redford (115%). The city of Detroit experienced a 29 percent increase in the percent of renters in that time frame. According the Census data, the percentage of renters in Detroit in 2000 was 38 percent and in 2014 that number increased to 49 percent.

While majority of the region experienced an increase in the percentage of renters between 2000 and 2014 there were several that experienced a decrease. As shown on the map, in Southeastern Michigan many of those communities were the rural ones located in Washtenaw County. There were 15 communities in Washtenaw County that experienced a decrease in the percentage of renters; those decreases ranged from 1 percent to 87 percent. York Township experienced the 87 percent decrease, going from a 67 percent rental rate to a 9 percent rental rate in 2014.

Both regionally and across the state, Detroit had amongst the highest percentage of renters in 2014 at 49 percent. The city of Ypsilanti and Royal Oak Township both had the highest percentage of renters in the state of 68 percent. Royal Oak Township experienced a decrease in the percentage of renters between 2000 and 2014, going from 83 percent to 68 percent. The city of Ypsilanti though experienced an increase from 40 percent to 68 percent.

The fact that the percentage of renters across Southeastern Michigan and the state as a whole has increased further solidifies our previous assessment that the cost of rental units is increasing due to the demand in the number of people seeking such units. Much of this increase in demand is driven by households forced into the rental market by foreclosure. As such, former homeowners are often simply renting units that were occupied by homeowner just months before. Should the demand for rental units continue to increase as these former homeowner units (often single family dwellings) are absorbed, new construction of apartments could increase density, allowing for more units to be built. However, this option may require changes in zoning regulations and support from the local communities.

CENSUS: Median Housing Values Decline in Southeastern Michigan

According to American Community Survey (ACS) data, median housing values throughout Southeastern Michigan declined between 2010 and 2014. These results are based on residents’ estimates of the value of their homes. They also contrast with more recent reports based on the Case-Schiller Index of actual sales.

The city of Algonac in St. Clair County had the largest median housing value decrease during that time period at 48 percent; the reported 2014 value was $102,500 and the reported 2010 value was $195,800. Hamtramck and Redford Township came in second for the median value decreases throughout the region at 44 percent. For Hamtramck, the ACS reported the median housing value was $39,800 in 2014 and in 2010 the median value was reported at $73,700. In Redford Township the median housing value was reported at $63,900 in 2014 and $118,500 in 2010. Both of these communities are located in Wayne County, which had the largest overall median housing value decline of the seven counties in the region at 28 percent. On the other hand, Washtenaw County had the lowest percent decline in median housing value between 2010 and 2014 at 10 percent. In Washtenaw County there were nine communities with a median housing value decrease of 5 percent or less. In addition, the city of Dexter experienced a 3 percent median housing value increase, from $216,600 to $222,6000. In Oakland County, cities that experienced a housing value increase between 2010 and 2014 were Birmingham (1%) and Rochester (1%). Lake Angelus in Oakland County did not experience an increase or decrease; median housing values for this community remained at above $1 million for both years.


Of all the communities in Southeastern Michigan, Lake Angelus also had the highest reported median housing value in 2014 at above $1 million (the Census does not specify above $1 million). River Rouge on the other hand had the lowest reported median housing value $36, 800.

medhousval

In recent Drawing Detroit posts, and throughout the media, increases in median housing values have been reported in 2015 and 2016. The data displayed in this post shows a contrary picture for 2010 through 2014. This, in part, may be based on perception as the housing values used in the ACS are based on respondents’ estimates of how much their property would sell for at that time. As we continue to explore housing questions in upcoming posts another question to now be addressed will be why there are different reports on the state of housing values and why, and if, there is in fact a perception that homes are worth less than in 2010 when the rebound from the economic crisis was moving at a much slower pace.

Southeastern Michigan Counties Hold Power in Regional Authorities

In Southeastern Michigan there are eight main regional governing bodies, most of which rely heavily on the counties to fill out the structures. These governing bodies are: the Huron Metro-Parks, the Detroit Institute of Arts Authority (one in each Macomb, Oakland, Wayne), the Detroit Zoo Authority (one in each Macomb, Oakland, Wayne), the Suburban Mobility Authority for Regional Transit, the Great Lakes Water Authority, the Regional Transit Authority and the Detroit Regional Convention Center Authority and the Southeast Michigan Council of Governments (SEMCOG).

Each of these regional governing bodies are made up of individuals who have been either appointed by a County Board of Commissioners, a County Executive, or a combination of both. County Executives have the most appointment authority. With the exception of SEMCOG and the Huron-Clinton Metroparks County Executives have some type of appointment authority with each regional body. This power, for both the counties and the County Executives, is one of the structural patterns that exists in this region’s fragmented group of regional authorities. The City of Detroit Mayor and the Governor have roles in the various authorities, but to a much lesser extent.

Another pattern that exists is that none of these regional bodies allow for their seats to be filled by elections, causing a lack of accountability and an increased ability for personal interests to be pursued. Instead of electing individuals to govern these public bodies, dozens of public officials are hand picking individual candidates to fill the seats. This process, for each regional authority, allows for stakeholders to pursue these new roles to exercise their influence over the governing body. This new layer of politics is also coupled with the fact that the elected officials, particularly county officials, can further their personal agendas with the appointing powers they have been given in this rise of fragmented regionalism.

Slide17

With eight various regional authorities now overseeing the governance of everything from our cultural institutions to water, the way in which these bodies are structured in terms of members vary greatly. For example, when looking at the Detroit Institute of Arts authorities for the counties (Macomb, Oakland and Wayne) none of the three have the same number of individuals on their board (click here for the history of the art authorities). Despite that each board has been set up for the same purpose-to oversee the DIA millage founds levied in their county-how they are structured vastly varies. In Wayne County, the Board of Commissioners have the authority to appoint six of the nine members; the Board then confirms the Wayne County Executives three appointments. In Oakland County the Board Chair appoints three members to the Art Authority and the County Executive appoints two. In Macomb County there is a seven member board, the County Board Chair appoints two members, the County Executive appoints two members and three members are appointed by the County Executive, with approval from the Board of Commissioners.

The Detroit Zoo is the only other regional entity with three different boards (one per county in which the operational millage is levied) that serve as its overall governing authority. The number of members who serve on each County board for zoo does not vary, but a look at the total number of representatives on each board, whether it be a Zoo Authority or SEMCOG greatly varies between 5 members to 47 members (SEMCOG is the only one with 46 members). The total number of representatives on each regional authority is shown in the chart above.

The legislations that created other regional authorities states each authority will only have a single governing body. However, even with those bodies we see the number of representatives vary, as do appointing authorities, which are often times defined in the body’s articles of incorporation.

These varying structures and appointment authorities again show the fragmented nature of our regional authorities. Until the financial downfall of Detroit began regionalism never strongly existed in Metro-Detroit. However, that has since changed as these bodies emerged out of economic and functional necessities.

Due to the manner in which these regional governing bodies emerged ( for more historical context click here) there is no cross functional consolidation of the kind envisioned by proponents of metropolitan governance. This functional differentiation is consistent with the polycentric nature of metropolitan Detroit, the decades-long animosity between Detroit and its neighbors, and persisting racial tensions.


For additional historical context on the topic of regionalism in Southeastern Michigan, below is a table highlighting which state legislations gave way to each regional authority.

Slide19

Oakland County has Largest Decrease in Foreclosure Filings

Between 2010 and 2014 foreclosure filings throughout Southeastern Michigan dropped between 77 to 87 percent, depending on the county. Oakland County experienced the largest decrease in foreclosure filings in the region at 87 percent and St. Clair County experienced the smallest decrease in the region at 77 percent.

The data used for this post was provided by RealtyTrac.com, a company which tracks and provides comprehensive housing data by gathering such information from parcel level records. The foreclosure data examined here is based off of the total number of properties that received at least one foreclosure filing during that year. Foreclosure filings can include a Notice of Default, a pending lawsuit filing, a Notice of Trustee Sale, a Notice for Foreclosure Sale and/or a Real Estate Owned foreclosure filing.

Wayne County had the highest number of filings in Southeastern Michigan, both in 2014 and 2010. In 2014 there were 6,259 filings and in 2010 there were 36,704. The number of foreclosure filings in 2014 in Wayne County accounted for .76 percent of the county’s housing units and in 2010 the number of foreclosure filings accounted for 4.38 percent of the County’s housing units. Overall there was an 83 percent decrease in the number of foreclosure filings between 2010 and 2014 in Wayne County.

On the opposite end of the spectrum Livingston County had the lowest amount of foreclosure filings in 2014 at 347. In 2010 though Monroe County had the lowest number of foreclosure filings, according to Realtytrac.com at 2,361.

Michigan Foreclosure Filings

Michigan Foreclosure Filings 2010-2014

Although Wayne County consistently had the highest number of foreclosure filings in the region between 2010 and 2014 it did not always have the highest percentage of housing units for which foreclosures were filed. For example, in 2010 4.55 percent of Macomb County’s housing units had at least one foreclosure filing; that percentage was 4.38 for Wayne County. Of the five years examined here, 2012 was the only year when Wayne County had the highest percentage of its housing units with at least one foreclosure filing; that number was 2.57 percent.

Unlike Wayne and Macomb counties, Washtenaw County regularly had the lowest percentage of housing units between 2010 and 2014 with at least one foreclosure filing. In 2010 the percentage of housing units with at least one foreclosure filing was 2.38 and by 2014 that number in Washtenaw County decreased to 0.47.

Foreclosure Filings Housing

In 2010 Oakland County had 20,445 foreclosure filings and in 2014 that number dropped to 2,682, meaning there was 87 percent decrease in the number of foreclosure filings there. This percentage decrease in the number of filings was the greatest in the region. The 20,445 foreclosure filings in 2010 for Oakland County were equivalent to 3.89 percent of Oakland County’s housing units and the number of foreclosure filings in 2014 for Oakland County was equivalent to .51 percent of the housing units. According to the Oakland County Treasurer’s Office, in 2014 834 properties were offered up for for tax auction by the county and in 2010 that number was 909 (2012 was the highest recent number for Oakland County at 1,651).

St. Clair County had the smallest percentage decrease in the number of foreclosure filings between 2010 and 2014. In 2010 Realtytrac.com reported there were 2,493 foreclosure filings and in 2010 that number decreased to 569. The 2010 number of foreclosure filings in St. Clair County was equivalent to 3.4 percent of the housing units there and the 2014 number was equivalent to .79 percent.

Michigan change in foreclosure filings

Overall, we see that there has been a very substantial decline in foreclosure filings in Metro-Detroit. However, the number of foreclosure filings in 2010 may still be having an affect on today’s current rental market. Foreclosure is damaging to an individual’s credit score, making it more difficult to take out lines of credit, which can affect an their ability to purchase a home. With foreclosure filings ranking in the thousands in each county for at least a few years, it is likely that at least a large share of people whose properties were ultimately foreclosed went to seek rentals. This would mean the total number of renters in the region would have increased, which could lead to an increase in rental demand, particularly if the number of rental units did not increase. The topic of rental demand as it relates to the percent of renter occupied units and the number of rental units available will be explored in upcoming posts as we continue to explore housing issues, particularly those related to increasing rental costs, in Southeastern Michigan.