What City in Southeastern Michigan has the Most Police Protection Per Capita?

What city in Southeastern Michigan has the most police protection per capita?  Grosse Pointe Shores, Bloomfield Hills and Belleville do. Respectively, those three communities have the highest number of sworn law enforcement officers per capita. According to data based on FBI reports there were 619 officers per capita (per 100,000 people) in Grosse Pointe Shores, 599 in Bloomfield Hills and 596 in Belleville in 2018. This compares to raw data showing there were 18 sworn law enforcement offices in Grosse Pointe Shores in 2018, 24 in Bloomfield Hills and 23 in Belleville. Examining data on a per capita basis allows us to see a more level playing field, so while Grosse Pointe Shores has far fewer citizens than other cities, examining data on a per capita basis allows us see that that city put a high value on law enforcement as part of their budget priorities.

In Southeastern Michigan the City of Detroit had the highest number of sworn law enforcement officers in 2018 at 3,019, according to the most recent data available. Detroit is also the largest city in the State of Michigan with more than 600,000 residents. In the City of Detroit, per 100,000 people, there were 357 law enforcement officers, just 57.6 percent of Grose Point Shores. To be sure, some Detroiters might wish to have more officers, but their budget is unlikely to support more.  Regionally, the City of Detroit ranked fourth in terms of the number of sworn law enforcement officers per 100,000 people. According to governing.com, the average number of officers for a community with more than 500,000 citizens is 240 per 100,000 people; for communities with between 25,000 and 50,000 citizens that number is 151 officers per 100,000 people and it is 166 officers per 100,00 people for communities with between 50,000 and 100,000 people. When comparing the Detroit and Governing data, both from 2018, it shows that Detroit had more officers than the national average. 

When examining the number of communities in the region with the lowest numbers of officers per capita the data shows that Capac, Waterford and Highland Park had the three lowest numbers in Southeastern Michigan. According to the data, in Capac there were 67 sworn officers per 100,000 people in 2018, Waterford there 74, and in Highland Park there 84. When looking at this in just raw data, Capac had 1 law enforcement officer, Waterford Township had 54 and Highland Park had 9. 

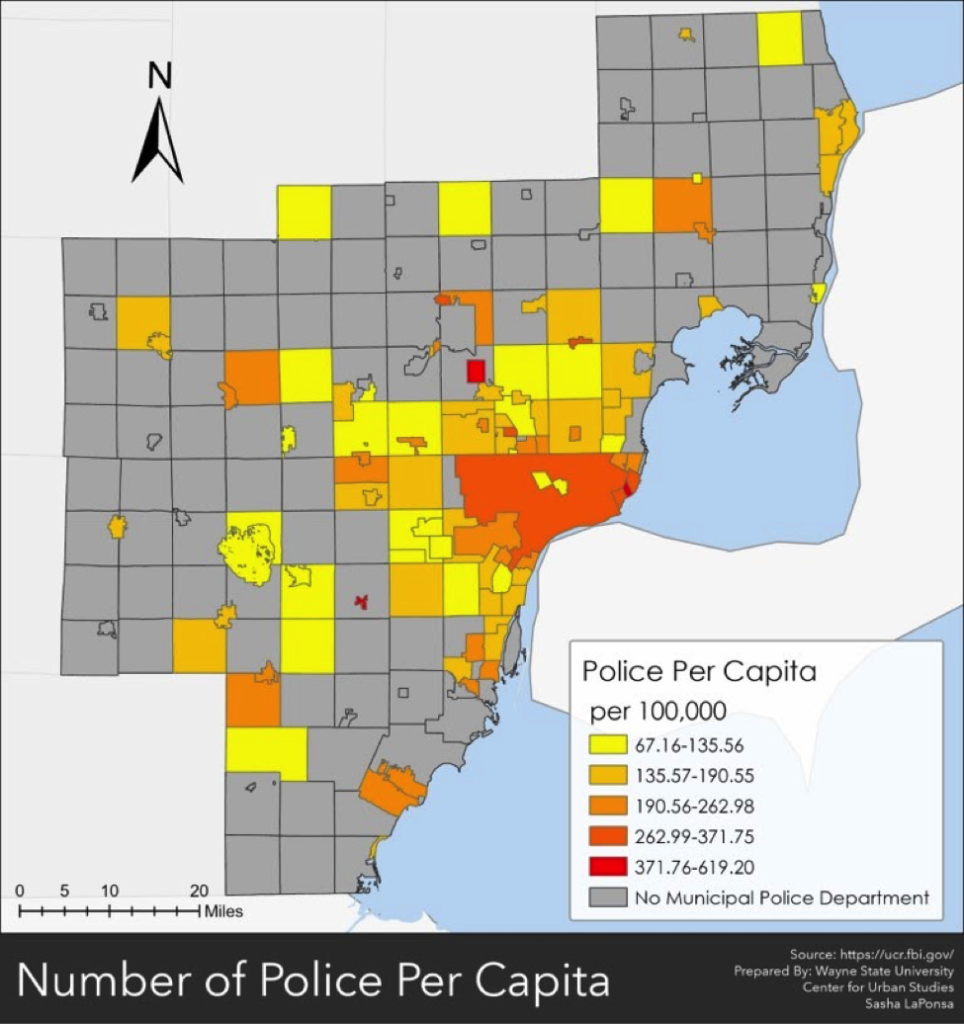
In addition to the map above showing the number of law enforcement officers per capita at the municipal level for communities with a dedicated local police department it also highlights how many communities do not have a dedicated police department. The communities in grey do not have a dedicated police department and instead are patrolled by a neighboring community, if a contract is entered into, or by the local sheriff’s department. In some cases, such as in Macomb Township, although there isn’t a local department, the township does have a contract with the Macomb County Sheriff’s Department to ensure a dedicated number of officers patrol the area at all times. The map above also highlights how most of the inner-city suburbs have local police departments, with some of the highest  number of officers per capita, while the communities on the outskirts of the region, which are typically more rural with fewer people, tend to not have a dedicated department or patrol. 

Understanding the number of officers a community has on a per capita level helps determine what its overall priorities may be. While in general, police departments receive funding from the general fund, special tax levies are sometimes approved to help financially support them. How much money a department receives from the general fund, and if a special levy is approved to further support it directly, shows the value a community places on a police department and its services. However, community values around safety are beginning to shift, especially as of late. While public funds can be used for more officers, they can also be allocated to increased spending on mental health programs, educational programs and other areas that are also shown to help keep a community safe. 

COVID-19 Update: Michigan Reports 705 new COVID cases on September 23

Michigan reported 705 new COVID cases on Sept. 23, 2020, bringing the total number of cases Michigan reported to 118,615. In Chart 1 we show that the State total for the number of COVID cases on Sept. 21 was 117,134–a five-day rolling average. The five-day rolling average for the total number of COVID cases (Chart 1) reflects a smoother curve and adjusts for fluctuations in testing and/or the quality of reporting or failure to report.

Chart 2 shows that, based on the five-day rolling averages, the growth of new COVID cases in Wayne, Oakland and Macomb counties continues to increase at higher rates than the other counties in the region and than Detroit, which once had the highest number cases. On Sept. 21, Wayne County reported the highest number of cases in the region at 17,898. Oakland County reported 16,191 cases and Macomb County reported 13,648. Detroit reported 14,238 COVID cases on Sept. 21. While Detroit reported more overall cases than Macomb County the chart does show Macomb County’s case numbers are on pace to surpass Detroit’s numbers.

In addition to having the highest number of total COVID cases Wayne County in the region, Charts 3 and 3.1 (which is just a closer look at the data) shows that it also had the highest number of daily cases on Sept. 21. Wayne County reported 33 new cases on Sept. 21. Oakland and Macomb counties each reported 22 new daily cases and Detroit reported 10 new cases, according to the five-day rolling averages.

The daily data highlighted in these posts is from Michigan.gov/coronavirus, where data is updated daily at 3 p.m. Historical data were supplied from covidtracking.com, which republishes COVID data from the State. Additionally, the case totals do not reflect the number of people who have recovered, just those who have been infected. In early June the State changed how it reports its data on the website, making data more accurate in the long-term but more complicated to track as well. The State regularly updates older data and as we continue to publish regular updates on COVID the State’s changes to past data many not always be reflected in our posts. The data published in new posts is accurate for the day we received it on though.

The map below highlights the average number of new daily COVID cases between Sept. 10 and Sept. 17 for the City of Detroit and the seven counties in Southeastern Michigan. As reflective of the data discussed above, Wayne County had the highest average number of new daily cases at 59, followed by Oakland County with an average of 47 new daily COVID cases last week and Macomb County with an average of 28 new daily cases. The averages reported here are less than the averages reported last week, however, they are more than the daily number of new cases reported on Sept. 21. In Detroit there was an average of 21 new cases per day last week; this is higher than the new number of cases reported for Detroit on Sept. 21 (five-day-rolling average). The fact that the numbers on Sept. 21 were lower than the average number of new COVID cases last week could mean case numbers are continuing to decline.

It should be noted that the State of Michigan regularly updates its daily COVID database, causing some large jumps in reported case numbers day-to-day; this may be impact the averages.

In Chart 4, the five-day rolling average for the number of deaths, shows the number of deaths in the State of Michigan reached 6,669 on Sept. 21. The actual cumulative COVID-19 deaths on Sept. 23 was 6,692, an increase of 12 deaths from the prior day. Chart 5 (a 5-day rolling average) further hones in on how majority the number of COVID related deaths has continued to remain flat for some time in Southeastern Michigan. On Sept. 21, the City of Detroit reported 1,519 deaths. Wayne County had the second highest total at 1,276 deaths on Sept. 21.

Charts 6 and Chart 6.1 shows how on Sept. 21 Detroit was the only one in the region of the eight government entities examined that reported a death; Detroit reported 1 death.

The map below shows the average number of daily COVID deaths between Sept. 10 and Sept. 17. These numbers are similar to what was reported on Sept. 21 (five-day-rolling average) in the region and further highlights how the number of daily COVID deaths in Southeastern Michigan continues to remain flat. Wayne County reported the highest average number of daily COVID deaths last week at 0.9; Oakland and Macomb counties reported 0.8 deaths and the City of Detroit reported an average of 0.5 daily COVID deaths between Sept.10-17. 

With school back in session we are already starting to see pockets of outbreaks in K-12 schools, and even larger outbreaks at universities and colleges. How the spread of the virus will increase or decrease as the weather begins to get colder and schools continue to work toward in-person school remains unknown. We do know though that there are ways to curb the spread of the virus, which includes wearing masks, maintaining physical distance from others and being in open air spaces.

What District in Southeastern Michigan are Virtual, Hybrid or In-Person

COVID-19 has brought about many changes in the last several months since the pandemic hit, including how students across the nation are being taught. In March, when the virus first started affecting Michigan residents, schools across the State closed their doors and went to online teaching. With the start of the new school year, most districts in Southeastern Michigan began the year virtually. As the map below shows, most school districts in the region opted for virtual learning for the start of school (61). However, there were 43 districts in the region that started off the school year with in-person learning; all but one also offered students the option to take classes online (Britton-Macon Area School District). Furthermore, there were 23 districts in the region that offered a hybrid-start, which means students split their time between in-person learning and at-home virtual learning. 

Description: https://lh6.googleusercontent.com/lH6bwWXtLhmVONcbmcmOWau4eoUfITr_ejGQd5Nm7U-kNvxueOgLUr17s9fm8A3neARh9LUapPuizfvwOg9EvUCnaHZyyhgNsRkOaOV7YhXGVHdFLA6iypxzXzYLBIDBZ2-xozqQ

The ability for each school district in the State to choose what type of education they offer to students was made possible through the “Return to Learn” package of bills that was signed by Gov. Gretchen Whitmer in August. This package of bills gave the districts local control to decide what is best for the students and their families in terms of the type of learning environments offered. Between hybrid and all virtual education approaches, it’s clear that most districts decided at least some limitation to student-to-student and student-to-teacher interaction was necessary to curb the spread of the virus. 

With school being in session for only a few weeks, some schools that started with face-to-face learning have already pulled back, halting the in-person option. According to the Detroit Free Press these schools include Novi High School and Detroit Country Day. The same article though said Birmingham, Livonia and Utica schools are looking to bring students back in for face-to-face learning, despite currently being all virtual currently. 

According to the State of Michigan’s database on school outbreaks there have been small outbreaks at two schools in Oakland County (Oakland Christian Elementary and Notre Dame Preparatory School) and one in St. Clair County (St. Clair RESA).

We can hope for no additional outbreaks in our schools, but with 115,870 total COVID cases now confirmed in Michigan, 483 of which were new as of Sept. 19, the odds of that are low. 

Michigan Reports 571 New Cases on Sept. 15

Michigan reported 571 new COVID cases on Sept. 15, 2020, bringing the total number of cases Michigan reported to 113,183. In Chart 1 we show that the State total for the number of COVID cases on Sept. 13 was 111,935–a five-day rolling average. The five-day rolling average for the total number of COVID cases (Chart 1) reflects a smoother curve and adjusts for fluctuations in testing and/or the quality of reporting or failure to report.

Chart 2 shows that, based on the five-day rolling averages, the growth of new COVID cases in Southeastern Michigan continues to increase. The chart also shows that the growth of COVID cases in Detroit continues to flatten compared to the growth of cases in Wayne, Oakland and Macomb counties. On Sept. 13, Wayne County reported the highest number of cases in the region at 17,307. Oakland County reported 15,665 cases and Macomb County reported 13,261. Detroit reported 14,049 COVID cases on Sept. 13. While Detroit reported more overall cases than Macomb County the chart does show Macomb County’s case numbers growing at a faster rate than the City’s.

In addition to having the highest number of total COVID cases Wayne County in the region, Charts 3 and 3.1 (which is just a closer look at the data) shows that it also had the highest number of daily cases on Sept. 13. Wayne County reported 33 new cases on Sept. 13. Oakland County reported 25 new daily cases, Macomb County reported 14 and Detroit reported 14 new cases, according to the five-day rolling averages.

The daily data highlighted in these posts is from Michigan.gov/coronavirus, where data is updated daily at 3 p.m. Historical data were supplied from covidtracking.com, which republishes COVID data from the State. Additionally, the case totals do not reflect the number of people who have recovered, just those who have been infected. In early June the State changed how it reports its data on the website, making data more accurate in the long-term but more complicated to track as well. The State regularly updates older data and as we continue to publish regular updates on COVID the State’s changes to past data many not always be reflected in our posts. The data published in new posts is accurate for the day we received it on though.

The map below highlights the average number of new daily COVID cases between Sept. 3 and Sept. 10 for the City of Detroit and the seven counties in Southeastern Michigan. As reflective of the data discussed above, Wayne County had the highest average number of new daily cases at 154, followed by Oakland County with an average of 116 new daily COVID cases last week and Macomb County with an average of 87 new daily cases. The average numbers reported last week are more than triple of what is being reported for these counties on Sept. 13. In Detroit there was an average of 35 new cases per day last week; this is also above the new number of cases reported for Detroit on Sept. 13 (five-day-rolling average).

It should be noted that the State of Michigan regularly updates its daily COVID database, causing some large jumps in reported case numbers day-to-day; this may be impact the averages.

In Chart 4, the five-day rolling average for the number of deaths in Michigan, shows the number of deaths in the State of Michigan reached 6,595 on Sept. 13. The actual cumulative COVID-19 deaths on Sept. 15 was 6,612, an increase of 11 deaths from the prior day.  However, of those 11 deaths, 5 were added to the daily total after death certificates were compared to the COVID database.

Chart 5 (a 5-day rolling average) further hones in on how majority the number of COVID related deaths has significantly flattened out in Southeastern Michigan. On Sept. 13, the City of Detroit reported 1,513 deaths. Wayne County had the second highest total at 1,259 deaths on Sept. 13.

Charts 6 and Chart 6.1 shows how on Sept. 1 Macomb, Oakland, Washtenaw and Wayne counties each reported 1 new death.

The map below shows the average number of daily COVID deaths between Sept. 3 and Sept. 10. These numbers are similar to what was reported on Sept. 13 (five-day-rolling average) in the region and further highlighst how the number of daily COVID deaths in Southeastern Michigan has remained fairly stagnant. Oakland County reported the highest average number of daily COVID deaths last week at 2.6; Wayne County reported 2 and Macomb County reported 1.8. The City of Detroit reported an average of 0.4 daily COVID deaths between Sept.3-10. 

We continue to battle the coronavirus and as students head back to school, both at the K-12 and college levels, it is likely daily numbers will see, at least, intermittent spikes. Certain universities throughout the State are already reporting outbreaks and data from the State shows that those between the ages of 20-29 continue to be the most common carriers of the disease. At one point, early on in the pandemic, we “celebrated” new daily case numbers being reported at 600 or less. However, as this seems to be becoming the new normal we must still be cautious and concerned. COVID is viral and easily transmittable. It is a disease that wreaks havoc on a person’s body and can lead to death. We must not put our guard down. We must fully implement and respect health guidelines. We must continue to consider what this disease can do not only to us individually, but to our family, friends, neighbors and our society-physically, emotionally and economically.

Income Inequality Varies By Community when Comparing Black and Latino Populations

Substantial differences in median incomes between the Black and Latino communities in Southeastern Michigan exists, just as those differences were highlighted in recent posts between the black and white communities in the region and the Latino and white communities. Of the 84 communities in the region where one population-Black or Latino-earned more on average than another there was about an even split between the Black population in a community earning more than a Latino population and vice versa. 

(In the map above the Black population is making “more” or “less,” so for example, the bottom number at the legend means the Black population in that community is making $117,242 less than the Latino population.)

According to the U.S. Census Bureau, in 42 communities in Southeastern Michigan the Black population, on average, out earned the Latino population. The community that saw the largest median income gap between these two populations was Grosse Pointe, where the median income for the Black population was $171,000 and the median income for the Latino population was $53,000; the income gap between the two was $117,000. The community with the second largest income gap between the Black and Latino population was Bloomfield Township where the Black population, on average, earned $158,000 and the Latino population earned on average $108,000; the income gap was $50,000. 

When looking at the communities where the Latino population on average out earned the Black population in Southeastern Michigan we see that Utica had the largest gap. According to the data, a median household income for a Latino population in Utica was $118,000 and for a black household it was $29,000, making the income gap $90,000. In Brighton, the income gap was $81,000 where the median household income for the Latino population was $138,000 and was $57,000 for the Black population. 

In the City of Detroit the median household for the Black population is $32,000 and the median household income for the Latino population is $34,000; the Latino population, on average, out earned the Black population by $2,000.

While this post sheds light on income equality that exists between two minority populations in the region, this series (earlier posts can be found here) further highlighted how the white population in Southeastern Michigan earned more than both the Black and Latino populations. According to the data, there were 74 of 84 communities in Southeastern Michigan where the white population out earned the Latino population and 60 communities where the white population out earned the Black population. Furthermore, the data shows that the income gap between the white populations and Black populations in the region was higher than the income gaps between the white and Latino and Black populations. When examining this data we must also take into account that several communities in the region did not have enough data to compare one or more of the populations to another. 

Income inequality is not an issue unique to the Metro-Detroit area nor the State of Michigan. Nationwide the white population continues to out earn minority populations. According to the New York Times, the median white family has 41 times more wealth than the median Black family and 22 times more wealth than the median Latino family. Wealth for white families also increases at a much faster rate than those of minority families. Discussing the income inequality gap is one thing, but understanding how to change it is another. Of course this takes policy actions at the state and national levels. These actions include increasing the minimum wage and continuing to break down barriers that have led to segregation and racism. Companies must also take action in this change by addressing their hiring and wage policies. And finally, education is key. We must continue to discuss this topic and educate others on how it can be changed. 

Income Inequality in Southeastern Michigan: White and Latino Populations

Income inequalities exist between several racial groups, and as we highlighted last week, those gaps are often wide when comparing white median incomes to those of minority populations (at the municipal level) in Southeastern Michigan. As we show in this post, that gap exists between the white and Latino populations in the region. However, the largest median income difference between the white population in a community and the Latino population is about $30,000 less than the largest median income difference between a white population and a black population in a community (locally). In other words, the income gap between the white and black populations in Southeastern Michigan is larger than the income gap between the white and Latino populations in the region, according to data from the US Census Bureau.

According to the data, the City of Brighton has the highest median income gap between the white and black populations that live there; this gap is about $48,000. In the City of Brighton the median income for the white population is about $105,000 and for the Latino population it is $57,000. For comparison, Genoa Township, which is also in Livingston County, has the largest median income gap between the white and black populations in the region; this gap is $81,000. When looking at the five communities in the region with the largest median income gap between the white and Latino populations we see that those five communities are in the outer-ring suburbs and that the amounts range from $44,000 to $48,000. Those five communities what the highest gap are: Brighton, Ida, City of Northville, Northville Township and Superior Township.

Overall, there are 74 communities where the median income for the white population is higher than the Latino population. Of those communities, Allen Park has the smallest gap at $698; the median income for the white population is $71,650 and the median income for the Latino population is $70,952.

While there are more communities in Southeastern Michigan where the white population out-earns the Latino population, there are several communities where the median income gap between the Latino and white population is greater for the white population. According to the data, in Holly the median income for the Latino population is $221,121 and the median income for the white population is $63,151; this is about a $158,000 gap. Brandon Township and Huntington Woods also have median income gaps above $100,000 where the Latino population out-earns the white population. In total, there are 60 communities in the region where the Latino population out-earns the white population, according to median income data from the Census Bureau.

According to the Economic Policy Institute, white men make, on average, 30 percent more than Latino men and about 40 percent more than Latino women. This data is just another point in the income inequality discussion that is occurring locally and nationally. While there are specific instances where a minority group out earns other populations the data makes it clear that is not the norm. However, equal and equitable pay should be the norm, as should the opportunities to obtain that pay. 

COVID Update: Michigan Cases Reach 104,395

Michigan reported 685 new COVID cases on Sept. 3, 2020, bringing the total number of cases Michigan reported to 104,395. In Chart 1 we show that the State total for the number of COVID cases on Sept. 1 was 103,159–a five-day rolling average. The five-day rolling average for the total number of COVID cases (Chart 1) reflects a smoother curve and adjusts for fluctuations in testing and/or the quality of reporting or failure to report.

Chart 2 shows that, based on the five-day rolling averages, the growth of new COVID cases in Southeastern Michigan continues to increase. However, the chart also shows that the growth of COVID cases in Detroit has begun to stagnate compared to the growth of cases in Wayne, Oakland and Macomb counties. On Sept. 1, Wayne County reported the highest number of cases in the region at 15,909. Oakland County reported 14,611 cases and Macomb County reported 12,484. Detroit reported 13,696 COVID cases on Sept. 1.

In addition to having the highest number of total COVID cases Wayne County in the region, Charts 3 and 3.1 (which is just a closer look at the data) shows that it also had the highest number of daily cases on Sept. 1. Wayne County reported 33 new cases on Sept. 1. Oakland County reported 27 new daily cases, Macomb County reported 28 and Detroit reported 10 new cases, according to the five-day rolling averages.

The daily data highlighted in these posts is from Michigan.gov/coronavirus, where data is updated daily at 3 p.m. Historical data were supplied from covidtracking.com, which republishes COVID data from the State. Additionally, the case totals do not reflect the number of people who have recovered, just those who have been infected. In early June the State changed how it reports its data on the website, making data more accurate in the long-term but more complicated to track as well. The State regularly updates older data and as we continue to publish regular updates on COVID the State’s changes to past data many not always be reflected in our posts. The data published in new posts is accurate for the day we received it on though.

In Chart 4, the five-day rolling average for the number of deaths in Michigan, shows the number of deaths in the State of Michigan reached 6,495 on Sept. 1. The actual cumulative COVID-19 deaths on Sept. 3 was 6,519, an increase of 10 deaths from the prior day.  However, of those 10 deaths, 9 were added to the daily total after death certificates were compared to the COVID database.

Chart 7 (a 5-day rolling average) further hones in on how majority the number of COVID related deaths has significantly flattened out in Southeastern Michigan. On Sept. 1, the City of Detroit reported 1,510 deaths. Wayne County had the second highest total at 1,241 deaths on Sept. 1.

Charts 6 and Chart 6.1 shows how on Sept. 1 Macomb and Oakland counties each reported 2 new deaths and Wayne County reported 1 death.

White Households Out-Earn Black Households in 62 Southeastern Michigan Communities

In Southeastern Michigan, the city with the highest median income difference between the white and black population is Genoa, which is located in Livingston County. In Genoa, according to the U.S. Census Bureau, the median household income for a white household is about $81,000 and for a black household it is about $21,000. Grosse Pointe had the second highest median income gap between the two racial groups at $47,000, with the white household median income being $74,000 and the black household median income being $27,000. This, and the comparison for other communities in Southeastern Michigan, are shown in the first map below. Overall, in Southeastern Michigan there were 62 communities where white households out earned black households. Furthermore, there were 30 communities where black households out earned white households. Utica had the largest median income gap for this. In Utica, the median income gap between black and white households was about $66,000; the median income for black households was $119,000 and for white households it was $52,000. The range in which black households out earned white households in Southeastern Michigan was between $53 and $66,000. In Detroit, the median income gap between black and white households was $1,111, with black households earning more.

In looking more closely at the white median household incomes versus the black median household incomes the data shows that the range of median household incomes for the white population is between about $23,000 and $183,000. Lake Angellus in Oakland County had the highest median income for the white households in the region and Ecorse in Wayne County had the lowest at about $23,000. In Detroit, the median white household income was about $33,000. For the black community, the city with the highest household median income in Southeastern Michigan was Brighton in Livingston County. In Brighton the median household income for the black community was about $138,000 (for the white population it was $105,000). Genoa, which is also in Livingston County, also had the community with the lowest median black household income at $21,000.

These three maps highlight the income disparity in Southeastern Michigan at the racial level. As shown in the first map, there is a far greater disparity where the white households are out earning the black households. On average, the white population out earns the black population by 20 percent in the United States and that inequality has widen between 1979 and 2015, according to the Economic Policy Institute. With 62 communities where white households out earn black households by an average of up to $60,000 we must ask the question “why?” Historical, political, institutional and social contexts all a play a role in the wage gaps that exist racially and beyond.  The first map above also shows that the greater disparity locally is occurring in the outer-ring suburbs, where there are lower black population numbers and higher wealth above the white population. Much must happen to close this gap including local and national policy reforms for minimum wage, a dedication from employers to truly evaluate and overhaul their hiring practices and we, as a society, continuing to speak up and take action to ensure the gap is closed.