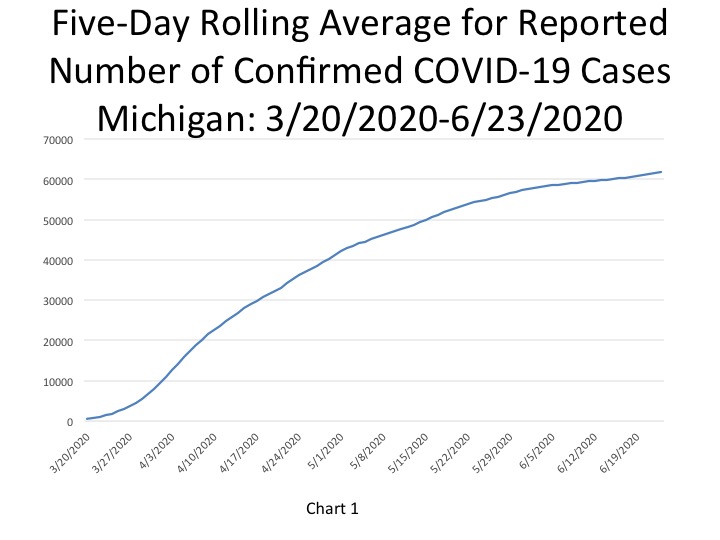
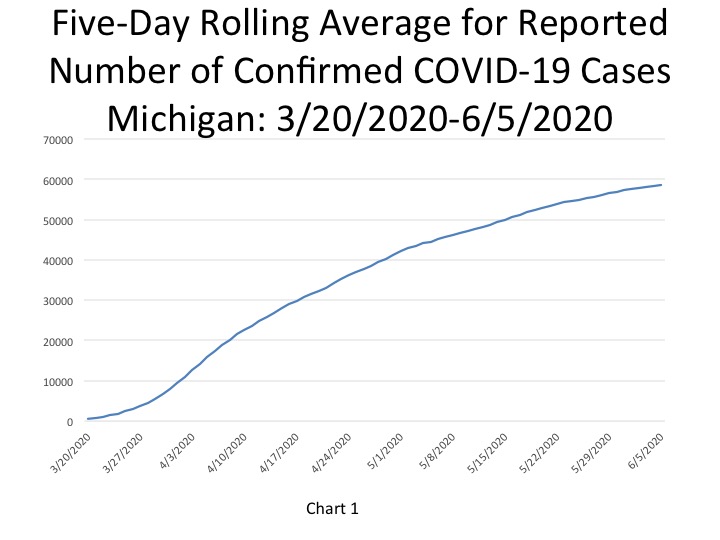
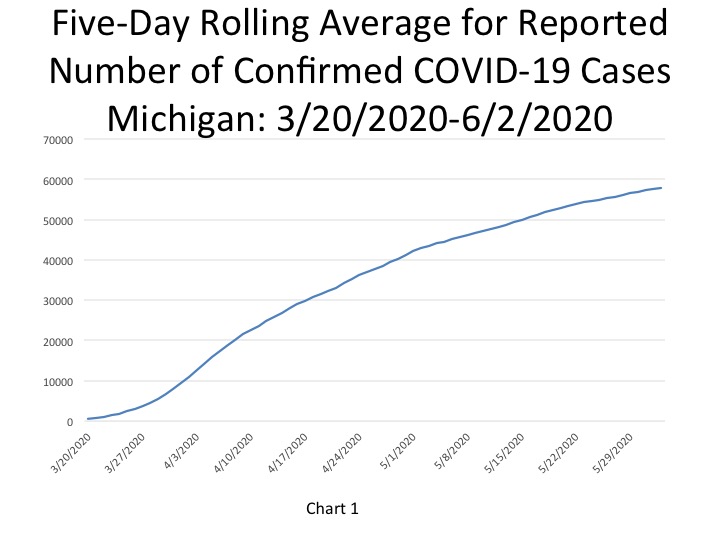
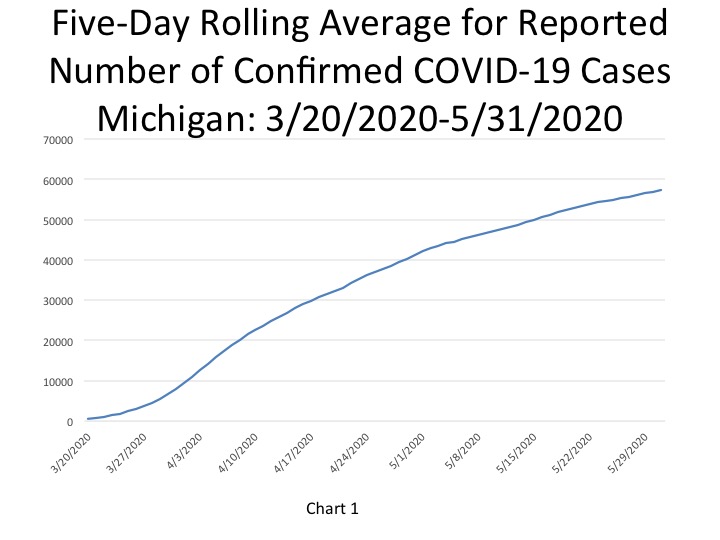
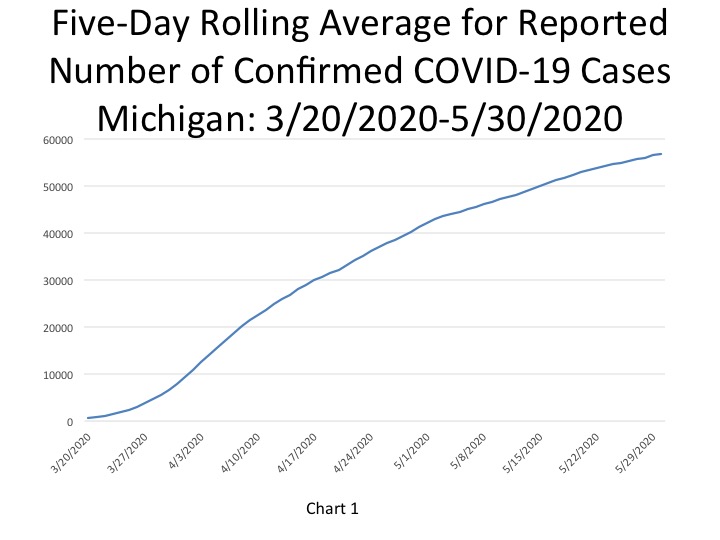
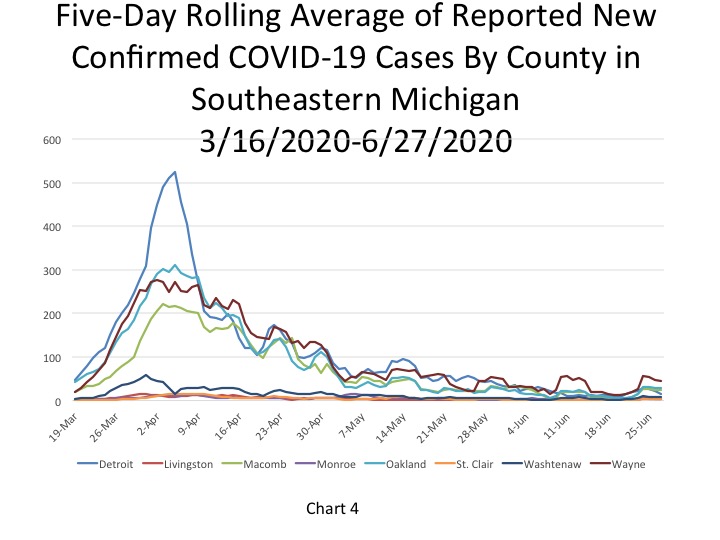
On June 29, the State of Michigan reported a total of 63,497 cases, an increase of 236 cases from the day prior. The daily total was equivalent to 636 cases per 100,000 people (Chart 4). Of those 236 cases, 86 were documented in Southeastern Michigan. In total, 36 percent of the new COVID cases were in Southeastern Michigan, meaning case numbers are increasing at a higher rate outside of the region than locally. In Chart 1 we show that the State total for the number of COVID cases on June 27 was 62,954–a five-day rolling average. The five-day rolling average for the total number of COVID cases (Chart 1) reflects a smoother curve and adjusts for fluctuations in testing and/or the quality of reporting or failure to report. A look at Chart 1 further reflects the higher number of new daily COVID cases than in the previous weeks.
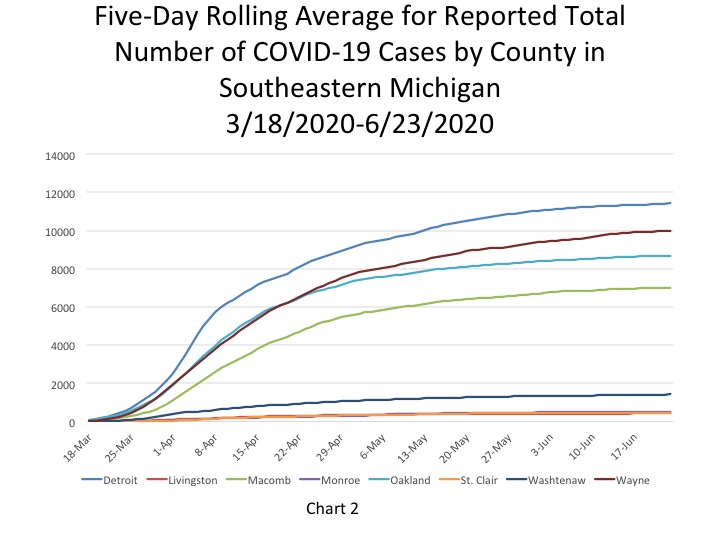
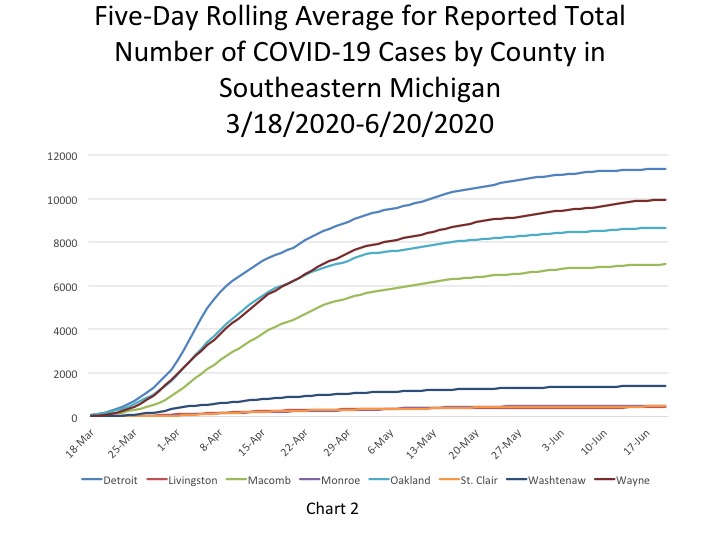
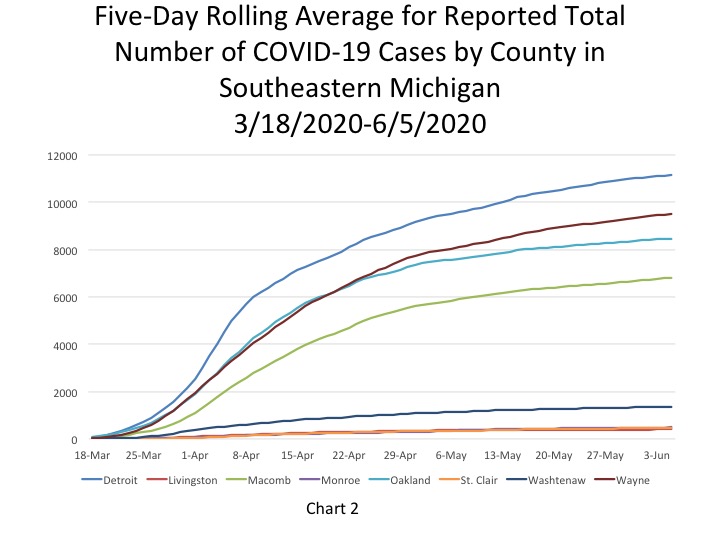
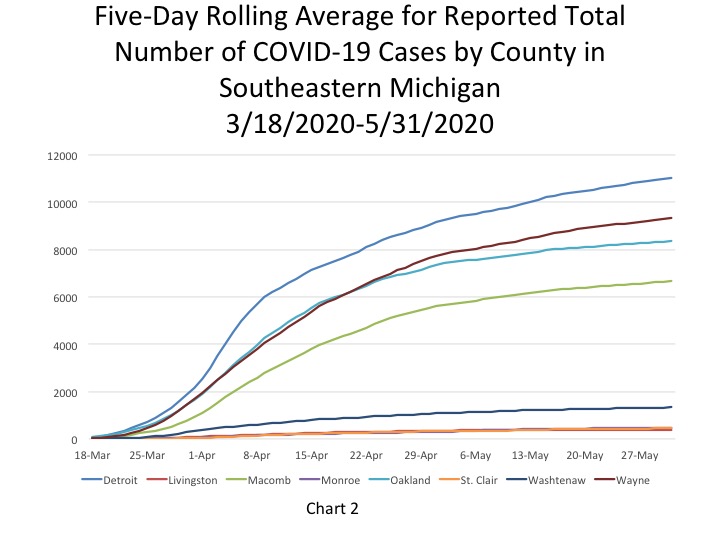
Chart 2 shows that, based on the five-day rolling averages, the growth of new COVID cases in Southeastern Michigan continues to increase but at a slower rate than previously, and at a slower rate than that of the entire State. A close look at the chart though shows a noticeable recent uptick in COVID numbers for Oakland and Wayne counties. On June 27 the number of cases in Oakland County reached 8,809, and in Wayne County 10,210 COVID cases were reported. Detroit reached 11,524 cases, the highest in the region, and Macomb County reported 7,106 cases.
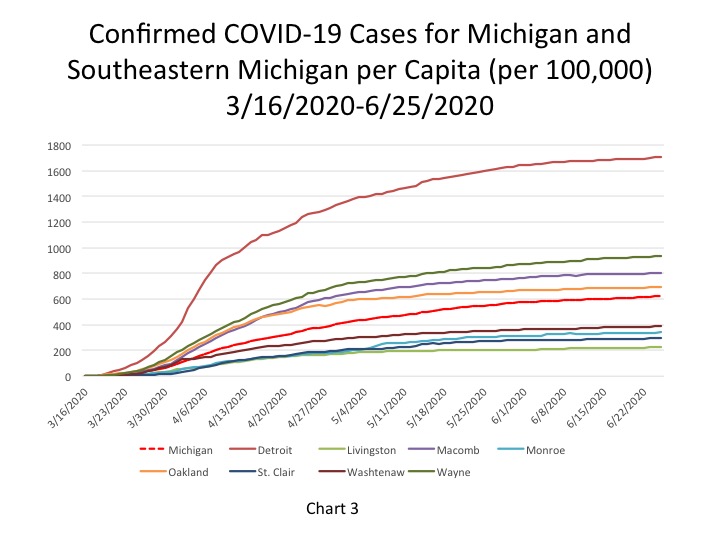
The City of Detroit had 1,716 COVID cases per 100,000 people as of June 29, an increase from 1,714 on June 28 (Chart 3). This is based upon a reported increase of 13 new COVID cases between June 28 and June 29, bringing the total number of COVID cases in Detroit to 11,593. Wayne County reported 953 cases per 100,000 people, and Oakland County had 704 cases per 100,000 people. These per capita rates were based upon 10,264 total cases for Wayne and for 8,848 Oakland. Macomb County reported 817 cases per 100,000 people, which is based upon 7,136 cases.
The daily data highlighted in these posts is from Michigan.gov/coronavirus, where data is updated daily at 3 p.m. Historical data were supplied from covidtracking.com, which republishes COVID data from the State. Additionally, the case totals do not reflect the number of people who have recovered, just those who have been infected. In early June the State changed how it reports its data on the website, making data more accurate in the long-term but more complicated to track as well. The State regularly updates older data and as we continue to publish regular updates on COVID the State’s changes to past data many not always be reflected in our posts. The data published in new posts is accurate for the day we received it on though.
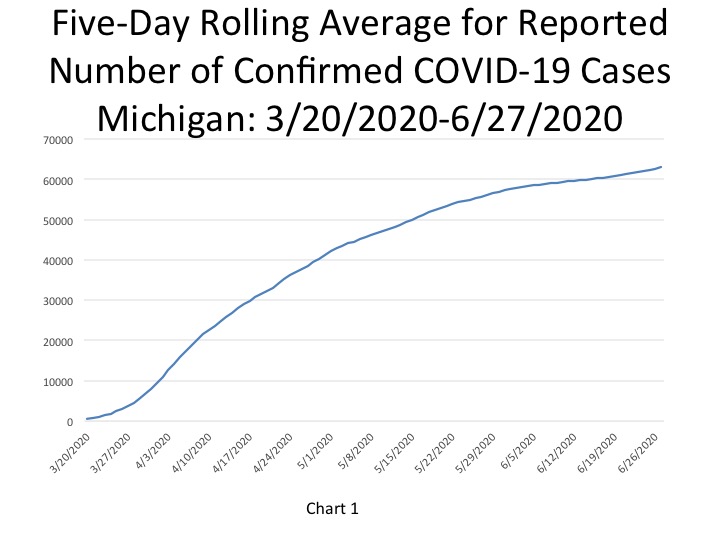
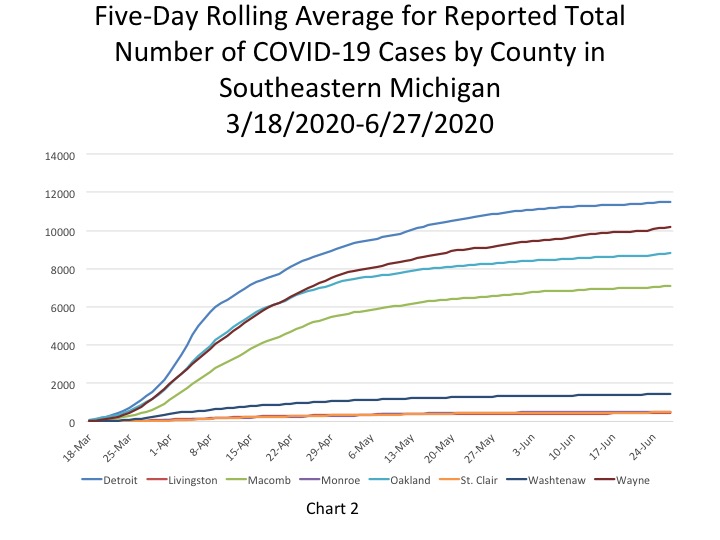
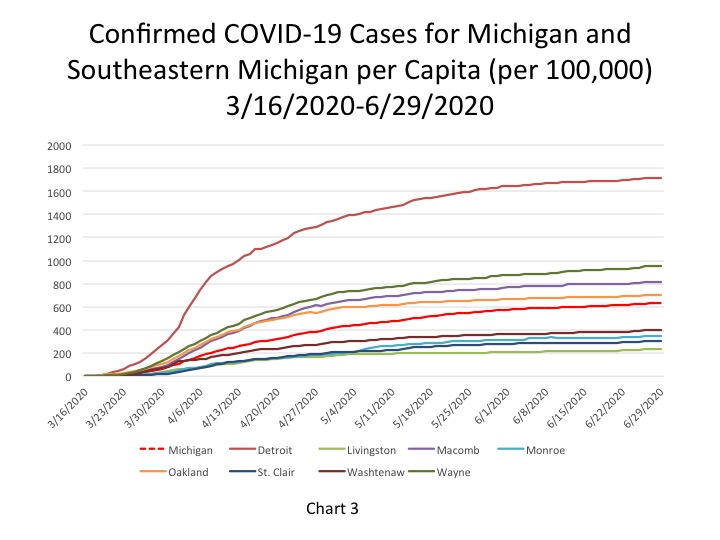
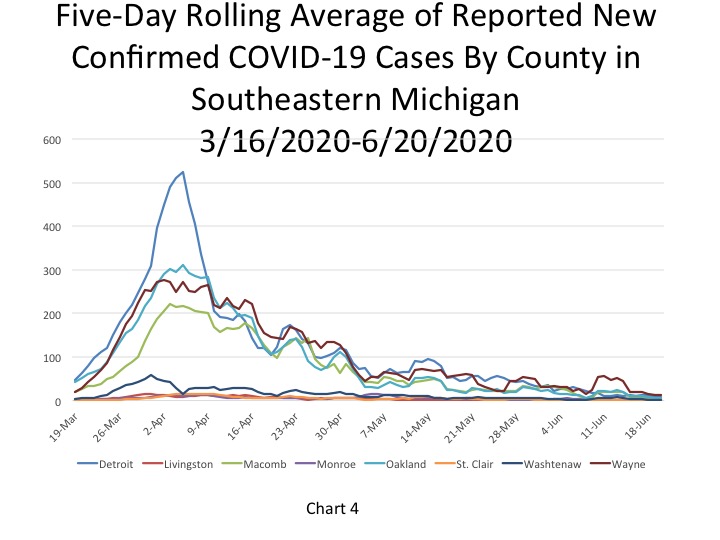
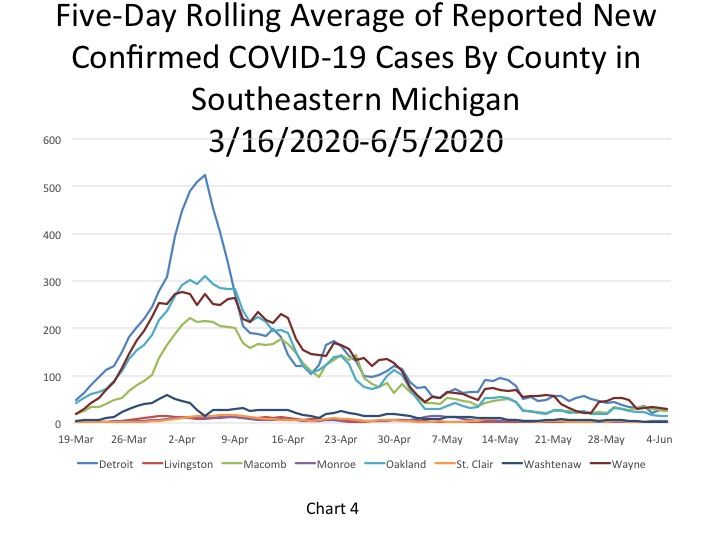
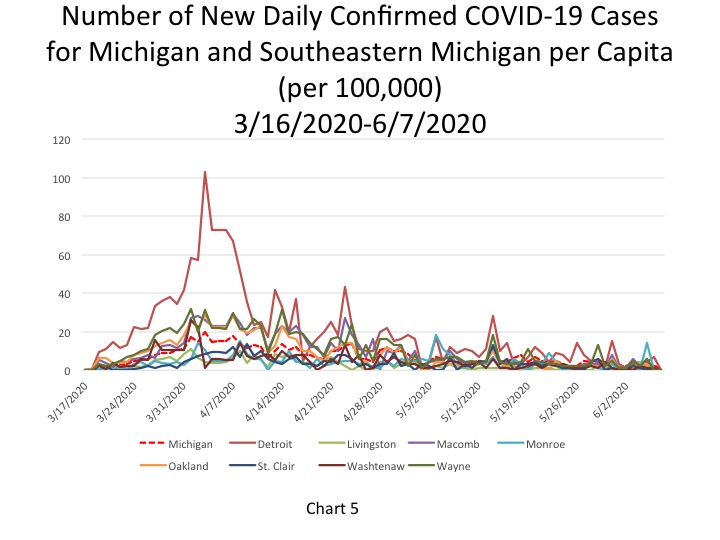
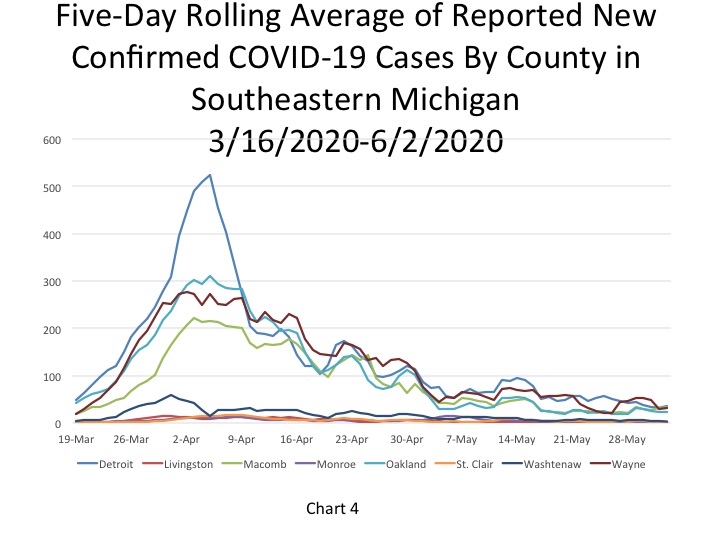
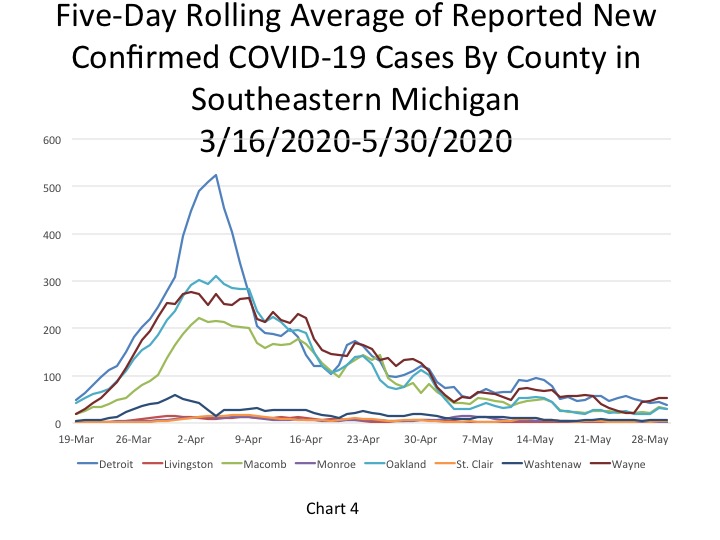
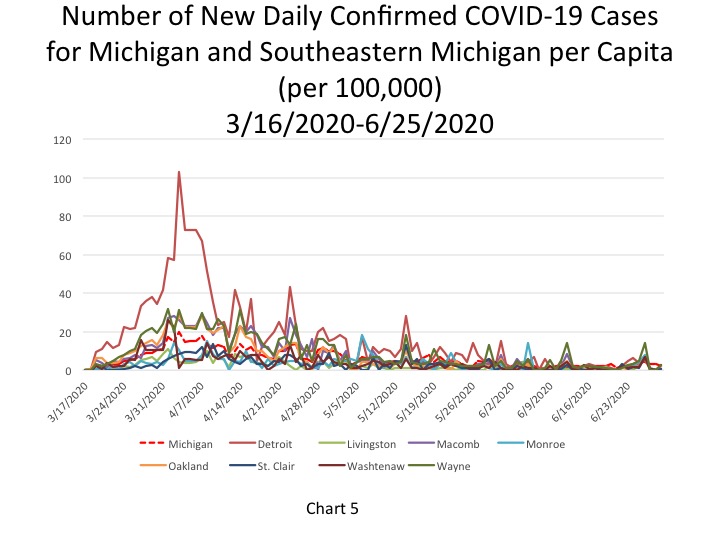
Chart 4 shows that Wayne County reported the highest number of daily cases, according to the five-day rolling average, at 46 on June 27. Detroit reported 15 new daily cases while Macomb and Oakland counties each reported numbers higher than Detroit. Oakland County reported 29 new COVID cases on June 27 and Macomb County reported 24 new cases. In the last four days Wayne, Oakland and Macomb counties saw the number of new daily COVID cases nearly double, or more, from what was being reported just a week ago.
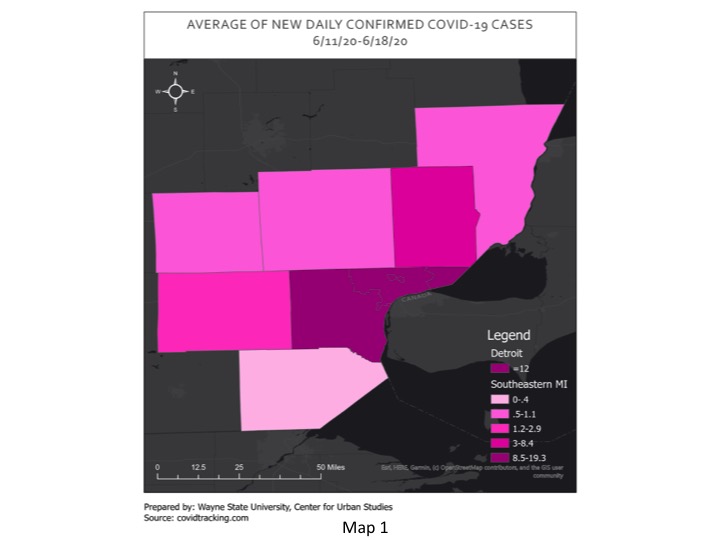
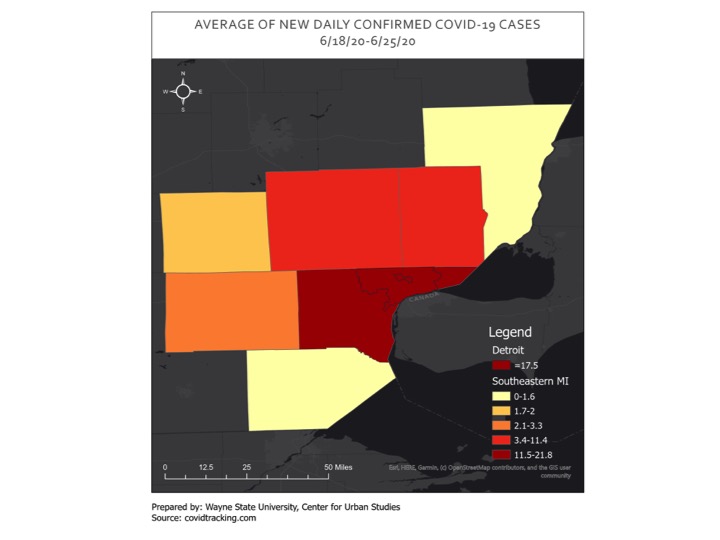
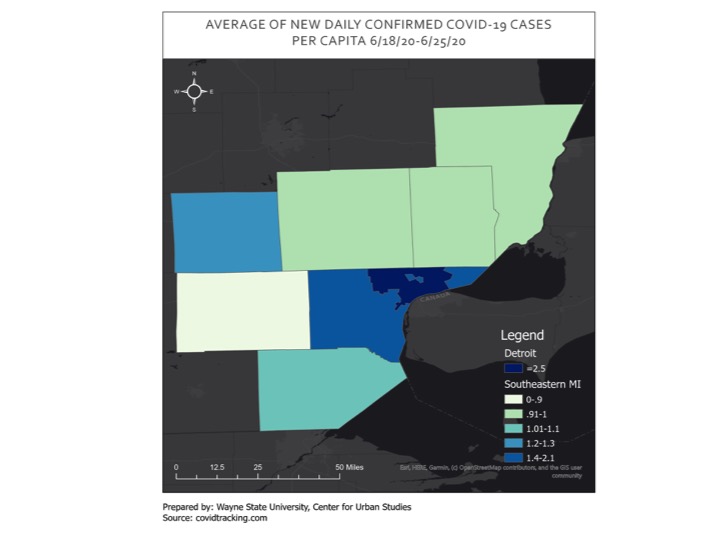
Map 1 shows the average number of new daily COVID cases in Southeastern Michigan between June 18 and June 25. Wayne County had the highest average of daily confirmed COVID cases last week at 21.8 and Detroit had the second highest average at 17.5. On June 27 though five day rolling average data (Chart 4) showed that new daily COVID numbers had increased by more than double for some counties, particularly Wayne, Oakland and Macomb counties. On June 27 Wayne County reported 46 new cases while last week’s average was 21.8 new cases. For Oakland County there was an average of 11.4 new daily COVID cases between June 18-25 and the June 27 five-day rolling average was 29. In Macomb County, last week’s average for the number of new daily COVID cases was 10 and on June 27 the five-day rolling average showed that number increased to 24.Unlike the Metro-Detroit counties, the City of Detroit did not experience a major spike in the number of new COVID cases between yesterday and last week. Last week’s average number of new COVID cases for Detroit was 18 (Map 1) and in Chart 4 we report that the number was 15.
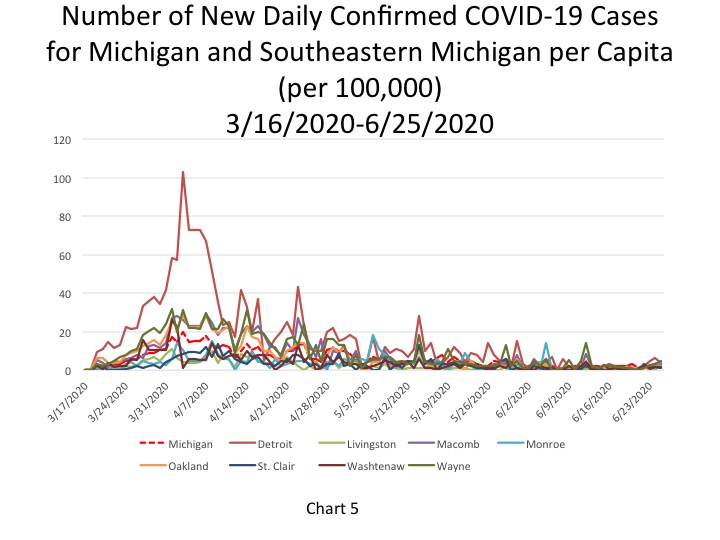
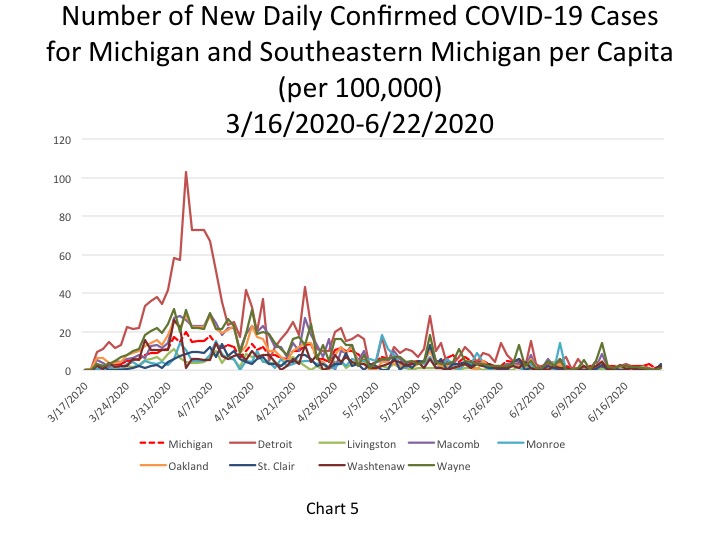
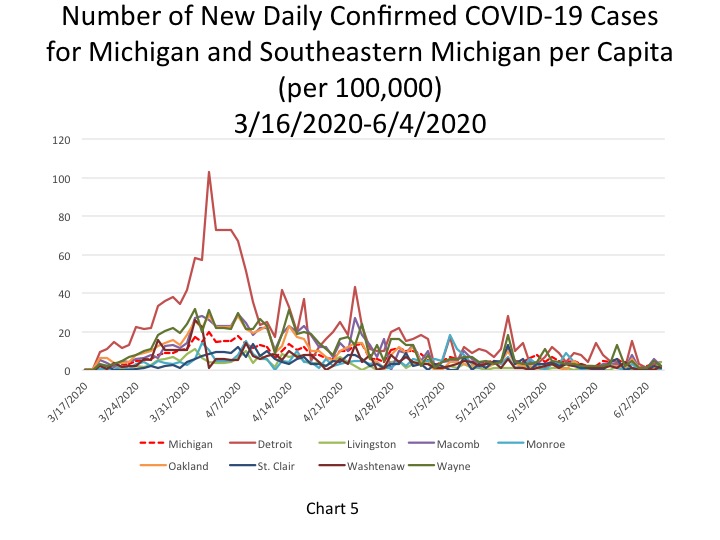
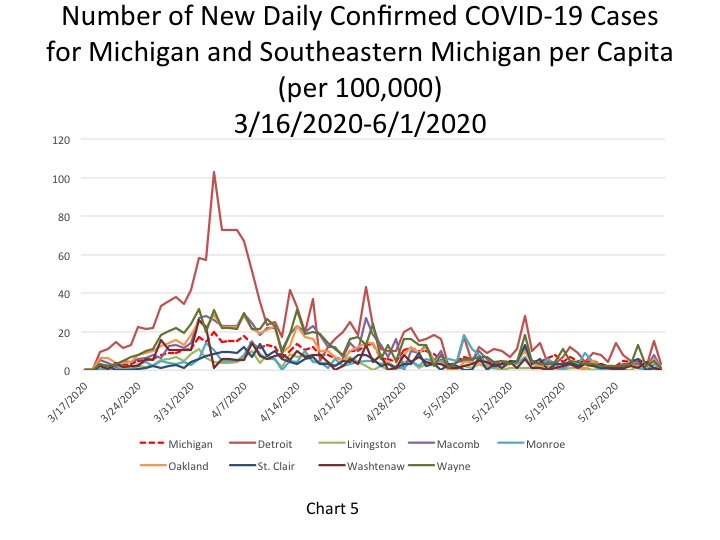
On June 29, the per capita rate for the number of new daily COVID cases per 100,000 people was 2 for the State, which was equivalent to 236 new cases. On June 29, Wayne County was the only local municipality to have a higher per capita rate than the State. Wayne County reported 3 new daily COVID cases per 100,000 people on June 29, which was equivalent to 27 new cases. Detroit and Macomb, Oakland and Washtenaw counties each reported 2 new daily COVID cases per 100,000 people. For Detroit, this per capita rate was equivalent to 13 new cases on June 29, and for Macomb and Oakland counties that rate was equivalent to 18 and 25 new cases, respectively. In Southeastern Michigan there were 86 new COVID cases reported on June 29, an increase from the 24 new COVID cases reported over the weekend for the region.
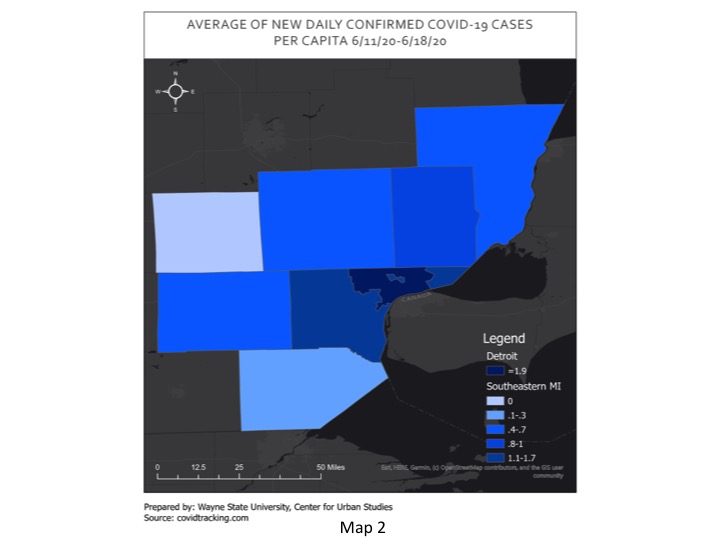
Map 2 reflects similar data to Map 1 but on a per capita basis (per 100,000 people). We once again see that the data reported on June 29 is higher than the per capita averages for June 18-25 for most of Southeastern Michigan.
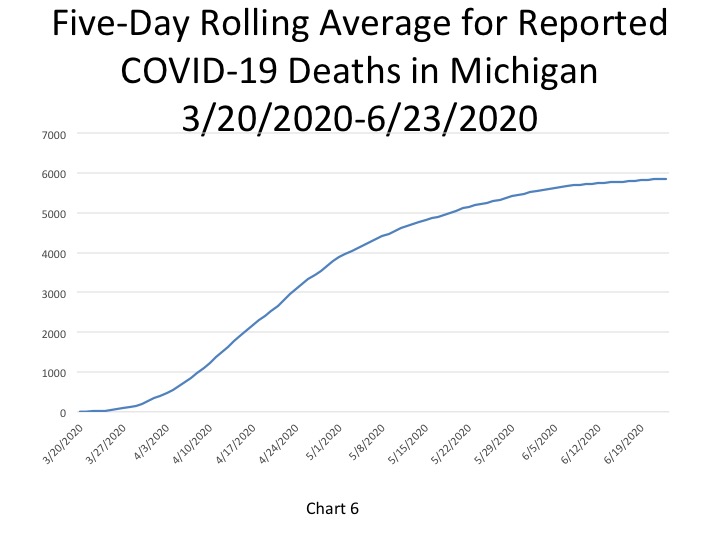
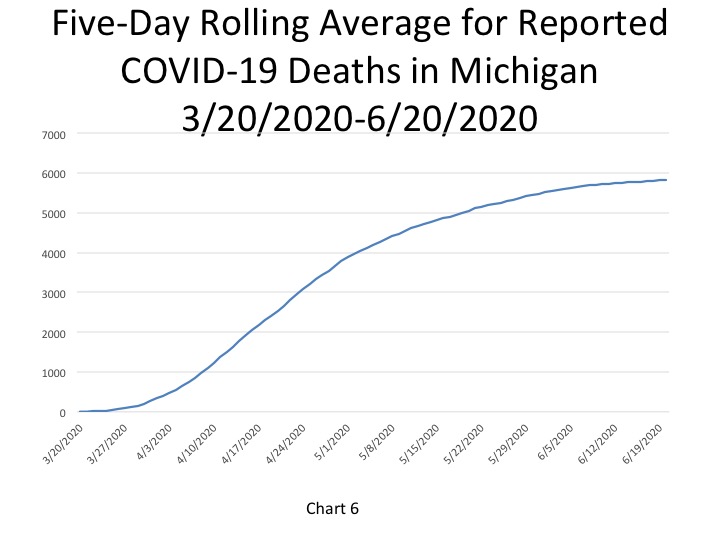
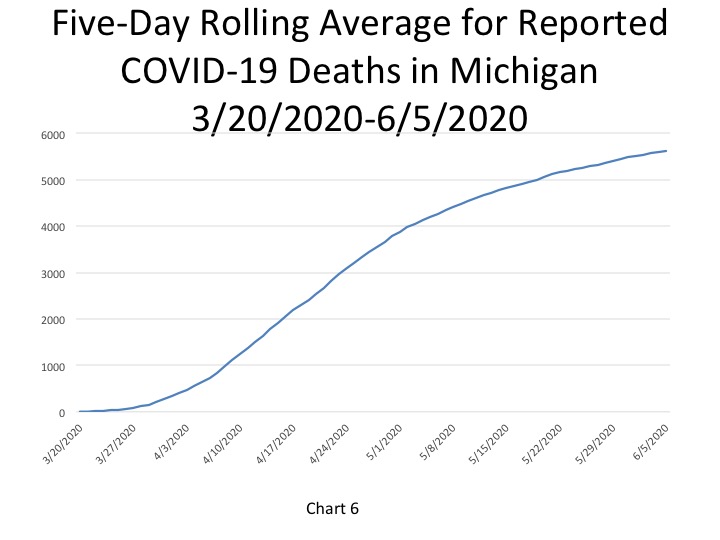
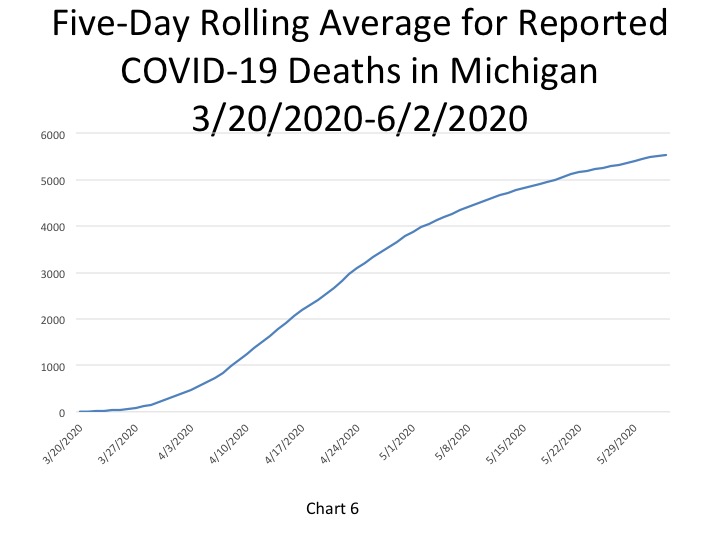
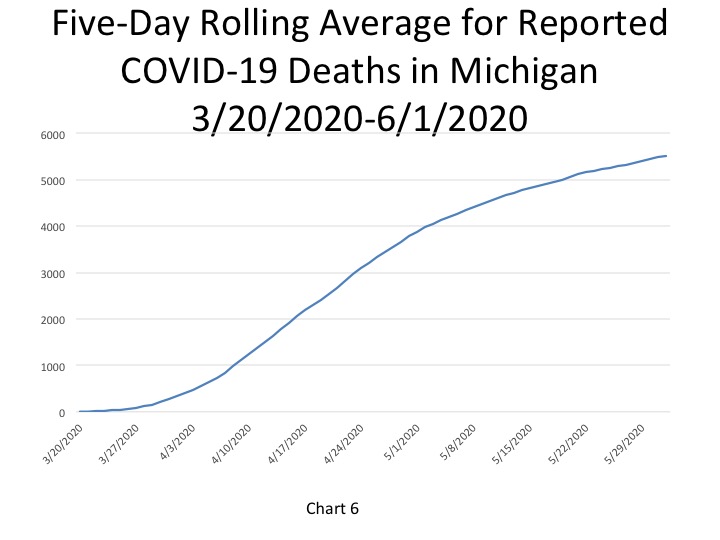
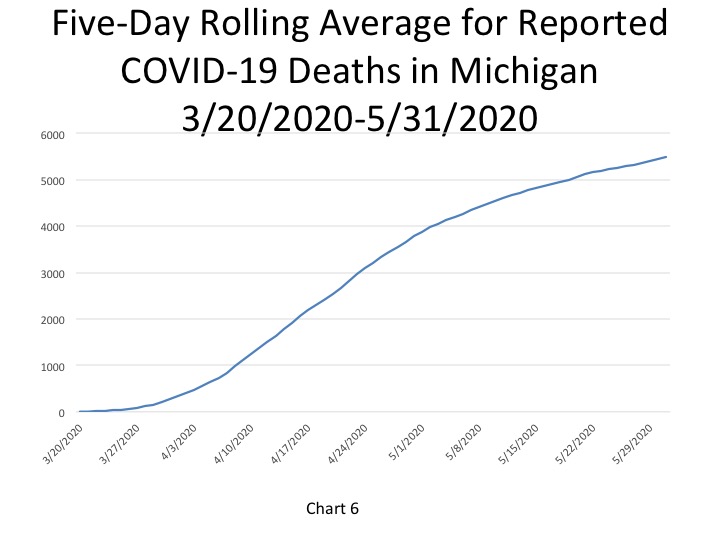
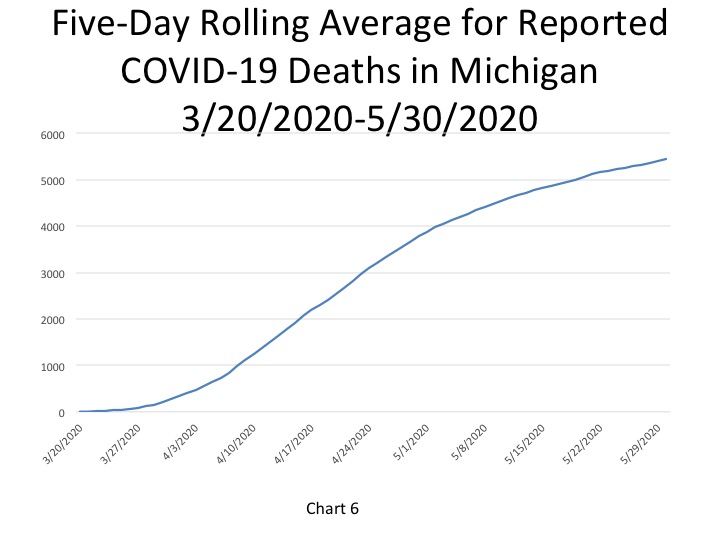
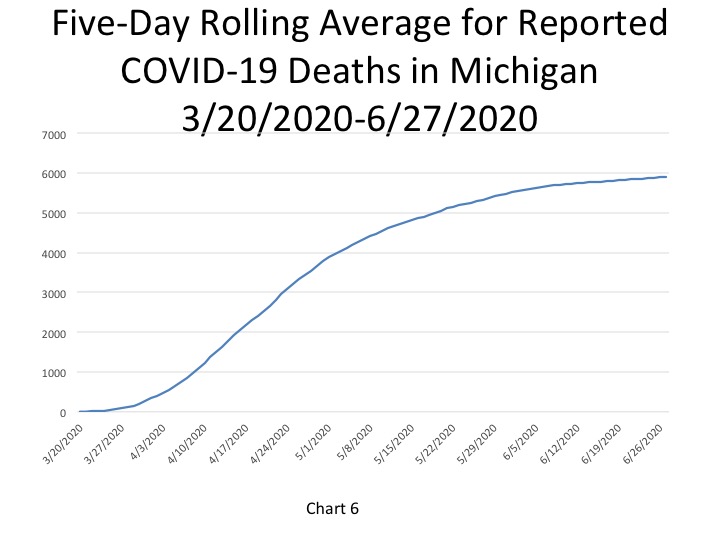
In Chart 6, the five-day rolling average for the number of deaths in Michigan, shows the number of deaths is increasing at a minimal rate. On June 27 there were 5,902 deaths (an increase of 2 deaths from the day prior). The actual cumulative COVID-19 deaths on June 29 was 5,915, an increase of 4 deaths from the prior day. Two of the deaths that were reported on June 29 occurred in Southeastern Michigan, one in Detroit and the other in Wayne County (outside of Detroit). Confused again
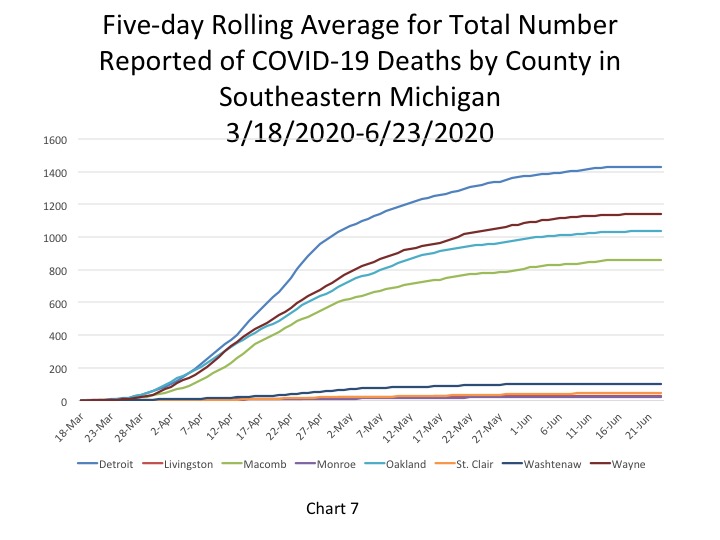
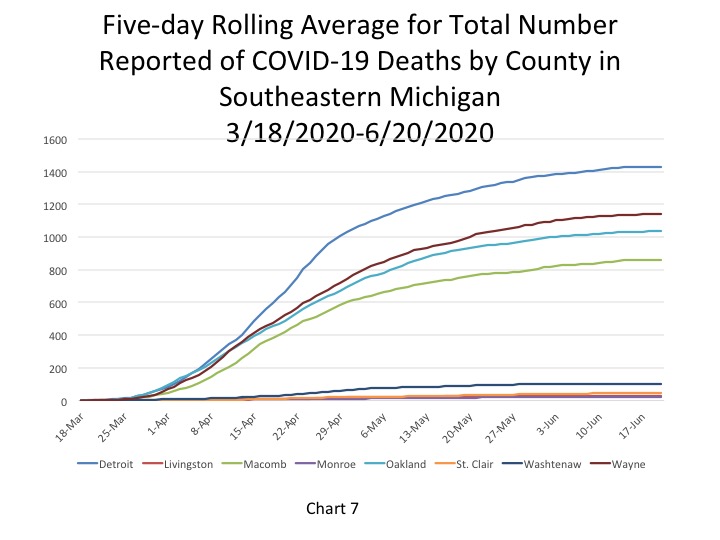
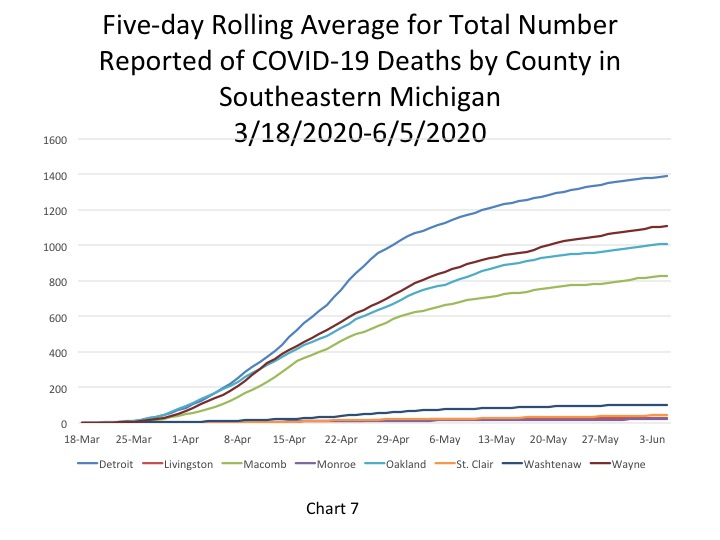
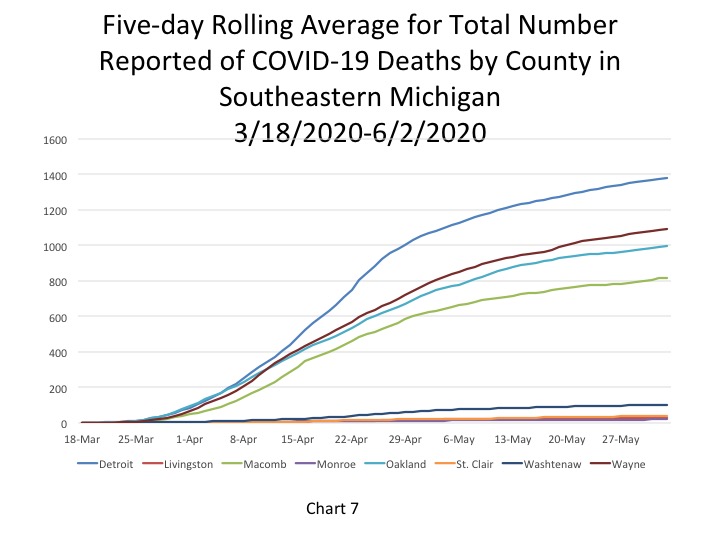
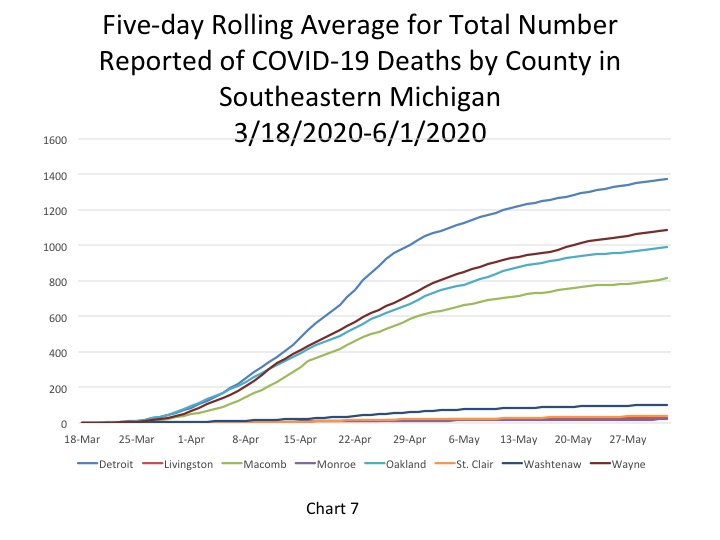
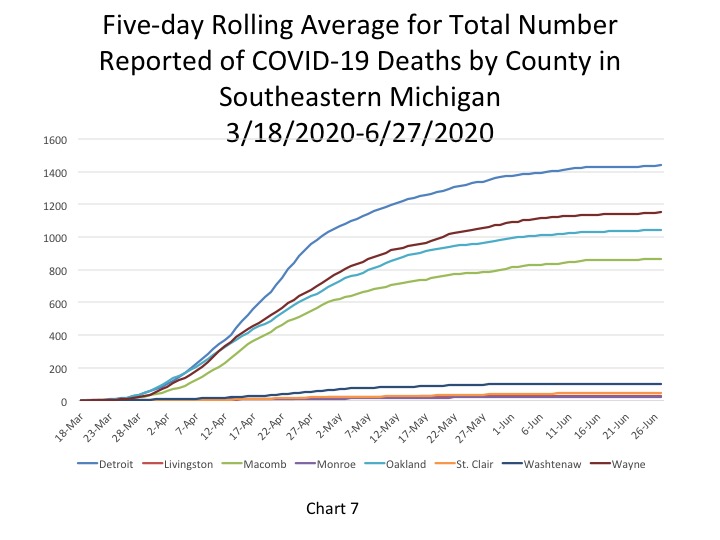
Chart 7 (a 5-day rolling average) echoes the message the statewide data is conveying regarding COVID deaths in Michigan-they are occurring at minimal rates and mostly in Southeastern Michigan. On June 27 the City of Detroit reported 1,438 deaths, an increase of 1 death from the day prior. Wayne County had the second highest total at 1,151 deaths on June 27.
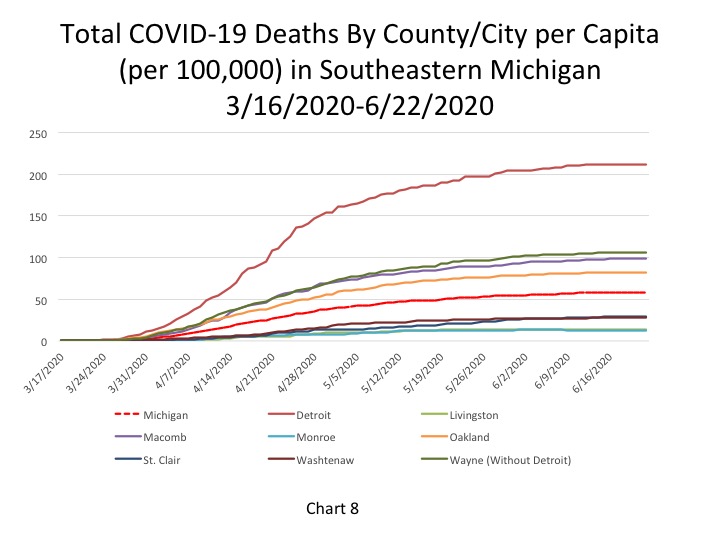
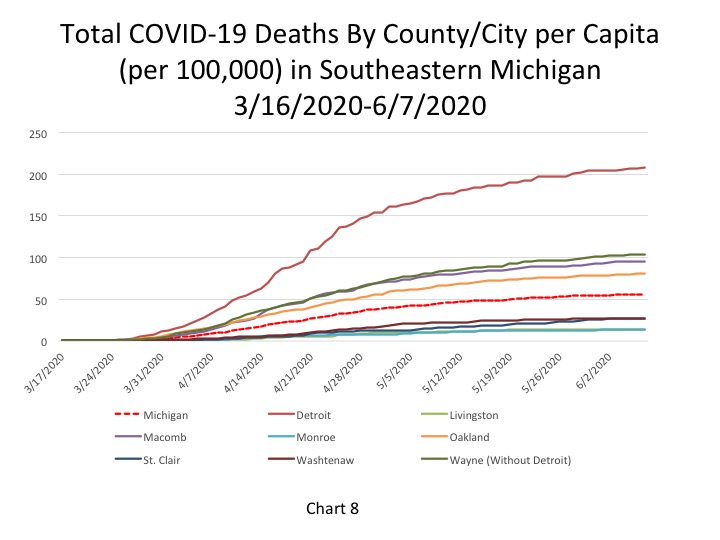
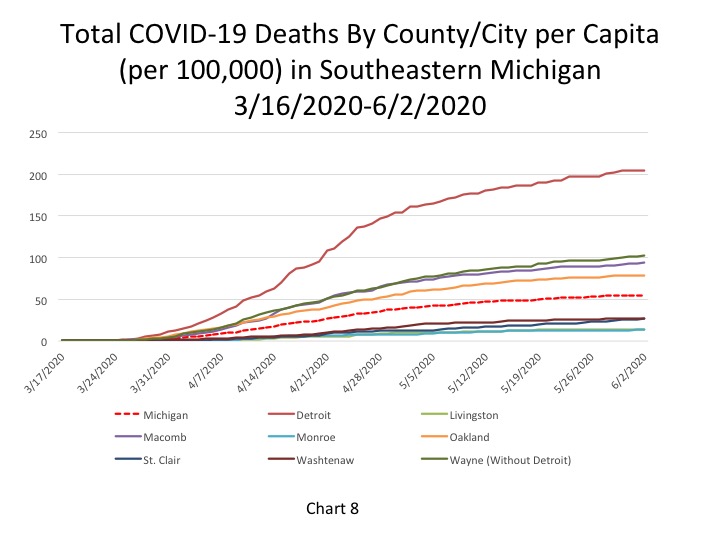
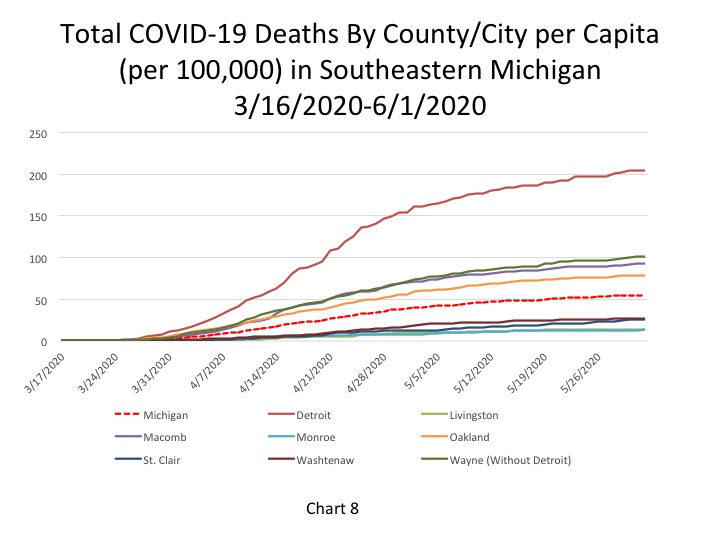
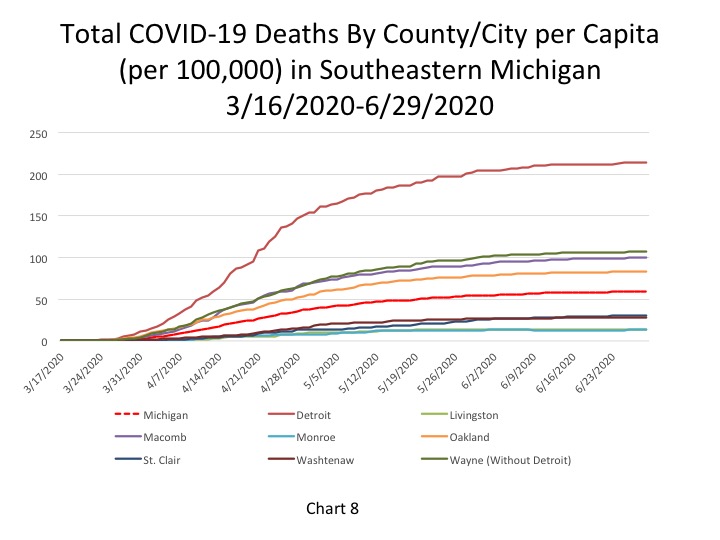
The per capita rates for the number of total COVID deaths in Southeastern Michigan remained the same for each entity in Southeastern Michigan on June 29 for at least the last four days, if not longer. Detroit reported 214 total COVID deaths per 100,000 people, which was equivalent to 1,439 deaths. Wayne County reported a per capita rate of 107 (1,153 deaths), Macomb County reported a per capita rate of 100 (870 deaths) and Oakland County reported a per capita rate of 83 (1,043 deaths). Each county in Southeastern Michigan, and the City of Detroit, have experienced no increase to minimal increases in the per capita rates for the number of total COVID deaths for the last several weeks.
The State of Michigan reported a per capita rate for the number of total COVID deaths at 59 per 100,000 people, which was equivalent to 5,915 total deaths.
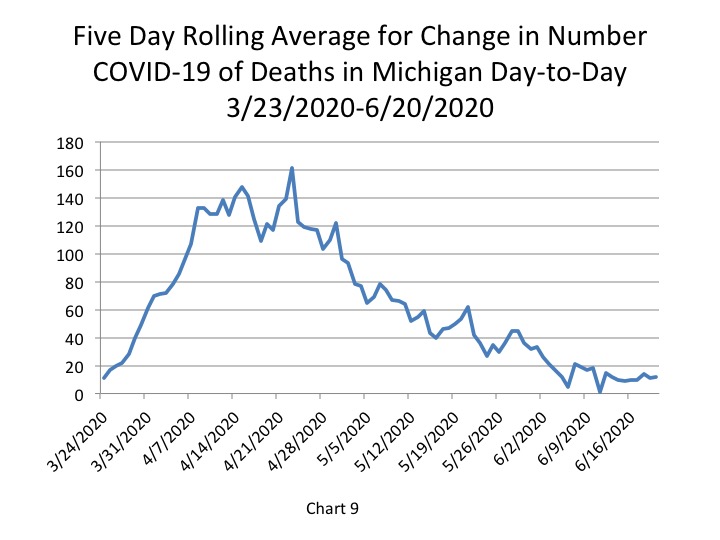
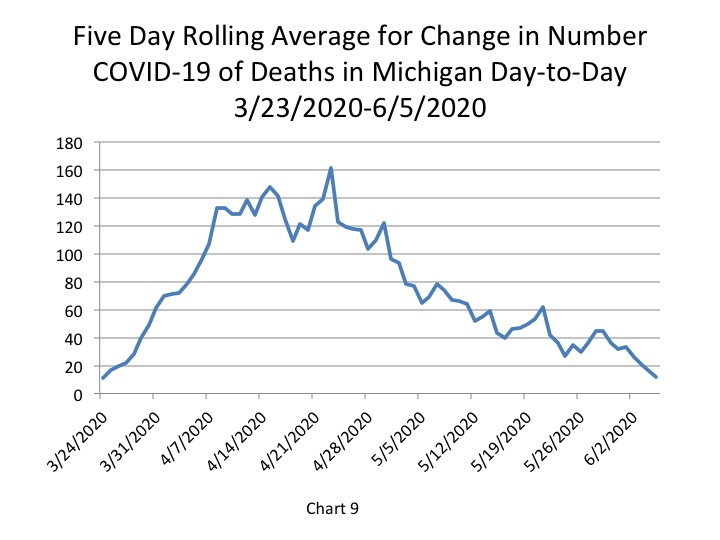
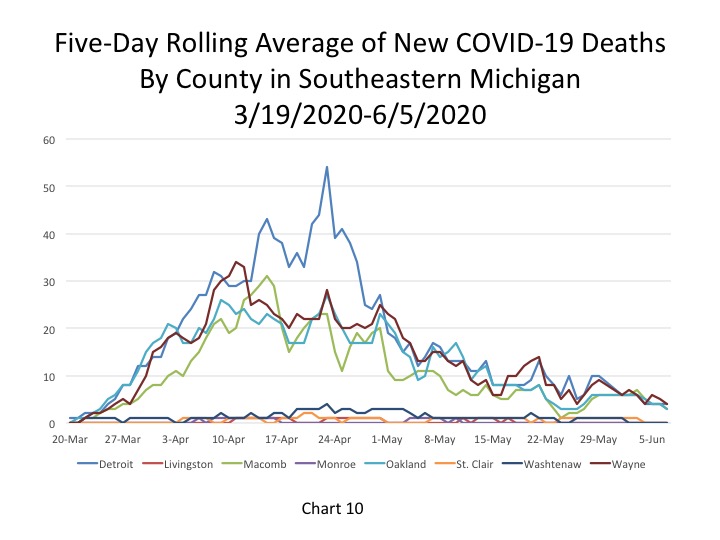
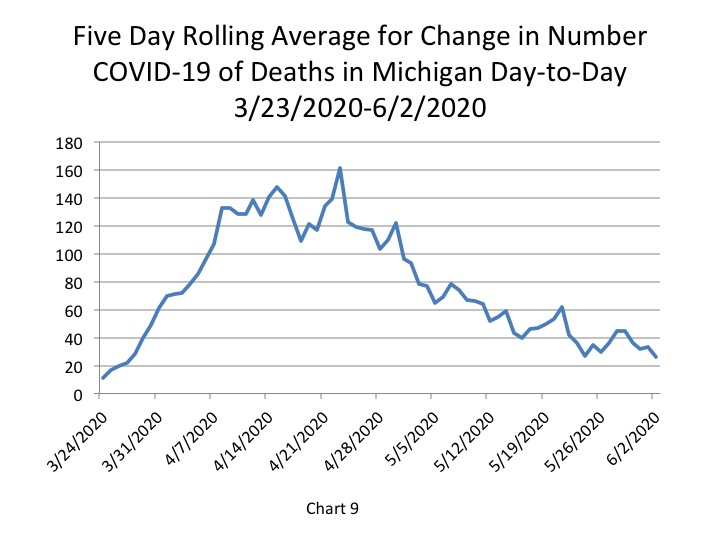
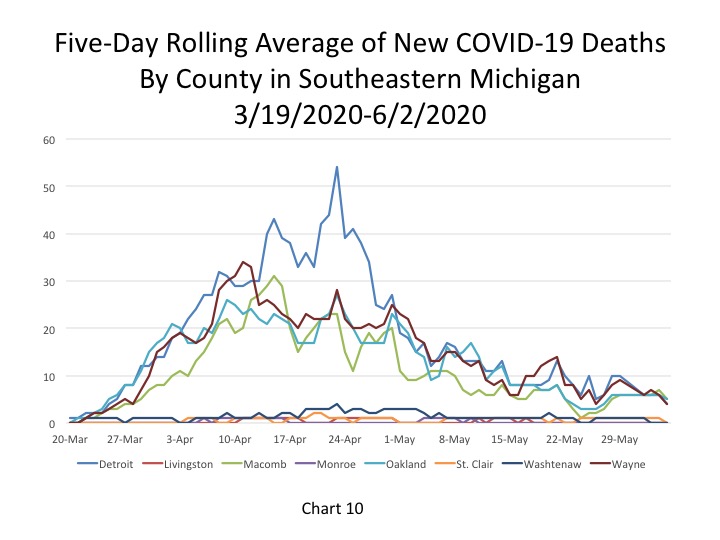
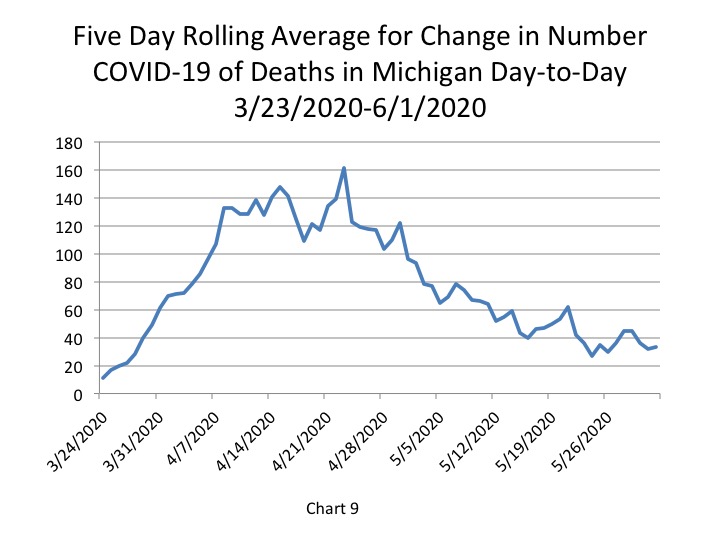
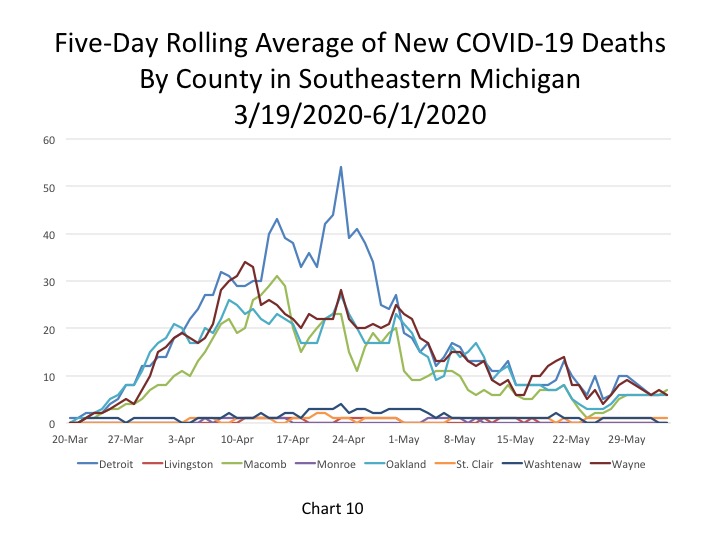
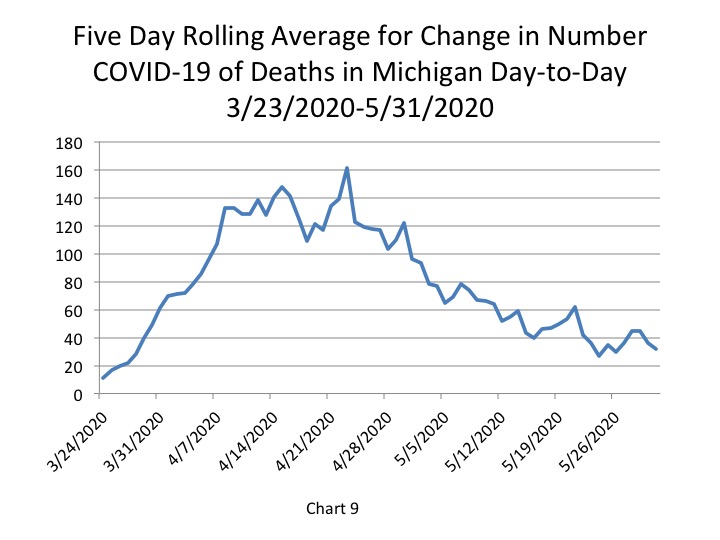
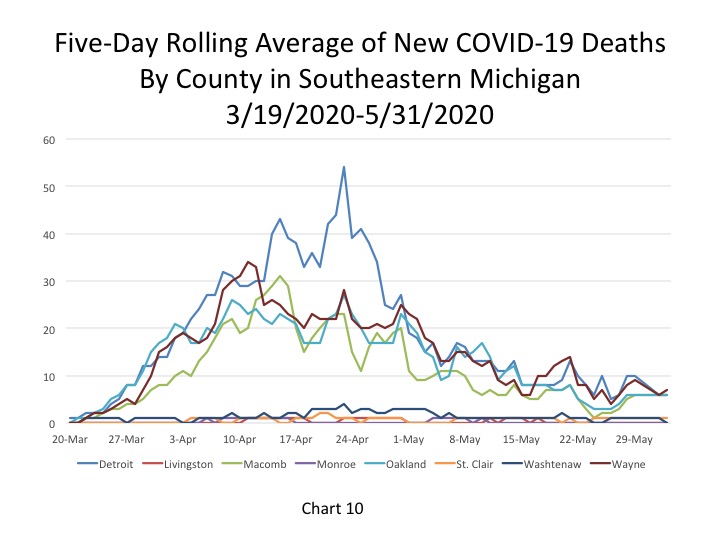
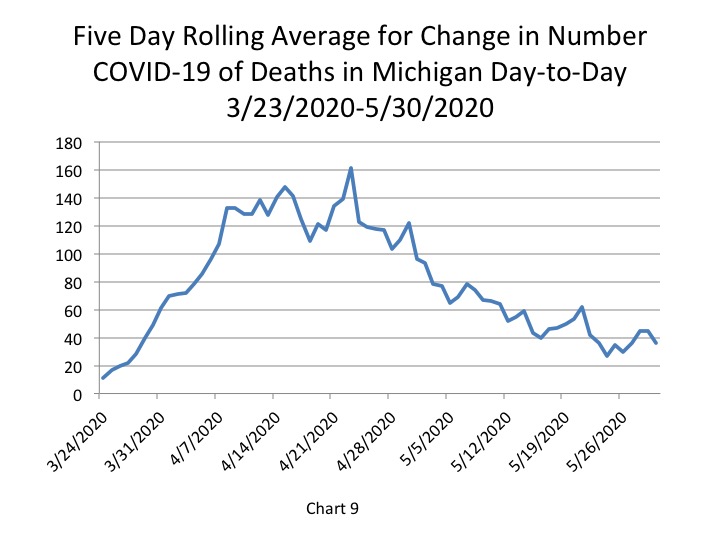
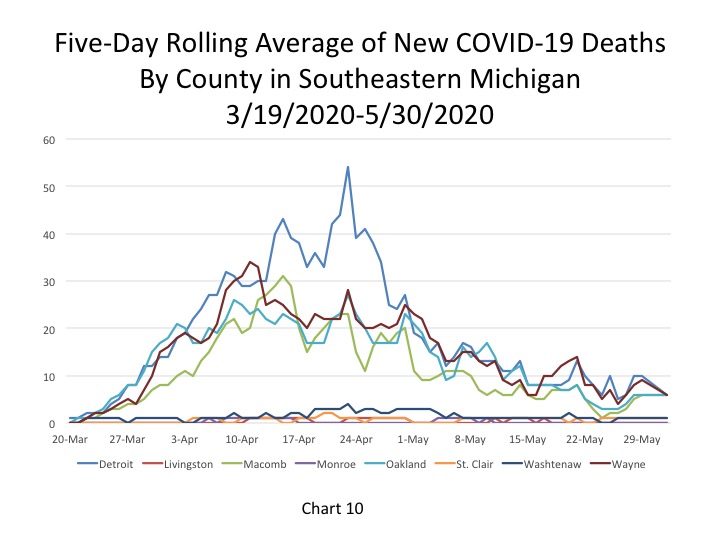
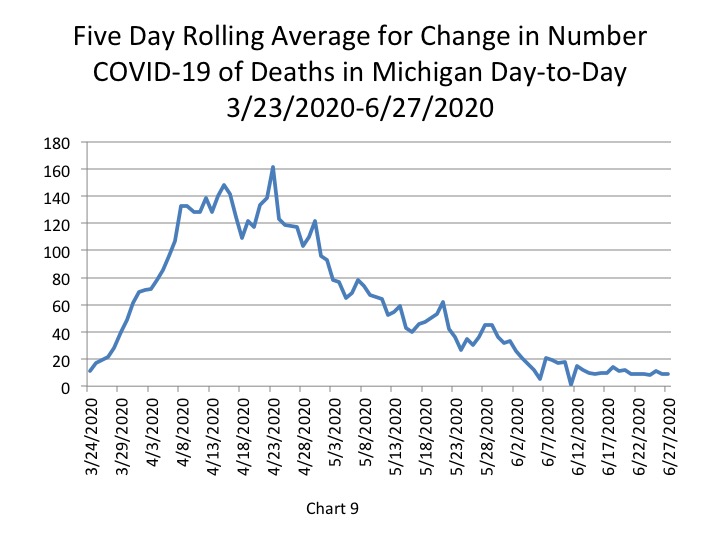
Chart 9, the five day rolling average of deaths, shows the number of new statewide deaths was reported at 9 on June 27. Furthermore, Chart 10 shows how the number of deaths in Southeastern Michigan continues to decline. Detroit and Macomb and Wayne counties each reported 2 new deaths on June 27 and Oakland County reported 1; the other counties in the region reported 0. These numbers are based on 5-day rolling averages.
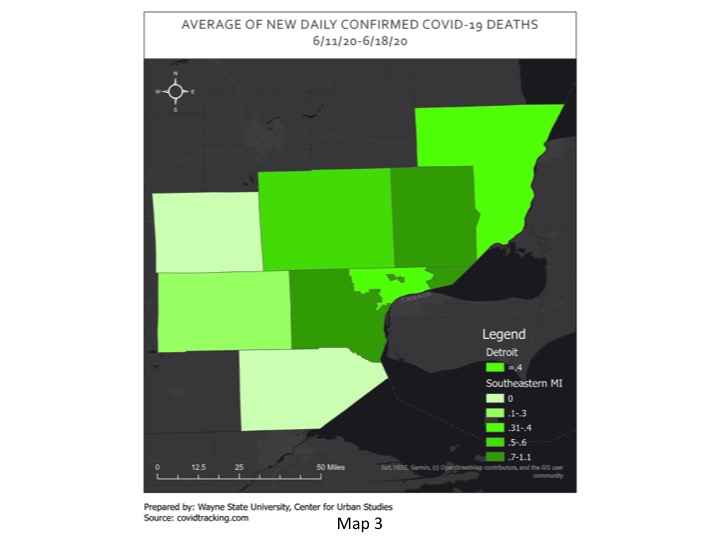
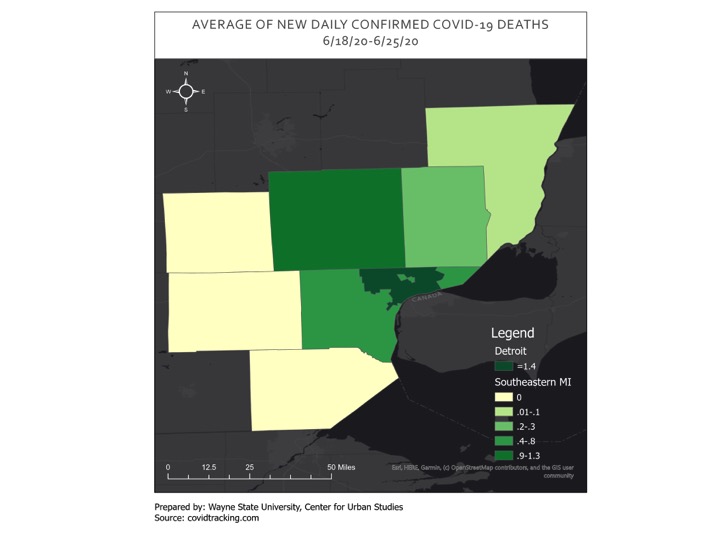
Map 3, below, shows the average number of new deaths for Southeastern Michigan between June 18-25. According to the data, no county in the region other than Oakland County reported even an average of one new death last week. Oakland County reported an average of 1.3 deaths between June 18-25 and the City of Detroit reported an average of 1.4 deaths, which was the highest in the region. Macomb County reported an average of 0.3 death last week while Wayne County reported an average of 0.8.

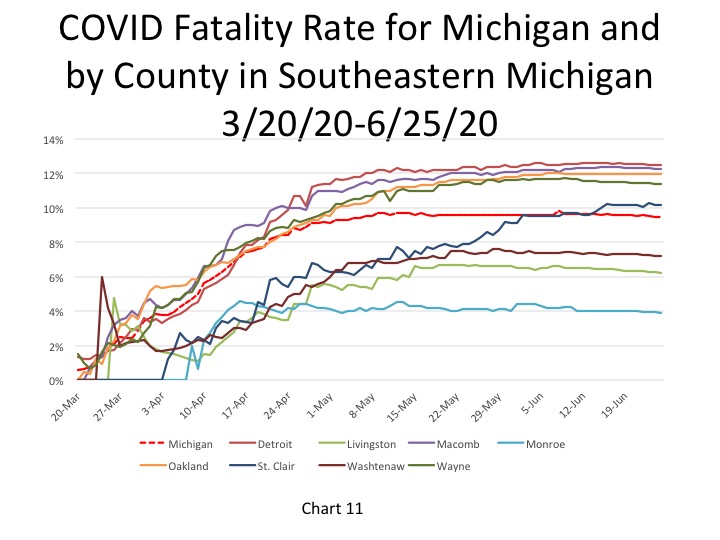
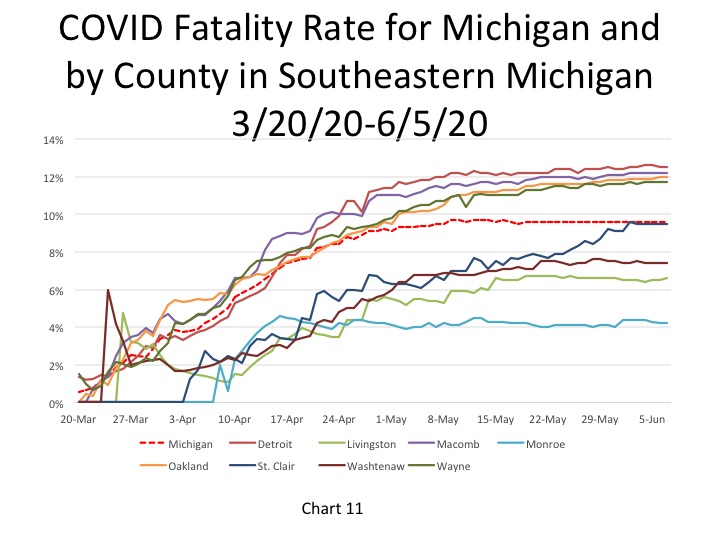
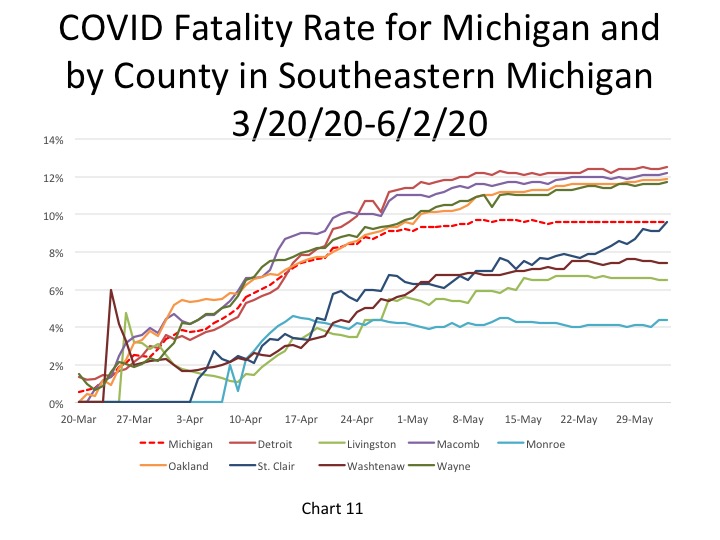
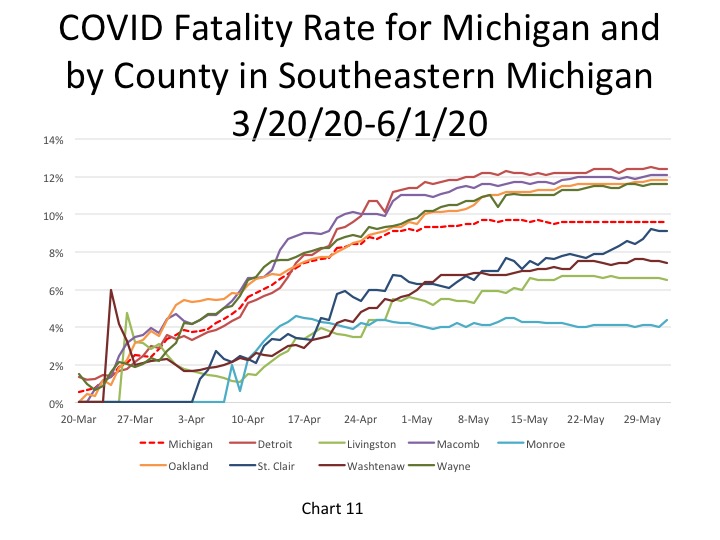
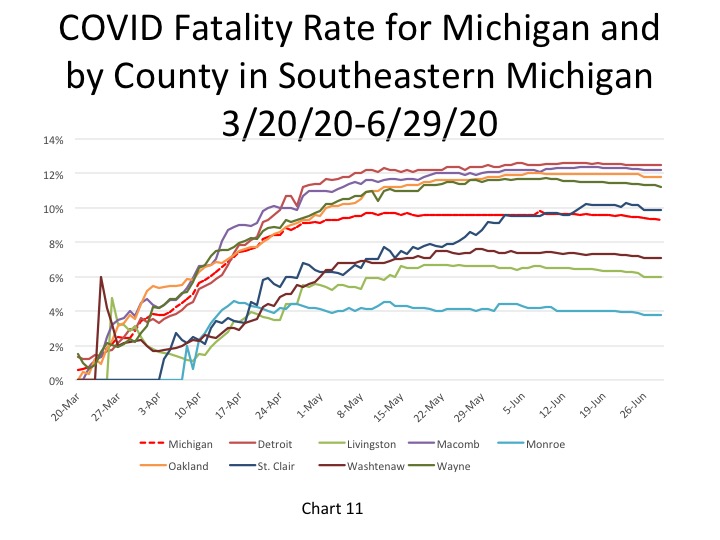
The fatality rates for the State of Michigan and Wayne County are slowly starting to decline while the fatality rates for the City of Detroit and Macomb and Oakland counties have remained stable. Detroit continues to report the highest fatality rate at 12.5 percent while the State’s fatality rate has decreased to 9.3 percent and Wayne County’s rate has decreased to 11.3 percent. To a great extent these numbers are now determined by past totals that dominate the calculations.
The New York Times has created a national map of new daily COVID numbers at the county level, showing how the numbers increase, decrease or remain flat over a 2 week period. As has been shown in this post, counties in Southeastern Michigan-such as Macomb, Monroe, Oakland, St. Clair and Wayne counties-are experiencing a slight increase in new daily numbers. A number of out-state counties are experiencing very large increases. But, as the NYT map shows, counties throughout the country, particularly in the South and Southwest, are seeing large increases in the number of COVID cases. Increases have been linked to people not wearing masks nor adhering to social distancing rules. People are socializing in large groups where few people wear masks showing little regard to health and safety regulations set forth by the Centers for Disease Control. Let’s keep Michigan out of the ranks of states with large increases. Wear a mask and social distance!