Wayne County Experiences Largest Decrease in African American Homeownership

According to data from the American Community Survey, Saginaw County had the highest percentage of African American homeowners of the Michigan counties with more than 10,000 African American households. In 2000, 54 percent of the adult African American population owned a home in Saginaw County. In 2016, 51 percent of the adult African American population in Saginaw County owned a home; this was equivalent to 13,820 households. Overall, there was a 3 percent decrease between the percentage of African American household owners between 2000 and 2016 in Saginaw County. Ingham County also experienced a 3 percent change between 2000 and 2016, from 38 percent to 35 percent, and Washtenaw County experienced the lowest percentage change at 1 percent. In 2000 in Washtenaw County, 39 percent of the African American population owned a home and in 2016 it decreased to 38 percent. It was Wayne County that had the largest decrease between 2000 and 2016 in the percentage of African American homeowners. In 2000 53 percent of the African American population owned a home and in 2016 that decreased to 42 percent. In total in Wayne County, according to the American Community Survey, there were 303,717 households owned by African Americans in 2000 and in 2016 that decreased to 264,759.

According the Urban Institute, where this data was originally presented, the overall percentage of African American ownership in Michigan decreased from 51 percent in 2000 to 40 percent in 2016. Additionally, it was 45-64 age group that experienced the largest loss in homeownership (18%). While the overall loss of homeownership between 2000 and 2016 can be attributed to the Great Recession, the Urban Institute also found that the rise of land contracts and property tax foreclosures contributed to the loss.


Southeastern Michigan Experiences Decrease in Felony Offenders

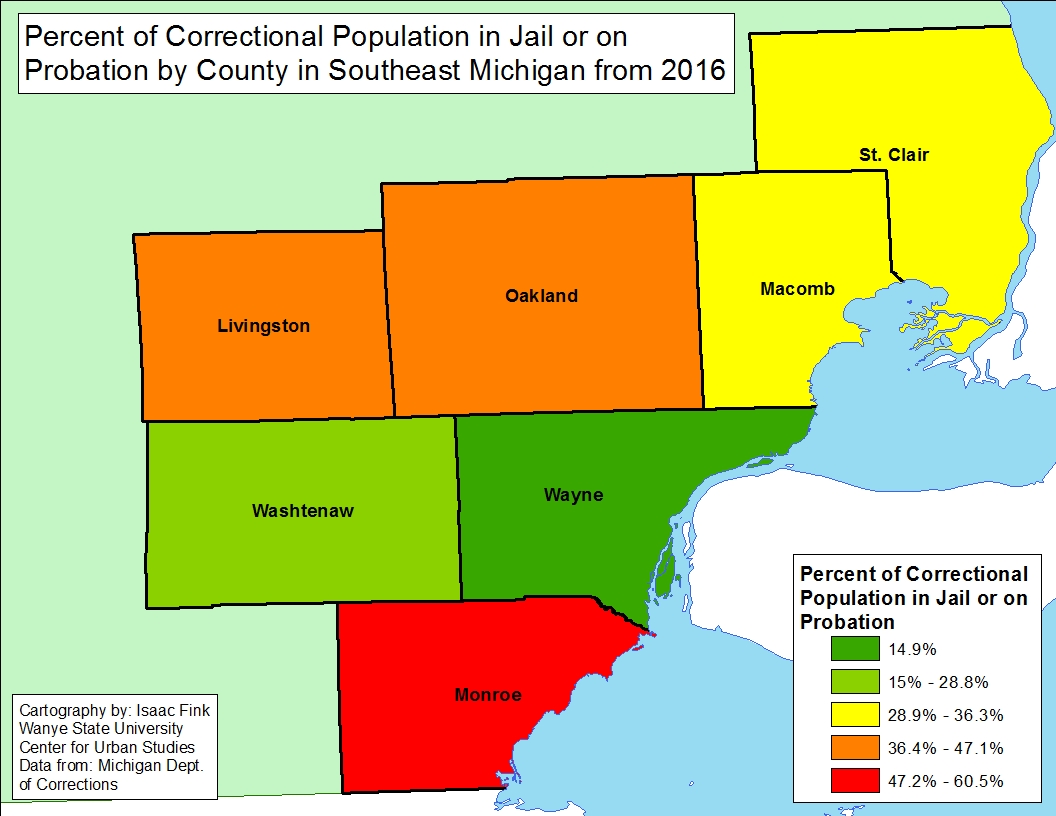
Last week’s blog focused on what sentencing types felony offenders received in 2016 for the Southeastern Michigan region. That information is valuable in understanding if one sentencing type, such as prison, jail or probation, is more common than other regionally and from county-to-county. This, week the data digs further to see if there is any type of trend in sentencing types at the state level and at the county level in Southeastern Michigan. Additionally, the data in this post shows the sheer number of felony offenders who were sentenced in total and to prison or jail between 2012 and 2016. One important note is that those sentenced to prison are sentenced to spend more than a year in jail/prison.

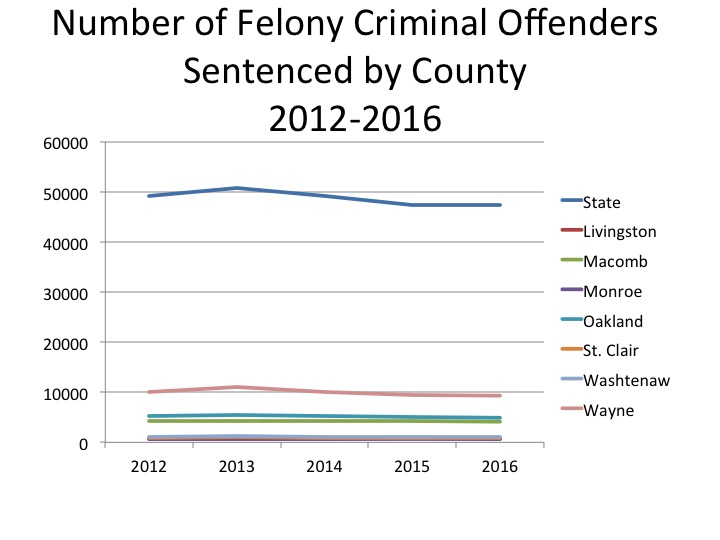
In the first chart below, the data shows there has been a decrease in the number of people charged as felony offenders and sentenced to anything ranging from prison to jail to probation, or even community service. In 2012 there were 49,201 felony criminal offenders and by 2016 that number decreased to 47,347. This is a trend similar throughout Southeastern Michigan, with Wayne County having the highest number of felony criminal offenders and also the largest difference of those being sentenced between 2012 and 2016. In 2012 there were 10,103 felony criminal offenders in Wayne County and in 2016 that number decreased to 9,315. Of the seven counties in the region, Monroe County was the only one to experience an increase in the number of criminal felony offenders between 2012 and 2016. In 2012 there were 631 felony offenders sentenced and in 2016 that number increased to 744. Livingston County has had the lowest number of criminal felony offenders sentenced each year between 2012 and 2016 in the region.

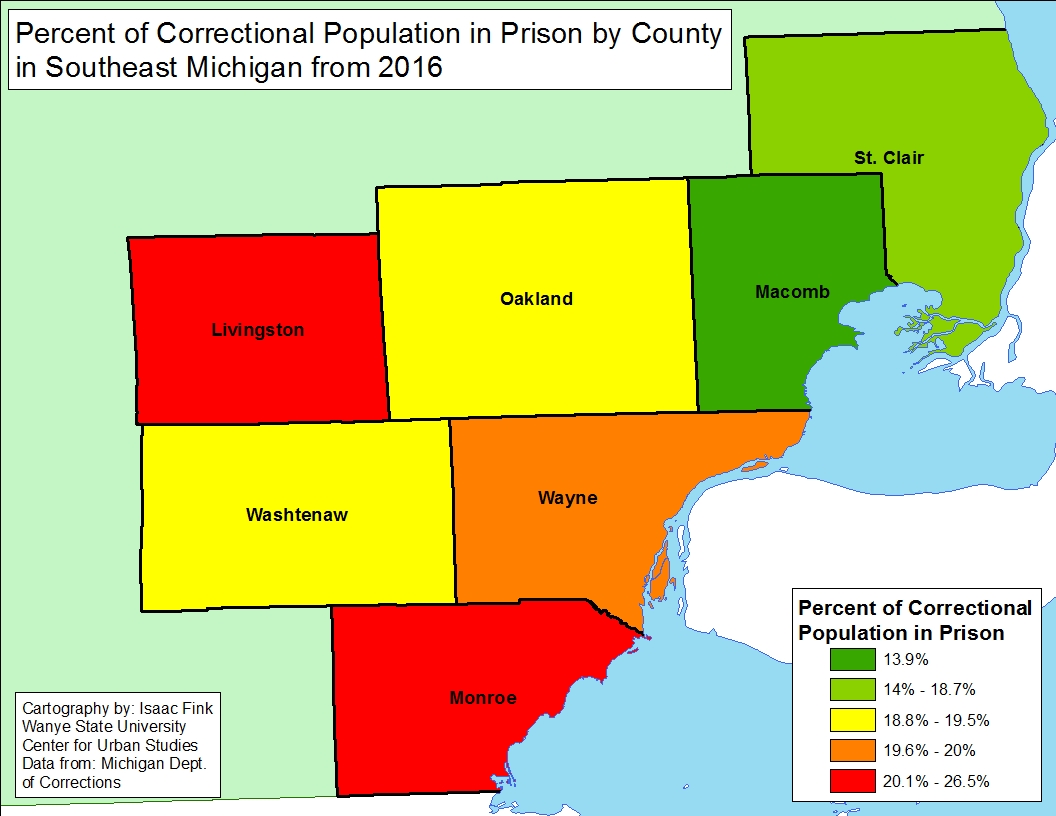
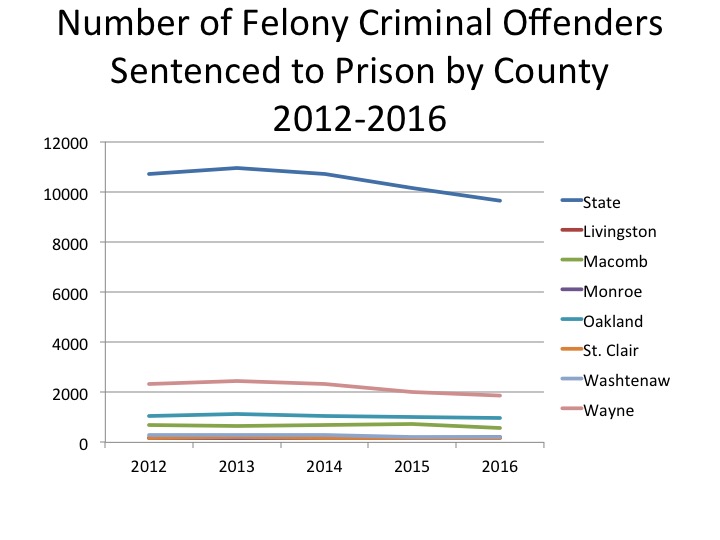
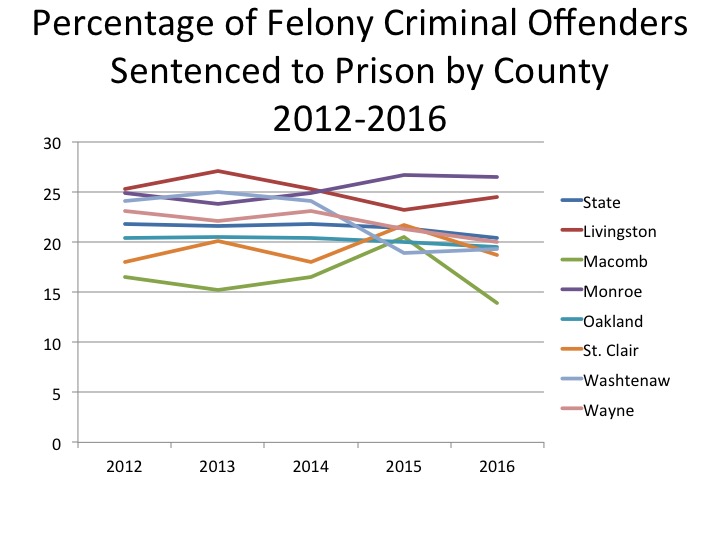
Although there has been a gradual decrease in the number of felony criminal offenders sentenced to prison in Southeastern Michigan between 2012 and 2016 the percentage sentenced to prison has not followed that exact pattern. At the state level, there were 10,732 felony criminal offenders sentenced to prison in 2012, and by 2016 that number decreased to 9,648. On a percentage basis, 21.4 percent of the felony criminal offenders were sentenced to prison in 2012 and in 2016 that number was 20.4. Regionally, Livingston and Monroe counties had the highest percentage of felony criminal offenders sentenced to prison between 2012 and 2016, but by the numbers Wayne County had the highest number of offenders sentenced to prison (2,329 and 1,867, respectively). In 2012, 25.3 percent of felony criminal offenders were sentenced to prison in Livingston County and for Monroe County that number was 24.1 percent. Respectively, those numbers decreased to 24.5 percent for Livingston County and increased to 26.5 percent for Monroe County.

As noted above, Wayne County had highest percentage of felony criminal offenders sentenced to prison between 2012 and 2016, but in terms of the percentage sentenced to prison as opposed to other sentencing options, Wayne County has consistently remained in the middle of all seven counties in the region and has experienced an overall decrease in the percentage sentenced from 23.1 percent in 2012 to 20 percent in 2016. Overall, Macomb County has consistency had the lowest percentage of felony criminal offenders sentenced to prison, with the exception of 2015. Macomb County has also experienced a decrease in the percentage and number of felony criminal offenders sentenced to prison. In 2012, there were 710 felony criminal offenders sentenced to prison in Macomb County, which made up 16.5 percent of felony criminal offenders sentenced that year. In 2016 the number of felony criminal offenders sentenced to prison decreased to 572, and the percentage decreased to 13.9 percent.

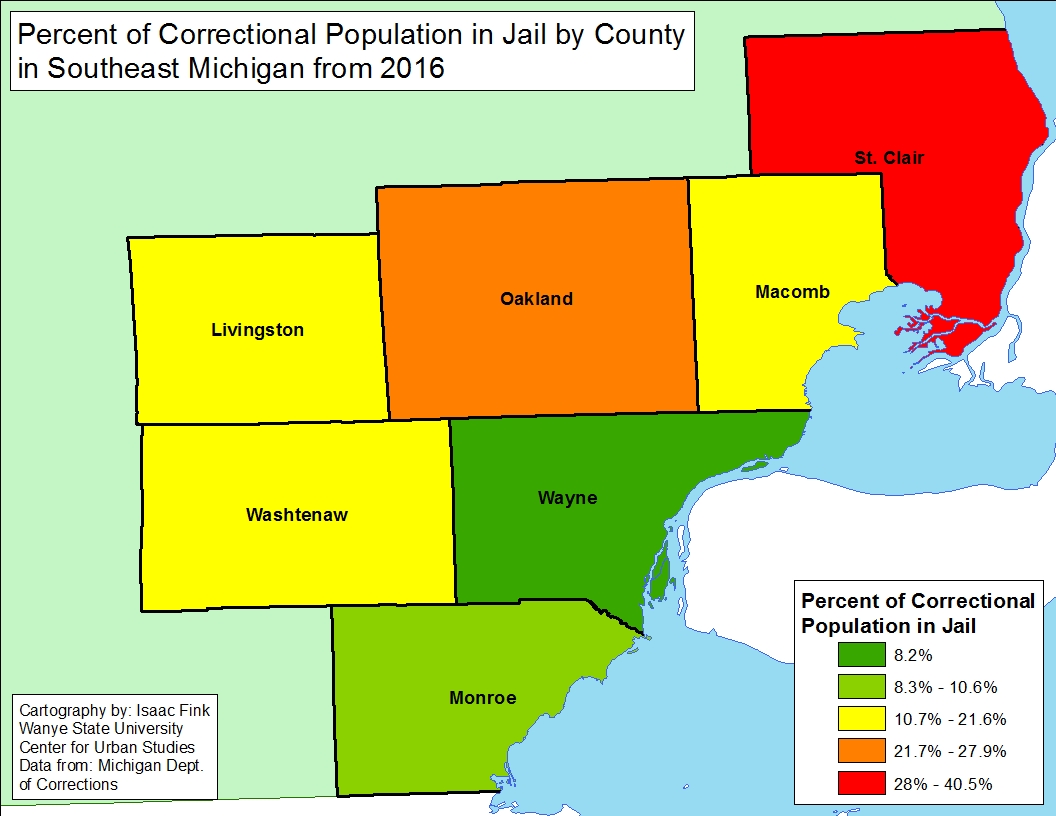
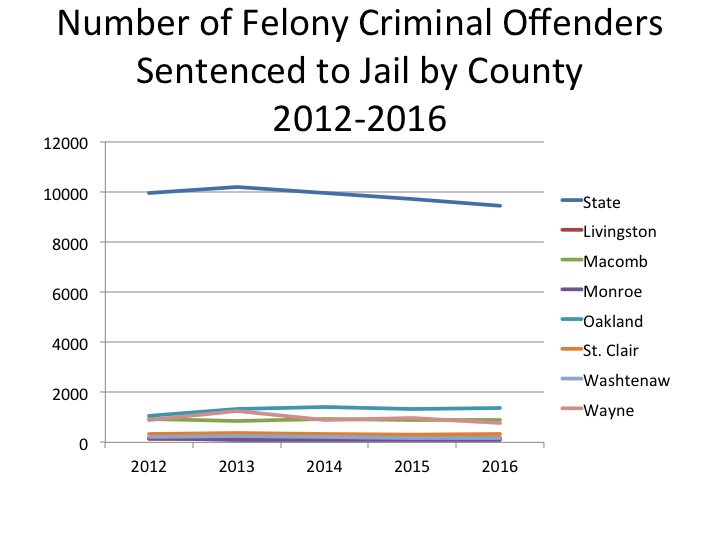
The chart below shows the number of felony criminal offenders sentenced to jail throughout Southeastern Michigan. In 2012 Oakland County there were 1,059 felony criminal offenders sentenced to jail, and in 2016 there were 1,367 felony criminal offenders sentenced to jail. For Wayne County, there were 887 felony criminal offenders sentenced to jail in 2012 ,and in 2016 there were 767 sentenced.

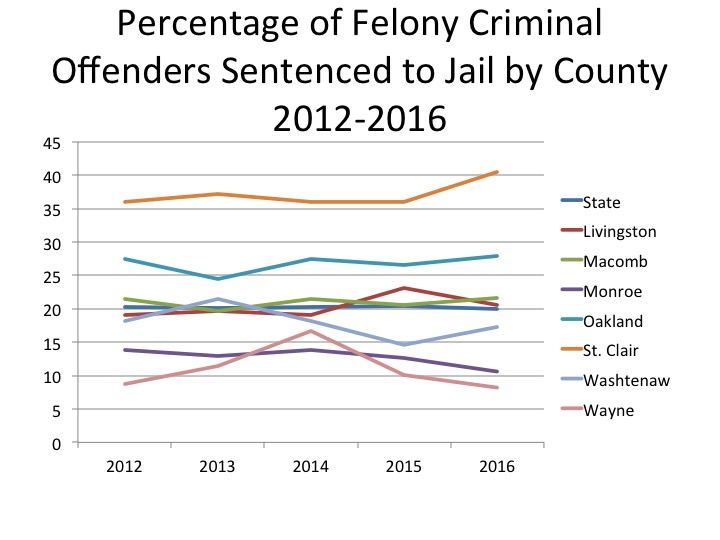
These numbers for Wayne County reflect where the county lies amongst the other counties in the region in terms of the percentage of felony criminal offenders sentenced to jail between 2012 and 2016. As the second chart below shows, with the exception of 2014, Wayne County has the had the lowest percentage of felony criminal offenders sentenced to jail regionally between 2012 and 2016. In 2012 11.4 percent of criminal offenders were sentenced to jail in Wayne County in 2016 that number was 8.2 percent. On the opposite side of the spectrum, St. Clair County has consistently had the highest percentage of felony criminal offenders sentenced to jail out of all seven counties in the region; its number have also been above the state’s number as well. In 2012, 36 percent of felony criminal offenders in St. Clair County were sentenced to jail and in 2016 that number increased to 40.5 percent. Even though the percentage of felony criminal offenders sentenced to jail in St. Clair County is increasing, the total number of offenders sentenced to jail decreased from 908 in 2012 to 840 in 2016.

The above charts focus on the number and percentage of individuals sentenced to prison and jail in Southeastern Michigan, showing that, in general, there has been a decrease in those two sentencing options

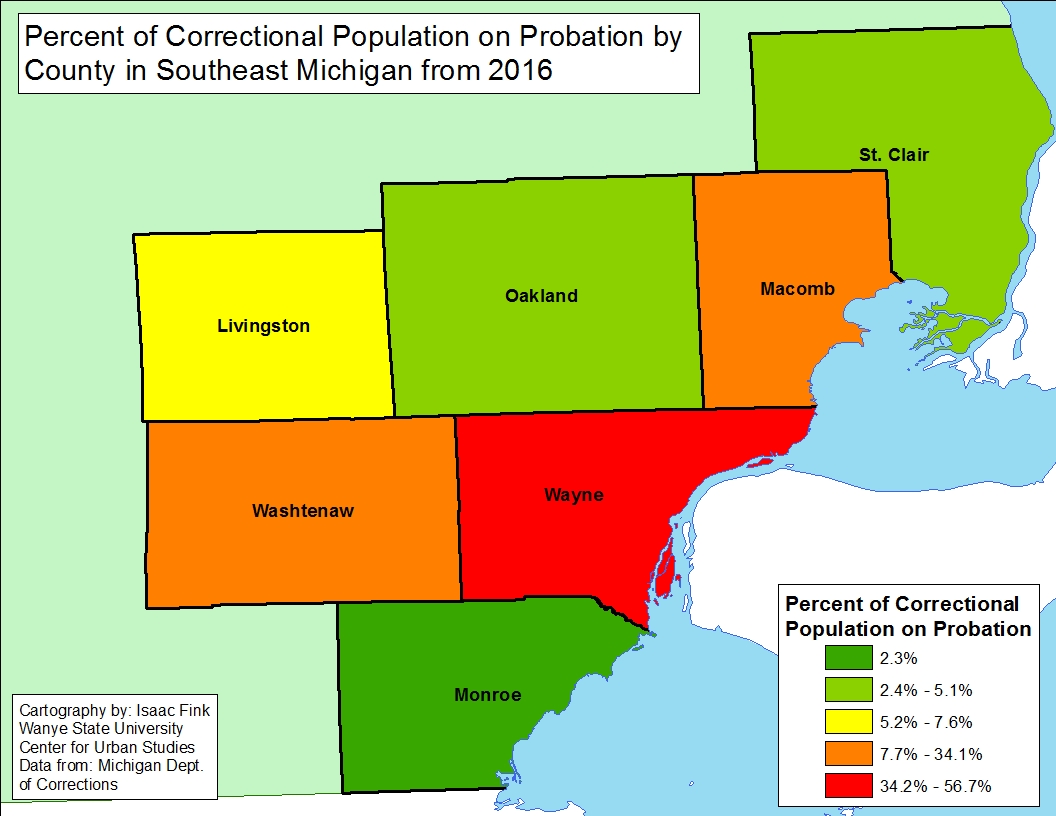
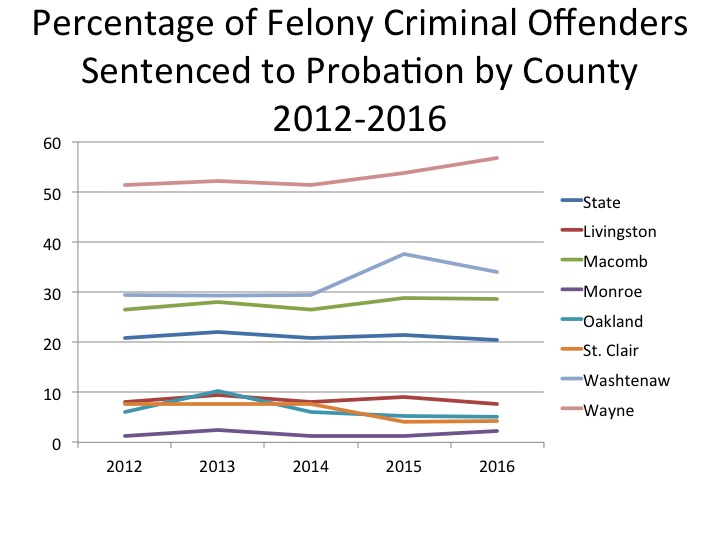
Below, the chart shows the percentage of felony criminal offenders sentenced to probation. Oakland and St. Clair counties experienced the largest decrease in the percentage of felony criminal offenders sentenced to probation. In 2012, 7.6 percent of felony criminal offenders were sentenced to probation in St. Clair County and 6 percent of the offenders in Oakland County were sentenced to probation that same year. In 2016 that number decreased to 4.2 percent for St. Clair County and 5.1 percent for Oakland County. Oakland County has experienced an increase in the percentage of felony criminal offenders sentenced to jail between 2012 and 2016 and St. Clair County has experienced an increase in the percentage of felony criminal offenders sentenced to jail and prison in between 2012 and 2016.

Washtenaw and Wayne counties have experienced the largest increase in the percentage of felony criminal offenders sentenced to probation between 2012 and 2016. In 2012, 29.3 percent of felony criminal offenders were sentenced to probation in Washtenaw County and 52.1 percent were sentenced to probation in Wayne County. By 2016 that number increased to 34.1 percent for Washtenaw County and 56.7 percent for Wayne County. The percentage of individuals sentenced to probation for Wayne County has consistently been the highest in the region.

Overall, this post shows that there has been an overall decrease in the number of felony criminal offenders between 2012 and 2016, and with that a decrease in the number of such offenders sentenced to prison. The percentage of individuals sentenced to prison in Southeastern Michigan has generally decreased as well, with the exception of counties such as St. Clair and Monroe.

Oakland County experienced one of the highest percentage increases in the number of felony offenders sentenced to jail; the number increased too. As these numbers and percentages sentenced to prison increase, they decrease for the number of felony criminal offenders sentenced to probation.

Counties such as Wayne, Washtenaw, and even Macomb, have been using probation more as a sentencing option since 2012 (Wayne is in the upper 50%). By contrast, Monroe and St. Clair use probation for small proportions of offenders–less than 10 percent.   Clearly, the type of sentencing a felony criminal offender receives varies substantially across counties. There could be many reasons for this. It is possible decisions might be related to cost of sentencing an individual to jail or prison and the number of offenders already being housed in a jail or prison. For example, Macomb and Wayne counties have well publicized overcrowding issues at their jails, and Wayne County also has budget issues. This could help explain the trend toward increased probation and decreased jail.


Wayne County Has Highest Percentage of Criminal Offenders on Probation


The Michigan Department of Corrections releases a report annually that details, among other information, the percentage in which felony offenders are sentenced to prison, jail, jail and probation, probation and other (community service, restitution fines and costs) for all offenses, drug offenses and assaultive offenses. The post highlights those breakdowns by county in the seven county region.

When examining the overall breakdown between the five categories above, Monroe County had highest percentage of felony offenders sentenced to prison over any other sentence type. In 2016, 26.5 percent of the felony offenders in Monroe County were sentenced to prison. Livingston County was the only other county in the region where more than 20 percent of felony offenders were sentenced to prison; this number was 24.5 percent. Macomb County had the lowest percentage of felony offenders sentenced to prison at about 14 percent. The largest difference between prison and jail is the length of stay for an offender; traditionally if an offender is sentenced to serve time for longer than a year they are sentenced to prison.

In the jail category for all criminal felony offenders, St. Clair County had the highest percentage of offenders sentenced to only jail at 40.5 percent. Oakland County had the second highest percentage of felony offenders sentenced to only jail time at about 28 percent. Wayne County had the lowest percentage at 8.2 percent. Wayne County also had the lowest percentage of felony offenders sentenced to jail and probation at 14.9 percent. For the jail/probation sentencing category, Monroe County had the highest percentage of felony offenders sentenced to that category at 60.5 percent. Overall, the jail/probation category had the highest percentage of sentencing for all felony criminal offenses in the region, with the exception of Wayne County. According to the data, in Wayne County in 2016 56.7 percent of criminal felony offenders were sentenced to probation; the county with the second highest probation sentencing rate was Washtenaw County 34. 1 percent. Livingston County had the lowest probation rate at 7.6 percent.

The maps below portray for those sentenced for drug offenses the percent of the correctional population in different settings.


When examining only felony drug offenders, St. Clair County had highest percentage of individuals who were sentenced to prison at 16.8 percent. Monroe County had 16.7 percent of its felony drug offenders sentenced to prison. Washtenaw County had the lowest percentage of felony drug offenders sentenced to prison at 4 percent.

For the jail, jail/probation and probation sentencing categories St. Clair County also had the highest percentage of felony drug offenders sentenced to jail at about 44 percent. The county that had the second highest percentage of felony drug offenders sentenced to jail was Oakland County at 33.6 percent. Monroe County had the lowest percentage of felony drug offenders to jail at 11.9 percent and the highest percentage of offenders sentenced to jail and probation at 68.7 percent. Wayne County had the lowest percentage of felony drug offenders sentenced to jail and probation at 15.2 percent but had the highest percentage of offenders sentenced to only probation at 66.5 percent. That sentencing category had the greatest difference between the highest percentage of offenders sentenced to probation and the lowest percentage sentenced. While Wayne County had 66.5 percent of offenders sentenced to probation, only 2.4 percent of felony drug offenders were sentenced to probation in 2016 in Monroe County.

When examining the percentage of felony criminal offenders sentenced for assaultive offenses in 2016, the range in the percentage of individuals sentenced to prison was the narrowest amongst all seven counties. Monroe County had the highest percentage of felony criminal offenders sentenced for assaultive offenses at 41 percent while Oakland County had the lowest percentage at 31.6 percent. The range for those sentenced to jail was a bit wider, with St. Clair County having the highest percentage of felony assault offenders sentenced to jail 35.5 percent. Wayne County had the lowest percentage of felony assault offenders sentenced to jail at 5.2 percent. For the jail/probation sentencing category Monroe County had the highest percentage of offenders sentenced at 48.5 percent and Wayne County had the lowest percentage sentenced at 14.1 percent. While Wayne County had the lowest percentage of felony assault offenders sentenced to jail and jail/probation it had the highest percentage of offenders sentenced to just probation at 41.9 percent. See maps below.

One of the main takeaways from this post is that Wayne County regularly has the highest percentage of offenders sentenced to only probation and the lowest percentage sentenced to any length of a jail stay. The reason for this could be because probation is traditionally less expensive for a government entity than sentencing someone to jail. Capacity issues at county jails could also play a role in this decision. Next week, we will examine how the numbers of offenders in each county in Southeastern Michigan has changed over the years, a set of data that could further support the observations above.

Lake Huron has Highest Number of Beach Advisories/Closures

On July 8, 2018 there were 23 beach closures throughout the State of Michigan, three of which were in the Southeastern Michigan region. These were Newburgh Lake in Wayne County, Fox Lake in Oakland County and the Lake St. Clair Metropark Beach in Macomb County. Thus far in 2018, the Lake St. Clair Metropark Beach has been closed for a total of 25 days due to high bacteria levels, according to the Michigan Department of Environmental Quality (MDEQ). The earliest closure for Lake St. Clair Metropark Beach began on May 31, 2018 and lasted for three days. The most recent closure was announced on June 21, 2018 and it remains closed. According to the MDEQ, advisories or closures are most commonly issued due to elevated counts of E. coli in water samples collected from the shoreline of a water body. Health departments use the daily and 30-day geometric mean to determine if a beach closure or advisory should be issued; for E. coli that average is 300 milliliters. E. coli contaminations often occur from storm water, sanitary sewer overflow and wildlife (such as excrement left from Canadian Geese). Below are three charts showing the number of beach advisories/closures (formally referred to as actions) taken between 2012-2017 on beaches monitored along Lake Erie, Lake Huron, Lake Michigan, Lake St. Clair and Lake Superior. It is important to note that not all beaches along the Great Lakes (and Lake St. Clair) are monitored. Local health departments and non-profits receive federal and state grant funding to monitor beaches. Monitoring must occur on beaches for which grant funding is provided for. The first chart below shows the percentage of monitored beaches across the state that had an advisory between 2013-2017. The highest percentage of actions occurred in 2015 at 25 percent; most recently the percentage of actions reported in 2017 was 18 percent. The 10-year average was 21.5 percent.

When looking at the sheer number of actions by lake, Lake Huron has regularly had the most number of advisory/closures since 2013, according to the Michigan Department of Environmental Quality. In 2017, 18 were reported, a decrease from the high of 29 in 2015.

The final chart below details the number of closures and advisories issued for Lake St. Clair Metropark, due to its regularity of closures compared to other monitored beaches in Southeastern Michigan. As noted earlier, Lake St. Clair Metropark often has a Canadian Geese problem, and it is regularly noted in media outlets that the excrement from these birds contribute to the high E. coli levels in the water samples. To deter the number of geese at the beach, the Metropark has enlisted the help of three dogs to chase away the geese.

As the St. Clair Beach Metropark takes steps to deter a contributor to its closures, the State also began using a rapid testing method to identify E. coli contamination faster. The method identifies and measures E. coli DNA and provides results on the same day it is collected; the more traditional method provides results up to three days later. Currently, according to the MDEQ, there are 12 labs in the state able to perform this method.

More Underfunded Retiree Healthcare Plans than Pension Plans in Southeastern Michigan

In Southeastern Michigan more government entities were found to have underfunded retiree healthcare plans than the number of government entities with underfunded pension plans. According to the data provided by the Michigan Department of Treasury there were 50 underfunded retiree healthcare systems of the 183 government entities that had provided their financial information to the State as of June 9, 2018. A government entity’s retiree healthcare plan is deemed underfunded by the State if it is less than 40 percent funded and has an annual contribution greater than 12 percent of government funds.

Of the municipalities that were deemed funded by the State, Rose Township had the highest funding percentage for municipalities at 331 percent. Other municipalities with retiree healthcare funding above 100 percent are:

Municipalities

  • Rose Township: 331%
  • Groveland Township: 197%
  • Algonac: 163%
  • Oakland County: 127%
  • Detroit: 121%
  • Macomb Township: 114%
  • Royal Oak: 107%
  • Pontiac (Police and Fire): 105%
  • Milford: 104%
  • Farmington Hills: 100%

Special Districts

  • West Bloomfield Public Township Public Library: 147%
  • Brighton Area Fire Authority: 109%

While there was about a dozen different Southeastern Michigan government entities with more than 100 percent of the retiree healthcare plans funded, there were also 37 entities that had 0 percent of the retiree healthcare plan funded. However, not all of these entities were deemed underfunded, rather only 18 were. Not all government entities that fell below the 40 percent threshold were deemed underfunded due to the fact they were contributing less than 12 percent of their revenue to fund the plan. For example, the City of Brighton has 11 percent of its retiree healthcare funded, but according to the Michigan Department of Treasury, the city’s annual contribution to the plan is 10.4 percent of the City’s revenue. This is less than the 12 percent trigger point set by the State.

As with pension systems, funding retiree healthcare systems is vital not only to a government entity’s financial healthy, but also to retention and recruitment of employees.