Union Membership in Michigan Increases

  • The unemployment rate increased at the state level, minimally, and decreased in Detroit (monthly);
  • Union membership in Michigan increased between 2016-2017;
  • Regionally, Washtenaw County’s unemployment rate was the lowest;
  • Housing prices slightly decreased from November to December.

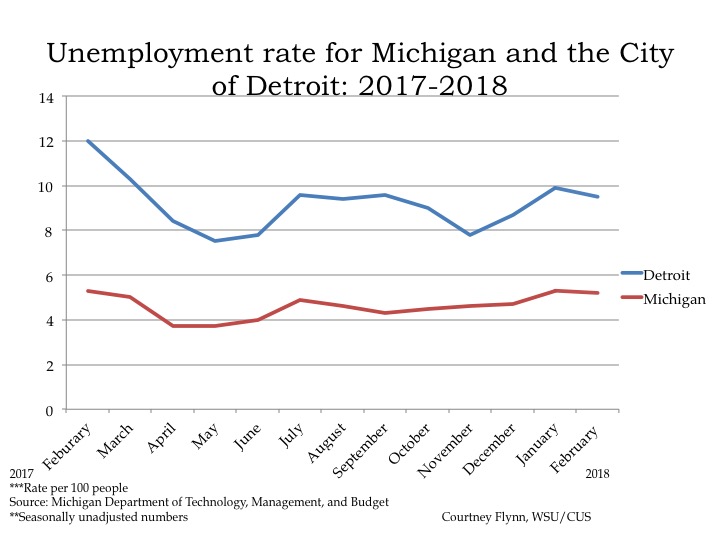
In February of 2018 the unemployment rate for the State of Michigan was 5.2, a slight decrease from the January unemployment rate of 5.3, according to the most recent data provided by the Michigan Department of Technology, Management and Budget. The State unemployment rate for February was 0.1 point below what it was in February of 2017.

The Detroit rate was 2.5 points lower in February of 2018 than in February of 2017. In February of 2018 Detroit’s unemployment rate was reported to be 9.5, this was 0.4 points lower than the month before.

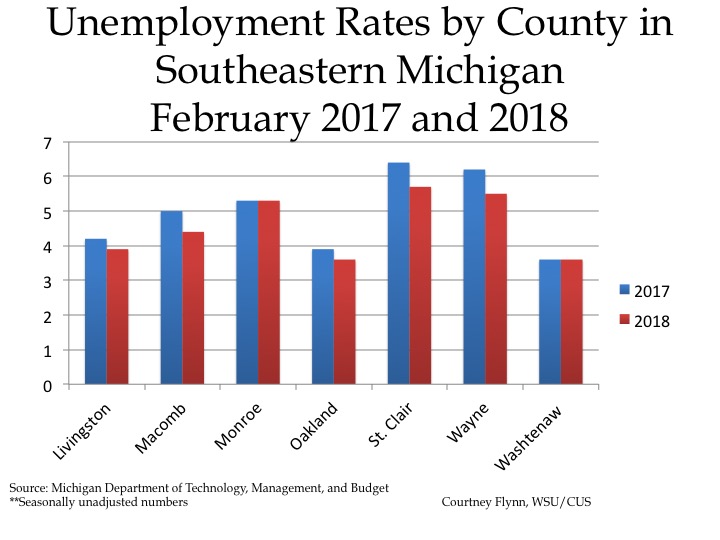
The chart above displays the unemployment rates for each of the seven counties in Southeastern Michigan for February of 2017 and 2018. St. Clair County had the highest unemployment rates for both 2017 and 2018 (6.4 and 5.7 percent, respectively). Washtenaw County had the lowest unemployment rates in 2017 and 2018 during the month of February; Oakland County also had the lowest unemployment rate in the region in 2018. In February 2018 the Washtenaw County and Oakland County unemployment rates were 3.6. In 2017, the unemployment rate in Washtenaw County was also 3.6, meaning there was no change from one year to the next. Monroe County’s unemployment rate also remained unchanged between 2017 and 2018; for both years it was reported to be 5.3.

Wayne and St. Clair counties were the only two in the region with unemployment rates above at or above 5.5 in February of 2018. These two counties also had the largest unemployment decreases between February of 2017 and February of 2018. The decrease was 0.7 for both counties. All counties experienced a decrease in unemployment rates, except for those where the rates remained unchanged.

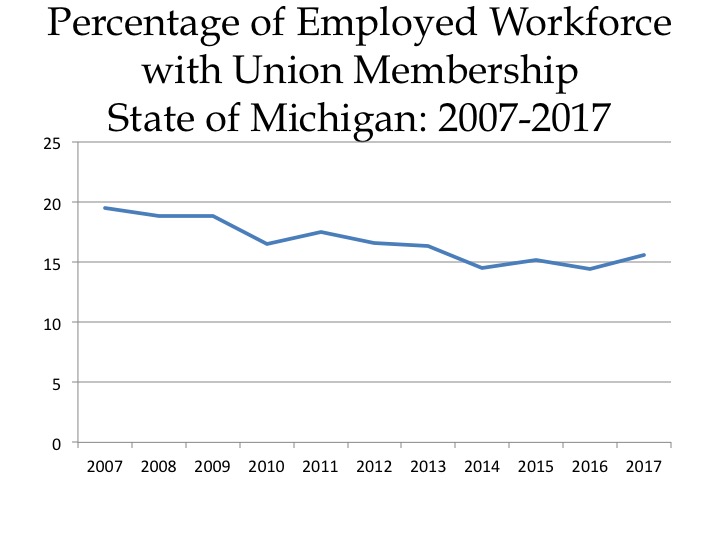
The percentage of the employed workforce with membership in a union increased between 2016 and 2017 in the State of Michigan, according to the Bureau of Labor Statistics. According to the data, 15.6 percent of the employed workforce were members of a union in 2017; in 2016 that number was 14.4. With 15.6 percent of the employed workforce being members of a union, that equated to 658,000 employees; in 2016 606,000 employees were members of a union.

While the total number of union members has fluctuated over the last five years, there has been a significant decrease in the total number of union members since 2007. In 2007, according to the data, there were 819,000 union members, and by 2017 that number decreased to 658,000. The total percentage of the employed workforce that were members of a union was 19.5 percent in 2007. Again, the percentage that was members in 2017 was 15.6.

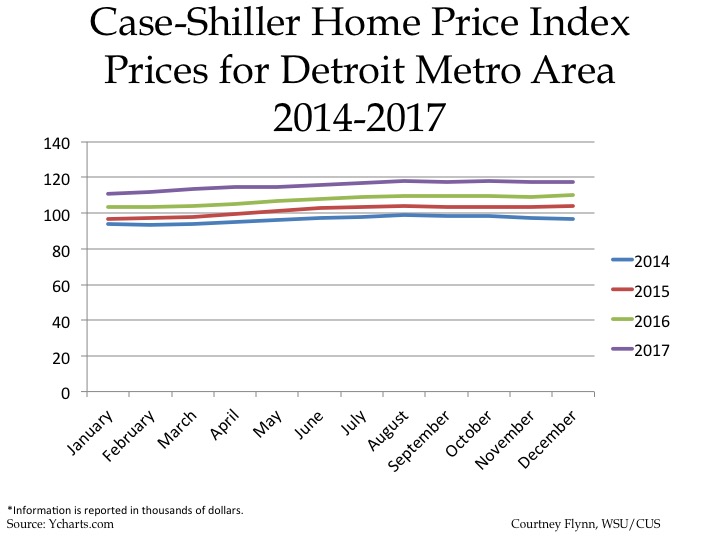
The above chart shows the Standard and Poor’s Case-Shiller Home Price Index for the Detroit Metropolitan Statistical Area. The index includes the price for homes that have sold but does not include the price of new home construction, condos, or homes that have been remodeled.

According to the index, the average price of single-family dwellings sold in Metro Detroit was $117,340 in December 2017; this was $210 lower than the average family dwelling price in November. The December 2017 price was an increase of $7,220 from December of 2016 and an increase of $13,570 from December of 2015 and an increase of $20,360 from December of 2014.

By the Numbers: Michigan Concealed Pistol Licenses

Wayne County has the largest number of Concealed Pistol Licenses (CPLs) in the state, according to the Michigan State Police, but on a per 100 residents (21 years of age or older) it ranks 67 of the State’s 83 counties. According to the data, as of April 2, 2018 there were 109,464 approved CPLs in Wayne County There were 1,254,878 Wayne County residents aged 21 and older. On a per capita basis for the 21 and older population Wayne had 8.72 CPLs issued per 100 residents 21 years of age and older. Keweenaw County, the northernmost county in Michigan, with 15.09 CPLs per 100 residents (21 or older) had the highest rate in the state.

CPLs are limited to those 21 years of age or older, which is why that age was used as the threshold for the per capita maps in this post.

Of the 83 counties in Michigan, the following had the highest number of issued CPLs in the State as of April 2, 2018:

  • Wayne County: 109461
  • Oakland County: 76634
  • Macomb County: 60064
  • Genesee County: 28564
  • Kent County: 23176
  • Livingston County: 16379
  • Washtenaw County: 14543
  • Ottawa County: 14281
  • Clair County: 12897
  • Monroe County: 12389

Of the 10 counties listed above, 9 of them are also on the top 10 list of counties with the highest populations in the State. Accordingly, Wayne, Oakland Macomb counties have the highest populations and the highest number of approved CPLs, respectively.

Below, is a list of the top 10 counties with the highest number of CPLs per 100 residents 21 years of age or older. This list, and corresponding map, shows a more accurate representation of which counties have among the highest percentage of residents with CPLs.

  • Keweenaw County: 15.09
  • Alcona County: 14.34
  • Lapeer County: 13.95
  • Montmorency County: 13.83
  • Luce County: 13.49
  • Dickinson County: 13.22
  • Alger County: 12.92
  • Kalkaska County: 12.9
  • Livingston County: 12.83
  • Missaukee County: 12.55

As the map and list above demonstrates, none of the counties with the highest per capita number of CPLs are located in Southeastern Michigan, with the exception of Livingston County. Four the counties in the above list are located in the Upper Peninsula and another four are located in the northern part of the Lower Peninsula. Wayne and Oakland counties are in the second lowest tier for the number of CPLs issued per 100 residents age 21 and older. In Wayne County there were 8.72 CPLs issued per 100 residents 21 years of age and older as of April 2, 2018; in Oakland County there were 8.81 CPLs issued per 100 residents 21 years of age and older and in Macomb County there were 9.86. The county with the lowest number of CPLs issued per 100 residents 21 years of age and older was Kent County at 5.65.

In 2016 County Gun Boards were eliminated; these bodies had the power to deny an individual a CPL if the license was deemed detrimental to the applicant or others. Now, County Clerks and the Michigan State Police process concealed weapon applications. The data used for this post is from the Michigan State Police.


Majority of Medical Marijuana Shops Close Throughout Detroit

More than 200 medical marijuana caregiver centers have closed throughout the State of Michigan in the last several weeks, the majority of those being located in Detroit. According to data provided by the City of Detroit, as of March 23, 194 medical marijuana caregiver centers have closed in the City in 2018. Of these, 159 of medical marijuana caregiver centers closed between March 15 and March 29; these centers closed following cease and desist letters sent by the Michigan Department of Licensing and Regulatory Affairs (LARA) due to the fact they didn’t apply for licensing through the state. Centers had been allowed to stay open through an emergency rule that was issued in December stating, if the business had approval from the municipality it was located in and applied for the required LARA license. According to multiple media sources, the letters sent by LARA to the 200 plus medical marijuana caregiver centers stated if the centers did not close they would be at risk of not being able to obtain future licensing and/or face consequences from law enforcement.

Currently in Detroit there is a moratorium on new medical marijuana caregiver facilities opening; it went into affect on Feb. 13 and will last for at least six months. Despite the moratorium and closings there are still medical marijuana caregiver centers in Detroit. The first map below shows where all the medical marijuana caregiver centers in Detroit (368) are or were located, including those that have been closed in 2018, and those that are still operating and/or seeking licensing (57 still operating and/or seeking approval and 98 simply seeking approval). While the centers are spread out throughout the City, there were certainly areas with higher concentrations of the centers. For example, right along the northern border of Detroit, 8 Mile Road, there were about 55 medical marijuana caregiver centers. Gratiot Avenue is also heavily lined with medical marijuana caregivers. While majority of centers, both open and closed, are located north of Detroit’s downtown, there are a handful in Detroit’s inner core.

The second map shows the 194 medical marijuana centers that have been closed in 2018. As stated, that is 194 out of 368 in the City (the 368 includes those that are operating, those that are seeking approval and those that are closed). The centers that have closed in the City are not concentrated in specific neighborhood.

There are 13 medical caregiver facilities in the City (shown in the map below) that are operating the closest to compliance as possible, within the expectations of local and state laws, because they have received zoning approval from the City of Detroit and have applied for the emergency licensing described above. According to two initiatives passed on Nov. 7, 2017 in Detroit the Zoning Board of Appeals does not have the authority to review dispensary applications and allows these businesses within 500 feet of several organizations, including religious institutions and other dispensaries. The City has since challenged these initiatives, further confusing the legal operation of medical marijuana caregiver facilities in the City, and the zoning regulations related to them.

In addition to Michigan Medical Cannabis Commission medical marijuana caregiver facilities and those that have closed, there are also the ones that are in the approval process and ones that are in the approval process and still operating. The first map below shows that there are 57 medical marijuana caregiver facilities and/or currently operating in the City of Detroit. While the City of Detroit doesn’t detail what “and/or still operating means,” it is likely related to the facilities that applied for emergency licensing to remain open during the time their new licensing through the state was being reviewed. In addition to the 57 facilities that are seeking licensing and/or still operating, there are an additional 98 medical marijuana caregiver facilities (second map below) seeking approval from the City and the State that are not operating.

In traversing through this issue for this post, it is evident there is still plenty of work to be done at the local and state level to eliminate confusion and allow medical marijuana caregiver facilities to operate legitimately. Like Detroit, other local governments are also trying to navigate through state and local regulations. For example, in Ann Arbor new zoning regulations were approved by the City Council in February. Zoning for four dispensaries in Ann Arbor was then approved, while decisions on two others were delayed. Local officials there too are still learning how to adjust.

Higher Income Households Moving Into Select Neighborhoods in Detroit

The map below is one of the most striking we have produced recently in that it shows the clear concentration of higher income households moving into a relatively narrow range of neighborhoods near Downtown, east along Jefferson and north along Woodward.

It also shows that, with a few exceptions, many of the highest median income Census Tracts in the City of Detroit have amongst the newest homeowners. For example, majority of the Census Tracts along the Detroit River and bordering the Downtown and newer developed areas in the City have median incomes between about $69,000 and $132,000, and the average year of property purchase ranges between 2003 and 2012. The data used in this post is from the 2016 American Community Survey, thus these higher income tracts have an average length of residency between four and 13 years. In the map below, which highlights the average length of homeownership and median income, the earliest average year of homeownership for any one Census Tract is 1980.

Throughout the City’s most eastern and western Census Tracts the median incomes range between about $10,000 and $46,000, the lower two income brackets on the map, but the range of median move in date of homeowners is wide. For example, on the most western side of Detroit, average year of homeowner residency ranges between 1997 and 2012, with the average median income being between about $32,000 and $46,000. As you move further east, toward the central area of the City, the average length of homeownership increases and the average median income, those being in the lower half of the overall range, remains the same. There are of course some exceptions. For example, in the Palmer Park area the average median income ranges between about $70,000 and $132,000 in the Census Tracts and the average year in which a homeowner purchased a property ranges between 1991 and 1996. In Southwest Detroit, homeowners, on average, purchased their properties in 1991 or later, and the majority of the Census Tracts in that area have homeowners with median incomes ranging between $32,000 and $46,000. The Corktown Census Tract does have the same average length of homeownership, but the residents there tend to have higher incomes. Moving east beyond the central area of the Detroit we see similar patterns to the western area of the City. The longest average length of homeownership is located farther from the eastern border of the City, and the most eastern Census Tracts have some of the most recent average years of purchase.

The overall message of the homeownership map is that the Census Tracts with the highest median incomes tend to have some of the City’s newest homeowners, as do some of the City’s Census Tracts with the lowest average median incomes. This paints several pictures, the first being that neighborhoods near, north and east of Downtown are attracting those with median incomes more than two times higher than the overall median income for the City of Detroit ($26,000). Another picture could be that many people with low and moderate median incomes have also had some opportunities to purchase homes, however these homes are located on the outskirts of the City. Or citizens with relatively low incomes are buying homes that were foreclosed upon in the 2008 recession. Finally, the Census Tracts with lowest longest average length of homeownership also tend to have residents with among the lowest median incomes. This could be due to the fact that these homeowners are now retired and living off of Social Security, pensions or other forms of retirement based incomes. This is consistent with our prior posts on the distribution of households receiving government and pension payments.

The map that displays the median income and average length of residency at a property for renters is much different than the homeownership map. As would be expected, the average length of residency for a rental tenant in a particular property is much shorter than that of a homeowner. The earliest average year of renter tenancy for a Census Tract in the City is 2001. There are only three Census Tracts in the City where the average year a renter moved into a property is between 2001 and 2003; the median incomes for these Census Tracts tops out at about $32,000. Overall, the top median income for the renter map tops out at $52,000, furthering the conversation that renters tend to have lower incomes. The west side of the City had the highest concentration of newest tenants (average length of renter tenancy ranging between 2012 and 2014) with majority of the median incomes ranging between $9,000 and $23,000.

The renter map shows that, overall, those who rent tend to have lower median incomes than those who purchase homes and also do not have a tendency to remain in one location for long periods of time.

Overall, this post highlights how those with median incomes more than double the City’s median income are purchasing properties in developing areas of Detroit. However, those with among the lowest median incomes in the City either rent and move around every few years or have owned and remained in their home for well over 30 years.