The following graphics, from the New York Times, summarize the labor market changes nationally since 1980. They make very clear why Michigan and the Detroit Metropolitan area have had such a hard time, given this area’s concentration in two categories–skilled production workers and machine operators and assemblers. Both of these categories have declined precipitously, both in absolute and relative terms. The accompanying article is a useful explanation of the national trends.
Monthly Archives: February 2015
Unemployment numbers decreased with the holiday season
- From October 2014 to December 2014, the unemployment rate across the state and in the City of Detroit’s decreased (monthly);
- The Purchasing Manager’s Index for Southeast Michigan increased from November 2014 to December 2014 (monthly);
- Commodity Price Index decreased from November 2014 to December 2014 for Southeast Michigan (monthly);
- Wayne, Macomb and Oakland counties experienced decreases in the number of monthly building permits pulled.
 According to the most recent data provided by the Michigan Department of Technology, Management, and Budget, the unemployment rate for the state of Michigan decreased from 7.1 percent in October to 6.3 percent in December. During this same period, unemployment in the city of Detroit also decreased from 15.1 in October percent to 12.2 percent.

From November to December of 2014, the number of people employed in the city of Detroit increased by 1,775, leading to a total of 287,228 people employed in December.

The above chart shows the number of people employed in the auto manufacturing industry in the Detroit Metropolitan Statistical Area (MSA) (Detroit-Warren-Livonia) from December 2013 to December 2014. From July 2014 to November 2014 employment in this industry has increased by 9,000 from 91,600 to 100,600. However, from November to December, that number stagnated, remaining at 100,600. This was still the highest it had been over the last year.

The Purchasing Manger’s Index (PMI) is a composite index derived from five indicators of economic activity: new orders, production, employment, supplier deliveries, and inventories. A PMI above 50 means the economy is expanding.
According to the most recent data released on Southeast Michigan’s Purchasing Manager’s Index, the PMI for December 2014 was 64.2, an increase of 7.4 points from the prior month. As compared to December 2013, there has been an increase of 13.6 points.

The Commodity Price Index, which is a weighted average of selected commodity prices, was recorded at 54.2 points in December 2014, which was 7.6 points lower than the previous month and 1.9 points higher than December 2013.


The above charts show the number of residential building permits obtained each month in Oakland, Macomb, and Wayne counties from January 2013 until December 2014. These numbers are reported by local municipalities to the Southeastern Michigan Council of Governments and include single-family units, two-family units, attached condos, and multi-family units.
Oakland, Wayne, and Macomb counties all experienced a decrease in the number of building permits pulled from November 2014 to December 2014. These declines are largely seasonal, due to weather. Only Wayne County issued more permits in December 2014 than it did in December 2013. Oakland County issued 131 permits in December of 2014, a decrease of 10 compared to November 2014 and a decrease of 18 compared to December 2013. Macomb County issued 31 permits in December 2014, 47 fewer than in November 2014 and 52 fewer than in December 2013.
Wayne County issued nine fewer building permits in December than November of this year; in total 52 permits were pulled. This is seven more than the number pulled for the county in December 2013.
Washtenaw County has highest percentage of foreign-born residents
The U.S. Census Bureau defines a foreign-born person as “anyone who was not a U.S. citizen at birth. This includes respondents who indicated they were a U.S. citizen by naturalization or not a U.S. citizen. Persons born abroad of American parents or born in Puerto Rico or other U.S. Island Areas are not considered foreign born.”
In 2012, 12.9 percent of the U.S. population was foreign-born and 6 percent of Michigan’s population was foreign-born, according to American Community Survey. While no county in Southeast Michigan had a higher percentage of foreign-born residents than the entire United States overall, four of the seven counties in the region did have a higher foreign-born population percentage than Michigan.
We saw in a previous post that Oakland County had the highest percentage of refugee residents in the region in 2012. This post shows that Washtenaw County had the highest percentage of foreign-born residents in that same year.

As noted, Washtenaw County had the highest percentage of foreign-born residents in 2012. During that time, 11.4 percent of Washtenaw County’s population was made up of foreign-born residents. Oakland and Macomb counties, which had the largest refugee populations, were the only other counties in the region where more than 10 percent of the population was made of foreign-born residents. In Oakland County, 11.2 percent of the population was foreign-born and in Macomb County 10 percent of the population was foreign-born.
Monroe County had the lowest percentage of foreign-born residents at 2 percent.

We see above that much of the foreign-born population in Washtenaw County resided in and around Ann Arbor. Within Ann Arbor and portions of Scio, Pittsfield and Ypsilaniti we see that the foreign-born population made up 20 percent or more of the population. Throughout the rest of the county though, particularly the west side, the foreign-born population made up less than 5 percent of the population.


Wayne County, which had a foreign-born population of 7.7 percent, had both the municipality with the highest percentage of foreign-born residents and the lowest. The foreign-born population in Hamtramck made up 43.1 percent of the city’s population. Highland Park’s population was only made up of .4 percent of foreign-born residents.
Other municipalities throughout the tri-county region where more than 4 percent of the population was foreign-born were: Detroit (Wayne), Dearborn (Wayne), West Bloomfield (Oakland), Troy (Oakland) and Sterling Heights (Macomb).

In Detroit, where 5.1 percent of the population was foreign-born, the majority of these residents resided in and around Southwest Detroit. In Southwest Detroit, that neighborhood’s population was 47 percent foreign-born. Springwells, West Riverfront, Vernor, Chadsey, Hubbard, and Boynton were other Detroit neighborhoods where 20 percent of more of the population was foreign-born. As we learned in a previous post, much of the foreign-born people living in this area of Detroit are of Hispanic descent.
Opting-Out limits manufacturing employment opportunities for the transit dependent
James Robertson, has been coined Detroit’s “walking man” because of his tenacity in earning a perfect attendance mark at his suburban factory job all while walking nearly 21 miles round trip from Detroit to Rochester Hills. Without a car, Robertson must hobble together a defunct set of bus routes, leaving him no choice but to walk most of the distance into the Detroit suburbs. This story is surely one of many in the Metro-Detroit are, begging the question: Why is the public transit system in the Detroit area far less than mediocre?
Drawing Detroit sets out to illustrate the issue and to discuss how allowing communities to opt out of transit service can limit employment opportunities and create a situation of economic injustice.
Below is a map showing the number of manufacturing employees reported to the 2012 Economic Census of the U.S. Census Bureau in 2012 along with the transit status of communities in Wayne and Oakland counties. Aside from the Detroit Department of Transportation, the only existing transit system that is close being considered somewhat regional is Suburban Mobility Authority for Regional Transit (SMART). SMART has bus lines that run throughout Wayne, Oakland and Macomb counties. In Wayne and Oakland counties municipalities have the option to either opt-in or opt-out supporting SMART, and therefor having it run through their community. In Oakland, the majority of communities-55 percent of 33 of 60- have opted out. In Macomb County, all municipalities support SMART; they do not have the option to opt-out. Because of this, they are irrelevant to the discussion.
Some critics of the Free-Press article on Robertson indicated that there has been little need for low-skill workers in Detroit and other poorer communities to travel into these opt-out communities for employment or otherwise, characterizing these suburbs as bedroom communities with limited job prospects for transit-dependent workers. A quick examination of the map below indicates this is a fallacy. Many manufacturing jobs have moved to the suburbs, following its workforce and also seeking out new facilities and campuses in unsettled areas. Opt-out communities including Oxford Township, Novi and Canton have in excess of 2,000 manufacturing jobs located in their boundaries; Livonia had 9,447 manufacturing jobs in 2012.
In total, 38,461 manufacturing jobs were located in opt-out communities in these two counties, representing 34.1 percent of all manufacturing jobs in the two-county area. Broken down by county, it is 29.6 percent (19,484 manufacturing jobs) of Wayne County’s manufacturing employment and 40.6 percent (18,977 manufacturing jobs) of Oakland’s manufacturing employment.
Median income provide different view of Southeastern Michigan
Various blog posts drawing attention to the income disparities that exist throughout Southeastern Michigan have appeared on Drawing Detroit. This particular post though is more visual in its depiction of income throughout the region at the county and municipal levels. In particular, this post presents the 2013 median household income for the seven counties in the region, along with the municipalities in the tri-county region, in a cartogram form.
A cartogram is a geographic representation method that alters the area and shape of locations, while still preserving their spatial relationships, in order to demonstrate the relative relationship of a data feature. This method allows the cartographer to change the way the map is experienced visually, by applying weight to data, while also maintaining geographic relationships.
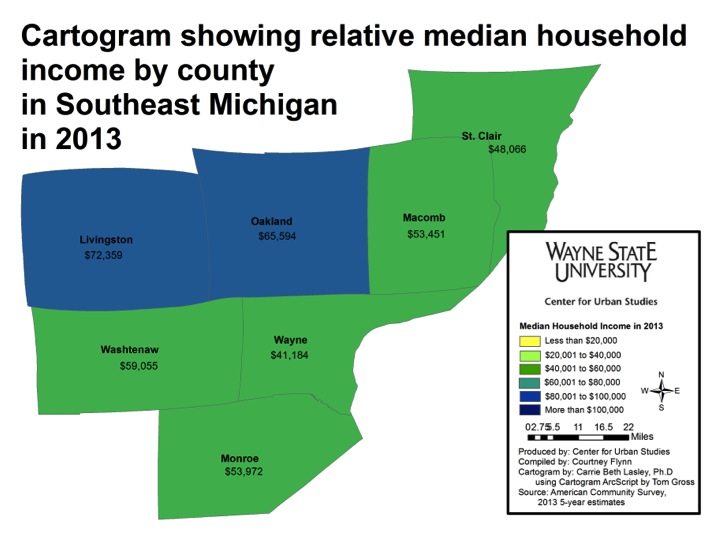
Of the maps presented in this post, the above map is the least skewed in terms of income in relation to the size of the counties. Livingston County, which had the highest median household income in 2013 at $72,359, appears only slightly larger than its size on a normal scale. There is also a noticeable difference in the size of Wayne County, which had a median household income of $41,138 in 2013. This was the lowest median household income of all the seven counties.

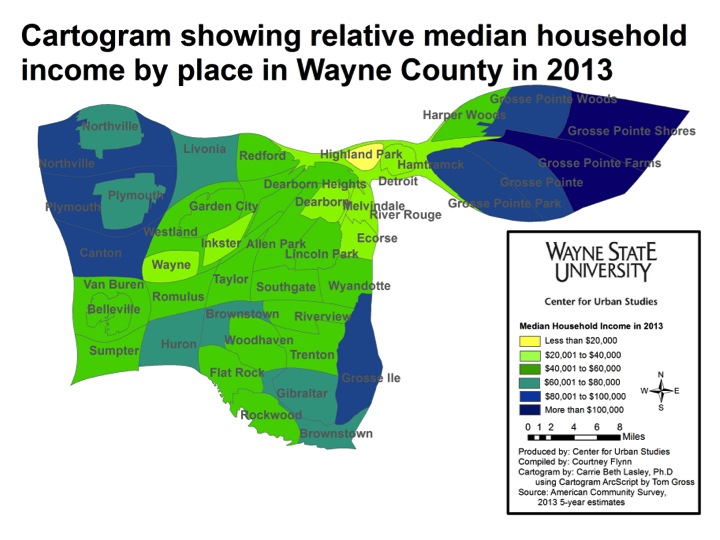
The above two maps truly highlight the income disparities in the tri-county region, particularly in Wayne County. In both maps, the Grosse Pointes stand out as having median household incomes above $80,001. Grosse Pointe Woods ($105,071) and Grosse Pointe Farms ($107,152) had the highest incomes in that area.
In looking at both maps we see that Detroit simply serves as a low-income small connector between wealthy municipalities like the Grosse Pointes and the Plymouth area. Because the size of a municipality in these maps is determined by relative median household income and not geographic size, Detroit, which is the largest city by population in the state of Michigan, does not draw the visual attention it typically would. It has been dramatically impacted by its low median household income of $26,325 in 2013.
Another notable municipality with a high median household income is Lake Angelus in Oakland County. Lake Angelus is only 1.6 square miles but in the above map we see that its median household income makes it larger (in the cartogram) than cities such as Pontiac, Detroit, Warren and Mount Clemens. Lake Angelus had a median household income of $163,393 in 2013.
Other municipalities whose size appears larger in these maps because of their median household income were: Bloomfield Hills ($147,969), Novi Township ($108,125), Plymouth Township ($86,217), Canton ($81,667), Northville Township ($97,161), Grosse Ile ($88,238), and Orchard Lake ($137,321).
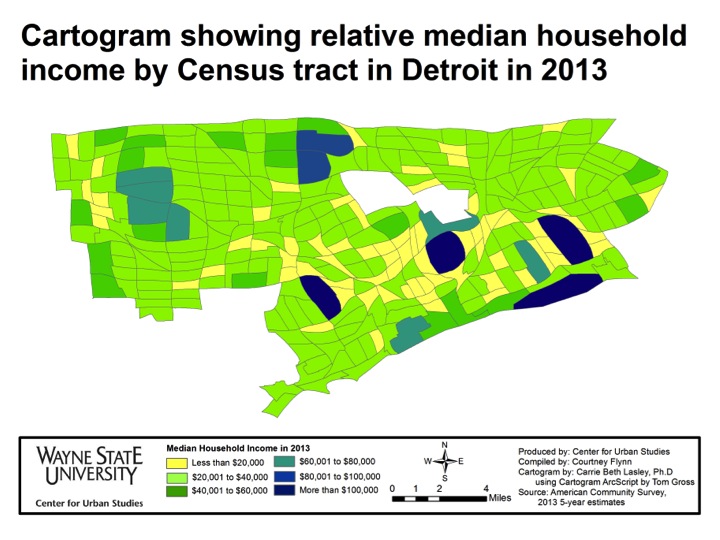
The above cartogram looks at median household income in Detroit by Census Tract in 2013. Areas making less than $20,000 greatly outnumber those making $80,000 or more. Riverview, Midtown, Rosedale Park and Indian Village swell greatly due to their high median income, while areas like Palmer Park and Grandmont-Rosedale also increase in size at the expense of areas like Brightmoor, Briggs, Core City and Poletown.
By viewing a municipality’s size in relation to the median household income we are able to gain a better understanding of where higher household incomes are located in Southeastern Michigan. These maps show that much of the wealth in the region is located in the northeastern and northwestern portions of Wayne County and throughout Oakland County.