Local Road Taxes Help Support Southeastern Michigan Roads

The state of the roads in Michigan are well known to be largely in poor condition, and funding never seems to be at a point to allow for a total overhaul toward long-term improvement. Road funding in Michigan doesn’t come from one dedicated source. Rather, there is federal funding provided by the Federal Highway Administration Highway Trust Fund, state funding provided by state fuel taxes, vehicle registration fees, income taxes, additional appropriations decided on by the Legislature, and local funding provided by general tax revenue and additional road millages. This post shows the communities in Southeastern Michigan that have additional road millages to further improve the roads.

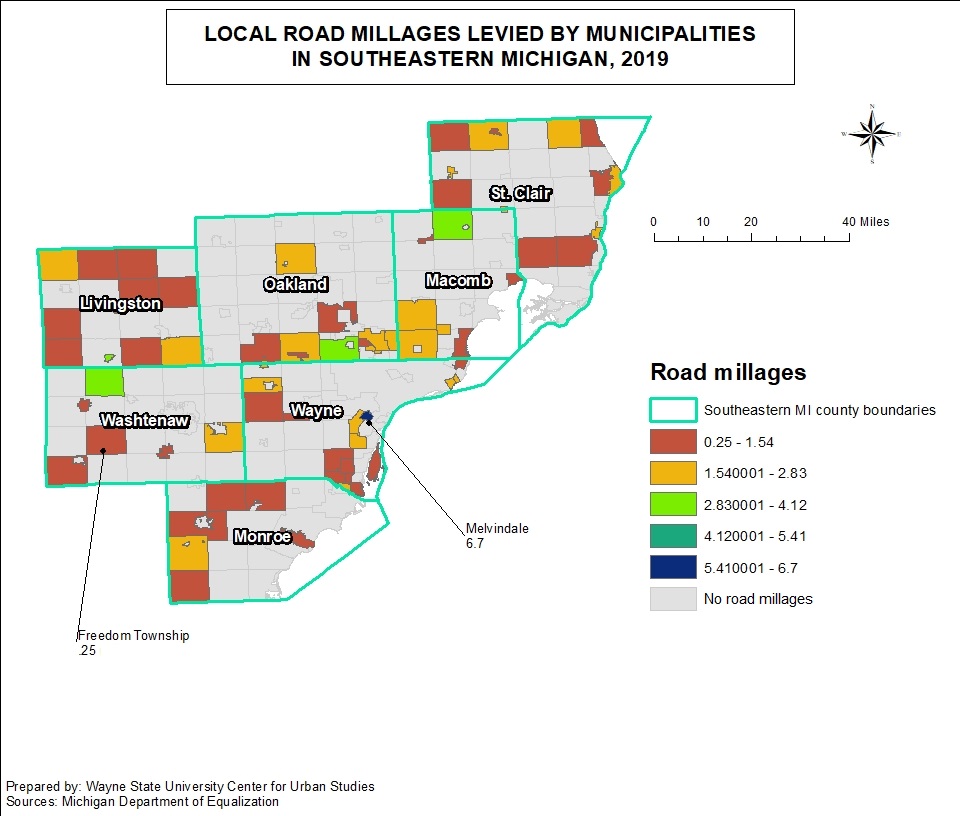
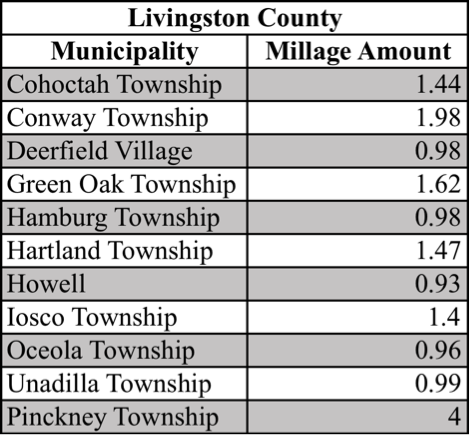
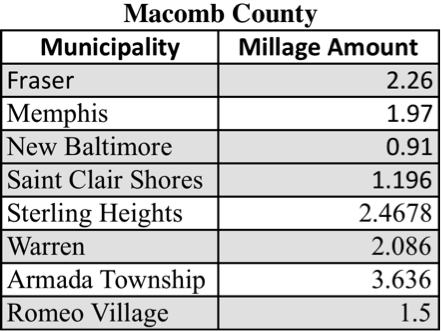
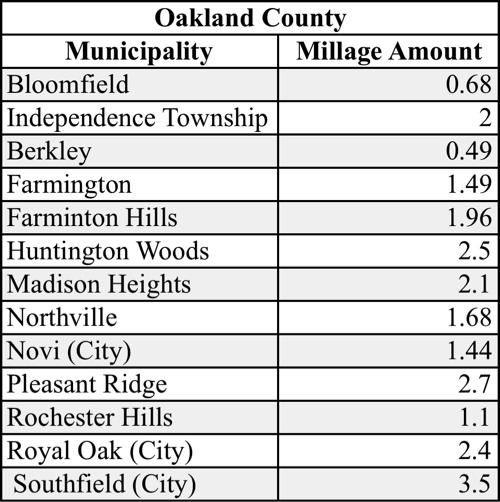
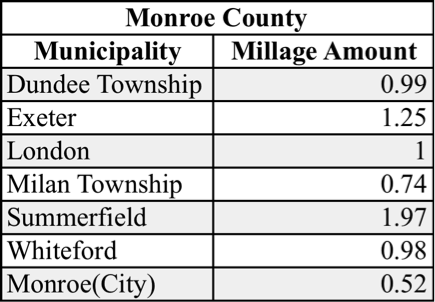
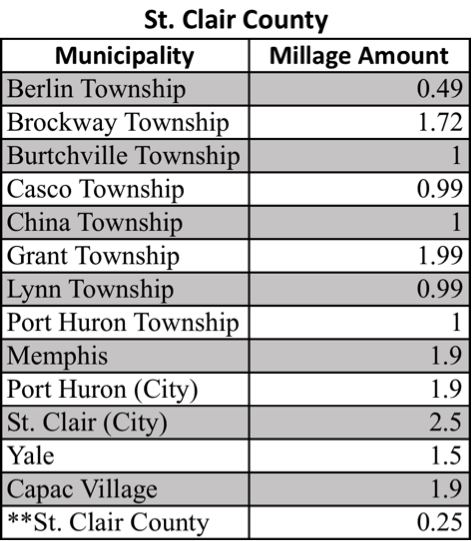
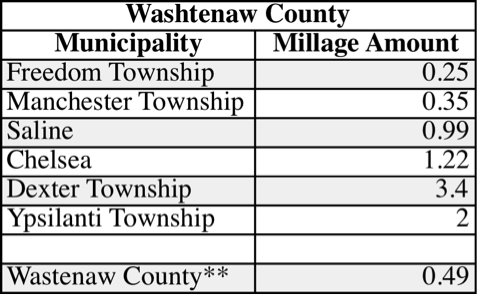
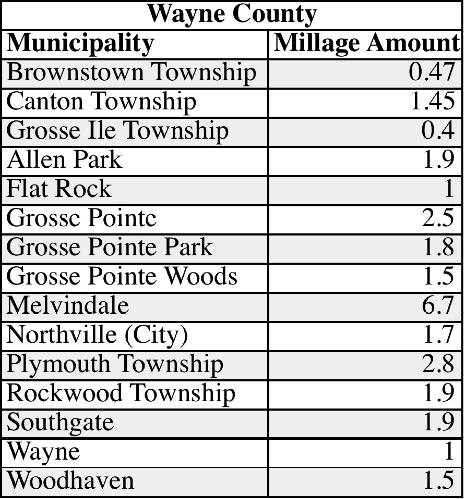
According to the data provided by the Michigan Department of Treasury, there are 73 communities in Southeastern Michigan that levy an additional tax to support road funding, along with two counties. These millages are intended to improve road funding. Of all the communities that levy a road millage, the City of Melvindale has the highest road levy at 6.7 mills, followed by the City of Grosse Pointe and the City of St. Clair which both levy 2.5 mills. The City of Sterling Heights levies the fourth highest amount in the region at 2.47.

Freedom Township and St. Clair County levy the lowest amounts at 0.25 mills each. The only other county in the region to levy a road tax is Washtenaw County which has a 0.49 millage.

Another item to note is that there are more townships levy road taxes than cities and villages. This is likely due to the fact that township roads are controlled by county road departments/commissions, meaning more competition for road dollars.

A mill is a $1 tax per $1,000 of assessed taxable value. For example, a homeowner with a house assessed at $200,000 (true value at $400,000) in a city that levies a 2.5 millage would pay an additional $250 in city taxes. Of course, how much money a community receives in total from a road millage will vary depending on the number of homes in a community along with the average home value of a community.

According to the Mackinac Center for Public Policy there is a strong correlation between improved road conditions and a road millage. According to the Center, 58 percent of roads in a city without a road millage are in poor condition. And, if a city has a road millage, each mill is correlated with a six-point reduction in the percentage of roads in poor condition. This is not necessarily true for villages, where 47 percent of roads in villages without a road millage are in poor condition. This differentiation could be due to the fact that villages typically have less taxable property value, meaning they would need a higher levy to get the dollars needed for more improvement.

Below is a map of communities in Southeastern Michigan that levy a road tax, along with lists to show what communities are making additional investments into their road infrastructure.

Crops Growth Behind Due to Weather

Knee high by the Fourth of July.

That’s how the old saying goes for farmers to measure the success of their corn crop during the summer months. According to the U.S. Department of Agriculture 98-100 percent of corn and soybean crops are planted by the end of June. However, this year, because of wet soil conditions, only 90 percent of corn crops had been planted by June 23, 2019 and about 71 percent of soybean crops had been planted. While nearly all of the corn is planted by now, it does not mean it will be ready for harvesting when typically expected. Right now, a lot looks about ankle3 high, instead of knee high.  As for the soybeans, planting is far below the five-year average, and conditions are declining because of the waterlogged soil.

Given that crop production may be down this year, we took a look at the number of acres planted, aggregate yields last year and bushels yielded per acre in 2018 in Southeastern Michigan. This can  provide a better perspective as to how agriculture affects the lives and economy of Michigan residents.

Regionally, Monroe County had the highest number of acres harvested for corn at 50,500 acres, with Washtenaw County coming in second at 35,000 acres. Monroe, St. Clair, Livingston and areas of Macomb and Washtenaw counties are more rural, with more space for farming. Oakland and Wayne counties tend to be more urban and have the lowest number of acres harvested, along with the fewest number of bushels yielded and produced. Following the trend in which county harvested the most amount of corn regionally, Monroe County also produced the most at 8.5 million bushels of corn and it yielded 168.3 bushels per acre. A bushel is an old measure based on a bushel basket. Wayne County produced the lowest number of bushels of corn at 70,000; it yielded 116.7 bushels per acre.  In terms of the most amount of corn yielded in 2018, St. Clair County had the highest yield at 176.5 bushels yielded per acre of corn planted.


When looking at the amount of soybeans harvested in 2018 regionally, Monroe County again had the highest number of acres harvested at 83,500, and St. Clair County had the second highest at 70,200. Wayne County had the lowest number of soybean acres harvested at 3,000 acres. In terms of production, Monroe County produced the highest amount at 3,765,000 bushels; a bushel of soybeans weighs 60 pounds.  St. Clair County produced 3,150,000 bushels of soybeans and Wayne County had the lowest production rate at 118,000 bushels. When looking at the amount of soybeans yielded per acre each county was within close range of the others. Livingston County had the highest yield rate at 47.7 bushels per acre and Washtenaw County had the lowest yield rate at 43.1 bushels per acre. 


While the majority of crops are now planted there are still many farmers worried about the yield for crops that will be harvested and produced. There are also plenty of farmers relying on crop insurance to ensure some kind of income for the year. According to recent MLive article, the extent of crop insurance claims this year is 13 times higher than last year. As we wait to see what the end result of this year’s corn and soybean crop season is, we also wait to see if the weather patterns of this summer will become a pattern in years to come.

PFAS Regulations to Tighten in Michigan

Per-and polyfluoroalkyl substances (PFAS) are synthetic chemicals (including PFOA and PFOS) found in everything from packaging to cookware. These chemicals are causing environmental and potential health problems, especially here in Michigan. To better track how these chemicals are affecting the environment and public health the Michigan PFAS Action Response Team was created to research, identify, recommend and implement actions to improve the PFAS situation in the State. Part of this research includes testing the waterways and the public water supply. The first map below shows the total PFAS found in treated public water samples throughout the State in 2018. Three counties in Michigan (Washtenaw, Muskegon and Allegan counties) had between 63-78 parts per trillion for PFAS tested in the public water supply. According to the Environmental Protection Agency the lifetime recommended advisory limit is 70 parts per trillion. In Kalamazoo County the amount of PFAS is far higher than the EPA’s recommended intake and any amount found in every other Michigan county. According to the State of Michigan, 5,955 parts per trillion of PFAS was found in Kalamazoo County. It is believed much of this contamination is from old paper mills in the area, a plastics company and a landfill; at least 115 wells and other sources for drinking water were tested.

The second map below shows the total PFAS found in raw water for public water supplies. For this measurement Kalamazoo County was in with the majority of Michigan’s 83 counties where 0-28 parts per trillion of PFAS was found. Of all the counties in the state, Kent County had the highest amount of PFAS found at 140 parts per trillion.  With the exception of the amount of PFAS found in Kalamazoo County’s treated drinking supply, in general, the amount of PFAS found in raw water testing samples was higher than those found in treated public water samples.


Overall, the maps above show that several counties in Michigan have high amounts of PFAS found in public drinking supplies, and in some cases above the EPA lifetime recommendation. As more information about PFAS is discovered that state needs to take actions to prevent further contamination of our water resources by implementing stricter standards. Just recently the Michigan PFAS Action Response Team proposed the lowest parts per trillion thresholds in water supplies in the county. These numbers, which vary depending on the specific PFAS, are still in draft form though and will likely not be formally recommended until October, with enforceable numbers being set by spring of 2020. Once formalized the contaminant levels would be enforceable under the Safe Drinking Water Act.