Ethanol Fueled Vehicles Most Popular Among Those Powered by Alternative Fuels

With alternative energy sources slowly growing more popular for consumption, there are also certain sources that remain popular to fuel vehicles. The U.S. Energy Information Administration provides data on the number of vehicles that are powered by alternative energy sources. Ethanol is by far the most commonly used alternative fuel source used to power vehicles, followed by electric hybrid vehicles. While the use of some of these alternative fuel sources is growing, most of the fuel sources have experienced a decrease in use in recent years.

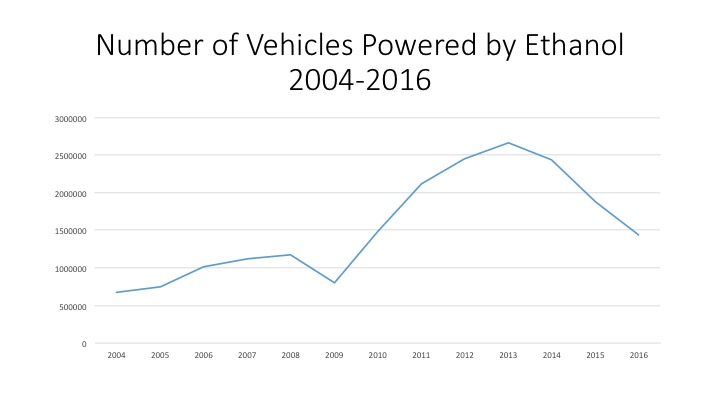
Of the alternative fuels sources the U.S. Energy Information Administration provides information on, ethanol was the most highly used fuel source. Ethanol is a renewable fuel made from corn and other plant materials.

In 2004 there were 674,678 vehicles that used ethanol as a fuel source. By 2013 that number reached its peak at more than 2.6 million vehicles using ethanol as a fuel source. While the number of vehicles using ethanol as a fuel source has declined in recent years ( in 2016 about 1.4 million vehicles used it as a fuel source), it still remains the most utilized renewable fuel source for vehicles.

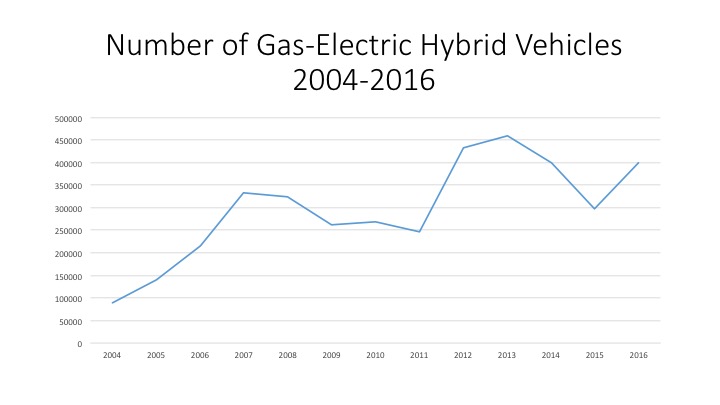
The number of gas-electric hybrid vehicles produced on an annual basis has been increasing since 2004. In 2004 there were 88,272 gas-electric hybrid vehicles and in 2016 that number was 399,367. It was in 2013 when there was the most number of gas-electric hybrid vehicles, that number was 458,994.

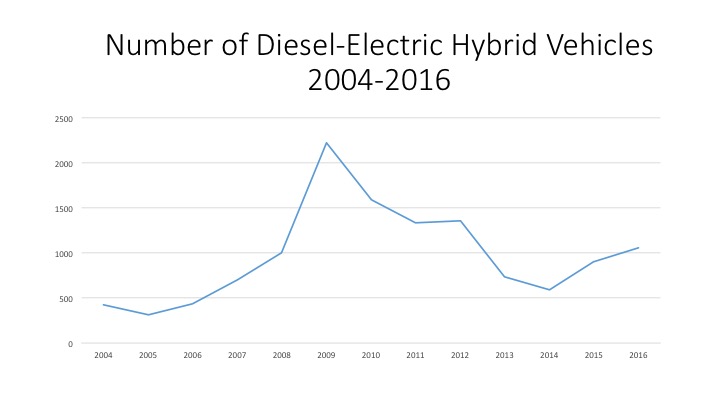
The use of diesel-electric hybrid vehicles has not been as popular and has not grown as much as gas-hybrid vehicle. In 2004 there were 419 diesel-electric hybrid vehicles and by 2016 that number had only grown to 1,053. The number of diesel-electric hybrid vehicles peaked in 2009 at 2,223.

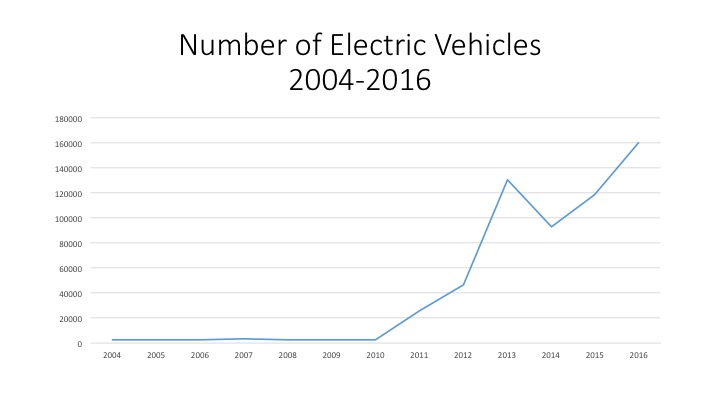
The use of electric vehicles didn’t really take off until 2013 when there was an inventory of 130,323. Between 2004 and 2010 though there were no more than 3,200 electric vehicles each of those years. It was in 2011 when the use of electric vehicles began to take off, and by 2016 there were 160,191 electric vehicles.

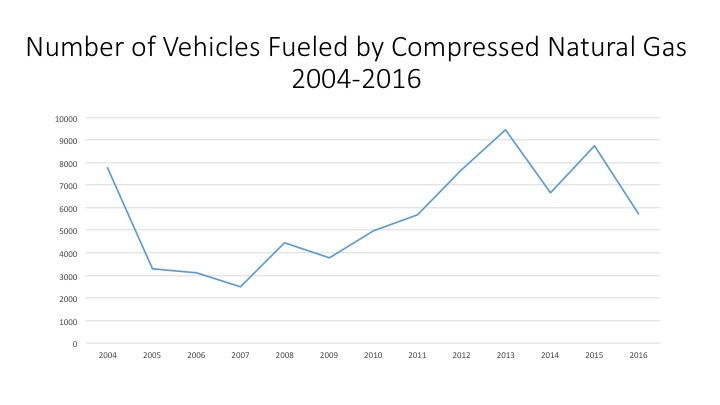
While compressed natural gas is widely available, its utilization as a fuel source falls below many of the other renewable fuel sources available to vehicles. In 2016 there were 5,730 vehicles fueled by compressed natural gas, a number that is below how many there were in 2004 (7,752). It was in 2013 when there was the most amount of vehicles fueled by compressed natural gas, that number was 9,454.

Michigan’s Energy Production Needs to Shift Toward Renewable Sources

While the types of energy consumed in Michigan vary amongst sources, the energy produced in Michigan is much more limited. For example, no coal powered energy is produced in Michigan. Rather, the coal consumed in the state is brought in from other states, particularly those west of Michigan, on railways.

The information provided in this post from the U.S. Energy Information Administration.

At one point, natural gas was the largest energy source in Michigan, reaching its peak production at 312 trillion BTUs in 2000. Since then, the amount of natural gas produced in Michigan has steadily declined. Between 2007 and 2008 the amount of natural gas produced in Michigan declined from 275 trillion BTUs to 162 trillion BTUs. In 2016, 107 trillion BTUs of natural gas energy was produced.

Crude oil production has ranged between 45 and 32 trillion BTUs since 2000, with various peaks and valleys between then and 2016. According to the Energy Information Administration (EIA), Michigan ranks 19th out of the 50 states for crude oil production. In 2016, 32.1 trillion BTUs of crude oil was produced. This is a decrease from the 45.9 trillion BTUs produced in 2000.

Crude oil production in the state comes from reserves; in 2017 about 5.4 million barrels of crude oil were produced compared to the 34.7 million barrels that were produced in 1979. Please note the chart references BTUs, while barrels of crude oil is another measurement used to detail production of this energy source.

Nuclear energy is the energy source that is produced the most in Michigan. In 2016 there were 330 trillion BTUs produced, up from the 200 produced in 2000. There are three nuclear power plants in Michigan, which produce about 30 percent of the electricity used in the state. While there have been some changes in the amount of nuclear energy produced in Michigan, it has remained at around 325 trillion BTU average for the last 15 years.

The amount of renewable energy produced in Michigan, both from biofuels and other sources, has grown since 2000, but none of those sources total the amount of energy produced by the state’s natural gas or nuclear energy sources. For biofuels, in 2002 there was zero energy production by this source. Since then it has increased to 37.7 trillion BTUs. For other renewable energy sources, which include wind, solar and hydroelectric energy, there has been a slow increase in production, with somewhat of a spike in 2014. In 2014 there were 164 trillion BTUs of renewable energy produced in Michigan; in 2016 there were 156.9 trillion BTUs.

The production of renewable energy in Michigan has been increasing since 2000, although there has been a slight decline in such production since 2014. In 2014, 202.2 trillion BTUs of renewable energy were produced in Michigan, and in 2016 that number slightly decreased to 194.6. However, the 2016 production rate is almost double the amount of renewable energy that that was being produced in 2000; in 2000 110.5 trillion BTUs of renewable energy was produced.

In the state of Michigan, the types of energy that make up renewable energy include biomass, solar, wind, geothermal and hydroelectric energy. Despite increases in consumption, carbon-based energy sources are still consumed far more than renewable energy sources.

While the production of carbon-based energy sources in Michigan is far less than the amount consumed, there is still clearly a heavy reliance on these energy sources. Additionally, renewable energy is consumed more in Michigan than produced (click here to view consumption rates in our last post). With carbon-based energy source consumption and renewable energy source consumption both outweighing the amount produced in the state, it would make sense, on multiple levels, for energy policies to shift toward further encouragement, and enforcement, of creating more renewable energy production sources in the state. Not only would such policies mean increased production of clean energy, but it would also mean decreased reliance on carbon-based energy and energy sources produced outside of the state.

Carbon-Based Energy Sources Continue to Dominate Michigan’s Energy Consumption

In the State of Michigan, petroleum is the most highly consumed form of energy, according to the U.S. Energy Information Administration (EIA). In 2016, 881.4 trillion British Thermal Units (BTU)s of petroleum were consumed in the State of Michigan. This number represents a continued increase of usage since 2012, when it was reported that 787.2 trillion BTUs were consumed. Prior to 2012, use of petroleum remained steady between 2000 and 2005 at about 990 trillion BTUs and then began to drop to the 2012 consumption low point. In the context of this post, petroleum represents the use of motor gasoline, distillate fuel oil, residual fuel and jet fuel. The pattern of decline, then resurgence, is one that follows the economic fortunes of the state with the Great Recession followed by a slow climb out of recession since about 2012.

In the State of Michigan, petroleum is the most highly consumed form of energy, according to the U.S. Energy Information Administration (EIA). In 2016, 881.4 trillion British Thermal Units (BTU)s of petroleum were consumed in the State of Michigan. This number represents a continued increase of usage since 2012, when it was reported that 787.2 trillion BTUs were consumed. Prior to 2012, use of petroleum remained steady between 2000 and 2005 at about 990 trillion BTUs and then began to drop to the 2012 consumption low point. In the context of this post, petroleum represents the use of motor gasoline, distillate fuel oil, residual fuel and jet fuel. The pattern of decline, then resurgence is one that follows the economic fortunes of the state with the Great Recession followed by a slow climb out of recession since about 2012.

Next to petroleum, natural gas was the most commonly consumed energy source. In 2016, 675.9 trillion BTUs were consumed in the State of Michigan. This is a decrease from 763.8 trillion BTUS is 2014 and a larger overall decrease of 854.8 trillion BTUs consumed in 2000, this form of energy remains the second most consumed in the State of Michigan. This is not surprising though, as most of the energy produced in Michigan is natural gas. Here though we are discussing consumption.

The consumption of renewable energy sources in Michigan has steadily increased since 2000, with 208.7 trillion BTUs being consumed in 2016. In 2000, 118.4 trillion BTUs of renewable energy was consumed in Michigan.

The type of renewable energy sources consumed in Michigan include solar, wind, hydroelectric, biomass and geothermal energy sources. Wood and waste biomass and wind energy are the type of renewable energy sources consumed the most in Michigan.

Of the renewable energy sources consumed in Michigan, biomass has the highest consumption rate at 85.6 trillion BTUs in 2016, according to the EIA. Biomass includes organic matter such as wood or crop waste. Consumption of biomass as an energy source has been increasing since 2000 when the consumption was 68.9 trillion BTUs.

The consumption of geothermal as an energy source steadily increased from 2000 to 2011, (from 1.2 trillion BTUs to 5.1 trillion BTUs) and has since leveled off, with 5.2 trillion BTUs being consumed in 2016.

Solar and hydroelectric are the lowest consumed renewable energy sources in Michigan. According to the EIA, 1 trillion BTUs of solar energy consumed in Michigan in 2016; this is an increase from the 0.2 trillion BTUs consumed in 2000. The consumption of hydroelectric energy has yet to reach 1 trillion BTUs. In 2000 0.3 trillion BTUs was consumed and in 2016 0.2 trillion BTUs was consumed. These numbers fluctuated between those time frames though, with the highest consumption of hydroelectric energy being in 2003 at 0.8 trillion BTUs. Overall renewables represent a very small, though slightly increasing proportion of energy consumed.

In 2008 Michigan enacted a renewable energy standard that required the state retail electricity providers, such as DTE, to generate at least 10 percent of their energy sources from renewable energy; that requirement has since been increased to 12.5 percent to be met by 2019. According to DTE, their current residential electric fuel mix is made up of 9.8 percent renewable energy sources. In a future post we hope to further explore the electric fuel mix percentages; we are currently inquiring about time series data.

Overall, we see that consumption of carbon-based energy sources such as coal and petroleum have been decreasing over time, while the consumption of renewable energy sources has been increasing at a slow rate. The data presented here tend to indicate that carbon dioxide producing fossil fuels are likely to continue to dominate energy consumption for many decades, unless Michigan policy makers act on the dangers of climate change to the state’s future environment, economy and children.