Hunting Interest Declines in Michigan

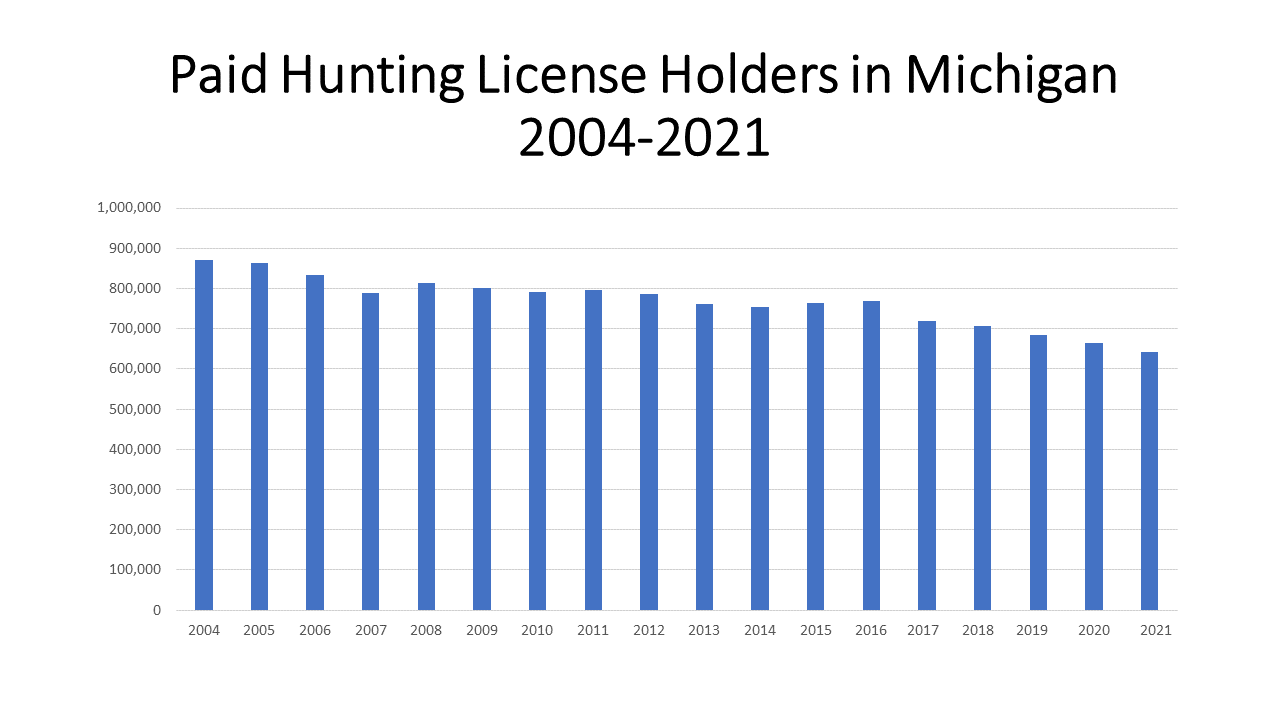
Hunting in Michigan isn’t what it once was, at least according to the data. According to the US Fish and Wildlife Service the total number of paid hunting license holders in Michigan has been on the decline for well over 15 years. In 2004 there were 870,432 paid hunting licenses in Michigan and by 2021 that number declined to 642,242 licenses. These numbers are reflective of all the hunting licenses in the State of Michigan, including those purchased by non-residents of the State. In addition to needing a hunting license to hunt in the State of Michigan tags, permits and other regulatory forms are also needed to hunt certain animals in Michigan; those numbers have been declining as well.

According to a recent article by Bridge Magazine, a large reason for the decline of nearly 230,000 hunters in Michigan is because of a shift in interest. The article quotes Dustin Isenhoff, a Michigan Department of Natural Resources research specialist who tracks hunting participation, who says that many of the State’s avid hunters are aging out of the sport, and many of today’s children don’t have the same interest in the sport.

With the decline of participation in hunting also comes the fear of a decline in revenue. Twenty percent of the Michigan Department of Natural Resource’s revenue comes from fees from hunting and fishing licenses. In 2014 then Michigan Gov. Rick Snyder increased the cost of hunting licenses to increase revenue from an already declining sport. In some cases, the cost of a license doubled; a typical deer license once cost a Michigan resident $15, it increased $31. And, while that has brought on increased revenue there is still the fact the number of licenses being sold is dropping significantly.

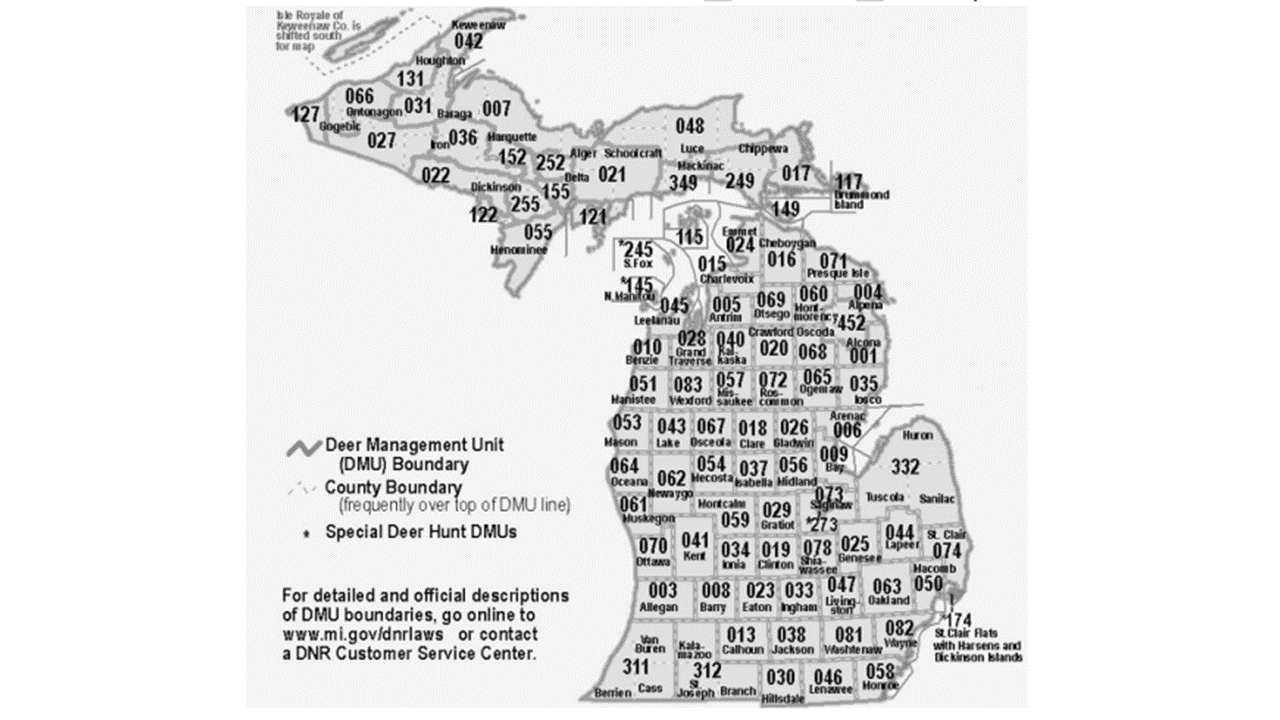
The map below shows the number of deer harvested in each county in Michigan in 2020; these numbers do not include the 9,557 that were taken with deer management permits though (these are specifically used for population control). One notable area with a high number of harvested deer and several designated hunting areas is Van Buren, Berrien and Cass counties in Southwestern Michigan. However, even with all the number of deer harvested combined in the map below, the total number is less than the number of deer harvested for population management, which is also a controversial topic.

Hunting only does so much to control the deer population as it is seasonal and can only take place on designated lands. There are deer culling programs in places like Grosse Ile and Meridian Township, but, as alluded to earlier, these programs often draw strong opposition. An Ann Arbor program was cancelled after years of opposition from residents.

Some consider deer as a nuisance to gardeners and that they drive out certain species due to their overpopulation and often are a hazard to drivers in certain places. Others note that the natural predators to deer, including coyotes and cougars, were eliminated in most places in Michigan, although the coyote population is now rising.

The issue of deer hunting and population control is one that is complex and requires a delicate balance. Some call to open more public hunting land in Southeastern Michigan to allow for easier access to the sport and to better control the deer population where numbers are growing due to less space for them to live. However, the risks to hikers, cyclists and other users of open space is significant as well.

Between 2010 and 2018, 16 deaths and 86 non-fatal injuries were linked to hunters’ weapons, according to Michigan Department of Natural Resources reports analyzed by Bridge. In 2015 and 2016 there were not any hunter deaths reported; these were the only two years, at least since 1970, when that happened.

The $100K Home May Soon be a Dream of the Past in Southeastern Michigan

Housing prices continue to soar in the Metro-Detroit region, and beyond.  According to the Case-Shiller Home Price Index, the average price of single-family dwellings sold was $154,160 in July of 2021; this was $1,560 higher than the average family dwelling price in June. Furthermore, the July 2021 price was an increase of $21,700 from July of 2020 and $56,030 from July of 2014. This means, that the average single-family dwelling was being sold for under $100,000 in 2014. The data below shows how pressed a homebuyer would be to find a home for such a price in 2019 (most recent American Community Survey), meaning it is even more difficult today.

According to the 2019 ACS data, Wayne County had the highest percentage of owner-occupied units that were valued at less than $100,000 at 44.8 percent. The percentage of owner-occupied homes valued at less than $100,000 available in Wayne County in 2019 was 24 percent less than what was available five years prior (2014). Wayne County experienced the smallest decline in owner-occupied units valued at less than $100,000, while Oakland County experienced the largest. In 2019, 12.5 percent of the owner-occupied units in Oakland County were valued at less than $100,000. That number is a 47 percent decrease in the percentage of owner-occupied units valued at less than $100,000 in 2014—five years prior.

While Oakland County had the largest decline in the percentage of owner-occupied units valued at less than $100,000 between 2014 and 2019, it was Livingston County that had the smallest percentage of owner-occupied units valued at less than $100,000 both in 2014 and 2019. In 2019, 8 percent of Livingston County’s owner-occupied housing stock was valued at less than $100,000 and in 2014 it was 14 percent (still the lowest in the region).

Overall, the data shows some of what we already know—particularly that housing prices continue to increase, and at a more rapid rate than in previous years. However, we also know that wages are not increasing with the rate of inflation, and for many, with the rate of increased home prices. As affordable housing continues to remain an issue, it is important to understand where those gaps are also growing at an increased rate. The data shows that, regionally, Wayne County had the largest percentage of homes available for under $100,000, with the number available decreasing at the slowest rate.

Food Prices Increase with Inflation, Food Plans Don’t Add Up

Food prices are one of the many goods and services increasing along with the rate of inflation. These food price increases are being driven up by the increased cost in oil and transportation, worker shortages and weather patterns that have been negatively impacting crops. These factors combined bring a direct impact on the wallets of all of us. Food and beverages are necessities to live, but as prices continue to rise while wages remain stagnant in many industries, access to these necessities may continue to grow more difficult for many families.

According to the U.S. Department of Agriculture (USDA), the average monthly food bill for a family of four on the department’s “thrifty food plan” was $848.40 in September of 2021. In September of 2020, the average monthly bill on the same plan was $676.70. The thrifty food plan is one of four food plans USDA develops that estimate the cost of a healthy diet across various price points – the thrifty, low-cost, moderate-cost and liberal food plans. The thrifty food plan is the lowest cost of the four. It represents the cost of a nutritious, practical, cost-effective diet prepared at home for a family of four, which is defined in law as an adult male and female, ages 20-50, and two children, ages 6-8 and 9-11.

The “liberal food plan” provides broader suggestions for a healthy diet with more leniency in price too. According to the USDA, an average monthly grocery bill for a family of four on the “liberal plan” was $1,339.80 in September of 2020 and was $1,353.90 in September of 2021. Both examples show how food and beverage prices have certainly gone up over the last year, but comparing the thrifty and liberal average grocery bill also shows that there was a greater increase in price for those adhering to a more thrifty plan, as opposed to a liberal plan.

Examples of how grocery money should be spent, according to the USDA, for each child on each food plan are as follows:

Thrifty food plan:

•1.70 lbs of whole grain breads, rice, pasta, or pastries

•0.07 lbs of whole grain cereals

•No popcorn and other grain snacks

•0.76 lbs of non-whole grain breads, rice, pasta, pastries, cereals, or flours

Liberal food plan

•1.37 lbs of whole grain breads, rice, pasta, or pastries

•0.07 lbs of whole grain cereals

•0.46 lbs of popcorn and other grain snacks

•1.46 lbs of non-whole grain breads, rice, pasta, pastries, cereals, or flours

Those on the thrifty food plan are being encouraged to eat more breads, rice and pasta, likely because of their traditionally lower costs for these sometimes nutrient dense food sources.

These difference in cost increases between the two plans and the type of foods families are encourages to eat further highlights how if a certain food group experiences a large increase from one month to the next meal times for families could drastically change.

The thrifty food plan is used to determine Supplemental Nutritional Assistance Program (SNAP) benefit amounts, which vary by household size. By law, the cost of the thrifty food plan in June sets the maximum SNAP benefit amount for a household of four people for the following fiscal year (October 1 through September 30). While the June thrifty food plan suggestions determine the maximum SNAP benefits for a fiscal year, food prices vary on a month-to-month basis, as do the cost of other goods and services.

The Consumer Price Index (CPI) is a measure which helps show how the costs of goods and services change on a month-to-month and a year-to-year basis. The CPI has been increasing nationally and in the Midwest region for the past year, with goods and services such as housing, transportation and fuel all increasing. As already noted, food and beverage prices have also been increasing in recent months, a noticeable change many of us see at the grocery store and in our wallets.

The first chart below shows how food and beverage prices by certain categories changed between September of 2020 and September of 2021, according to the Bureau of Labor Statistics. The highest CPI change in the food and beverage category has been for meat, poultry, fish and eggs. In the last year prices have increased by 10.5 percent. The non-alcoholic beverage category saw the second highest annual increase of the categories shown at 7.4 percent. Cereal and bakery products increased the least at 2.4 percent.

The second chart below shows how food and beverage prices changed between August and September of 2021. Meat, poultry, fish and eggs again had the largest increase at 2.4 percent, followed by non-alcoholic beverages with a 1.4 percent increase. Fruits and vegetable prices, on average, decreased 0.2 percent.

Price increases directly affect families, especially those utilizing assistance programs. For many, a few dollars can mean the difference between some extra groceries, or even a healthier option. In Wayne County alone there were 133,170 households who used SNAP benefits in 2019, and a monthly shift in pricing directly impacts what and how much these families may eat.

According to the US Census Bureau, in Southeastern Michigan, Wayne County had the highest percentage of households utilizing SNAP benefits at about 14 percent, followed by 12 percent of St. Clair County households utilizing the benefits and 11 percent of Monroe County households.

Increasing food and beverage prices is just one of many factors that could drive up the percentage of people in poverty, and drive those in poverty even deeper into it. As noted, increasing food prices are related to increasing costs of transportation (gas), worker shortages and supply and demand. Increasing prices for gas will impact more than just food and beverages too, meaning this is just another area in which the dollar won’t stretch for many Americans. With wages not keeping up with the price of inflation (Michigan’s minimum wage has remained at $9.65 for 2021) or not growing closer to being a “living wage”, many may have to chose between meals, gas and heat and electricity in the coming months.