Number of employed drops in Detroit

•From November 2013 to December 2013, the unemployment rate across the state decreased while in Detroit it increased; (monthly)
•The Purchasing Manager’s Index for Southeast Michigan decreased from January 2014 to February 2014; (monthly)
•The Commodity Price Index decreased from January 2014 to February 2014 for Southeast Michigan; (monthly)
•Standard and Poor’s Case-Shiller Index shows that the prices of homes in the Detroit Metropolitan Statistical Area experienced an increase between December 2012 and December 2013; (monthly)
•Wayne County has experienced an increase in the number of building permits pulled in 2014 compared to those pulled in winter of 2013.
Slide02

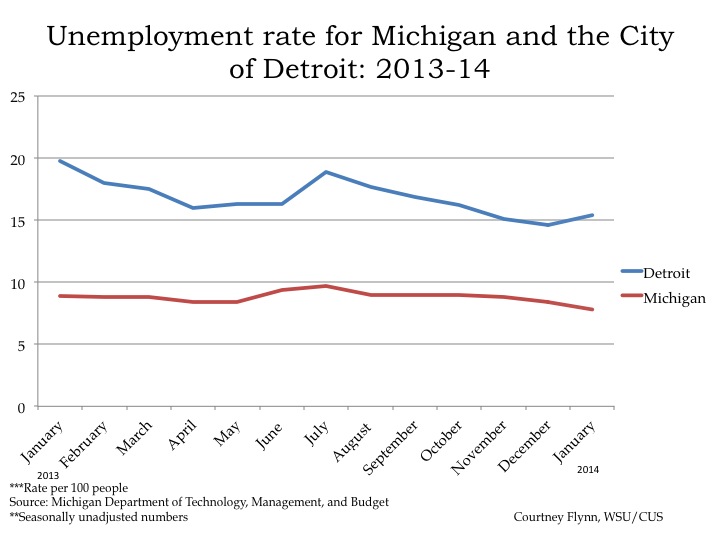
According to the most recent data provided by the Michigan Department of Technology, Management and Budget, from December to January the unemployment rate for the State of Michigan decreased from 8.4 to 7.8 percent. The City of Detroit experienced an unemployment rate increase though. In December the rate was recorded at 14.6 percent and in January it was recorded at 15.4 percent.

Slide04


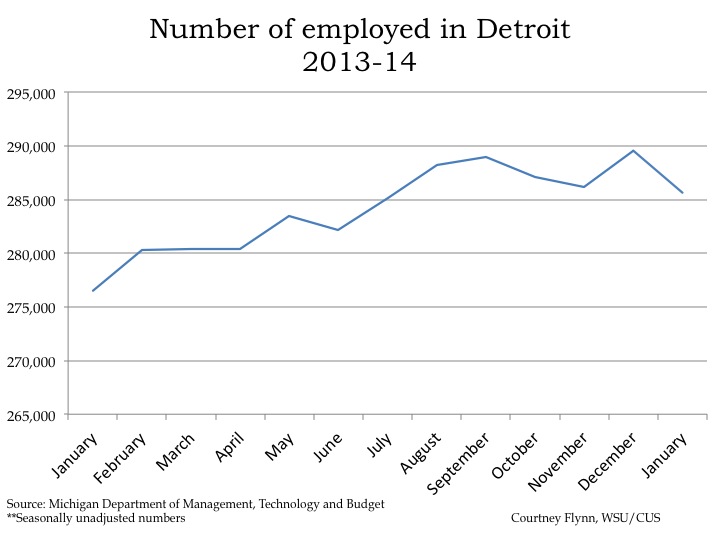
From December 2013 to January 2014, the number of people employed in the City of Detroit decreased to 285,640 from 289,555 in December, 2013.


Slide06


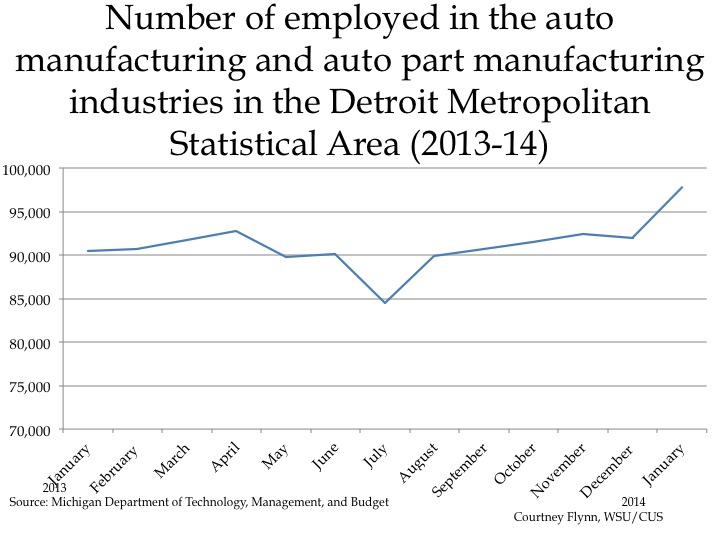
The above chart shows the number of people employed in the auto manufacturing industry in the Detroit Metropolitan Statistical Area throughout 2013 and into 2014. During the period under consideration, the highest employment levels in the auto manufacturing and auto parts manufacturing industries occurred in January 2014 when there were 97,800 people employed in the Detroit MSA. That was an increase of 5,800 over the previous month when it was reported there were 92,000 people employed in these industries; this is an increase of 5,800.

Slide08


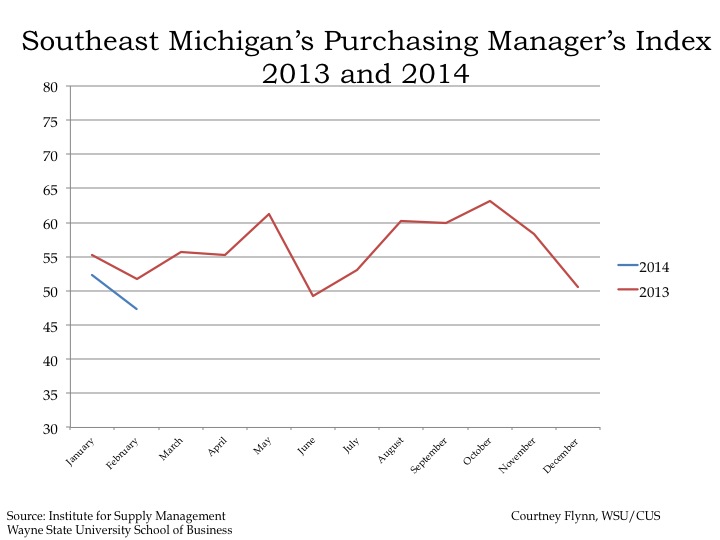
The Purchasing Manger’s Index (PMI) is a composite index derived from five indicators of economic activity: new orders, production, employment, supplier deliveries, and inventories. A PMI above 50 means the economy is expanding.

According to the most recent data released on Southeast Michigan’s Purchasing Manager’s Index, there was a decrease of 5 points from January 2014 to February 2014. In February 2014, a PMI of 47.3 was recorded. This was the first time since June 2013 that the PMI dropped below 50. This index is reflective of a “sluggish” economy because the production, new orders, and the raw material inventory indexes all dropped. Slide10

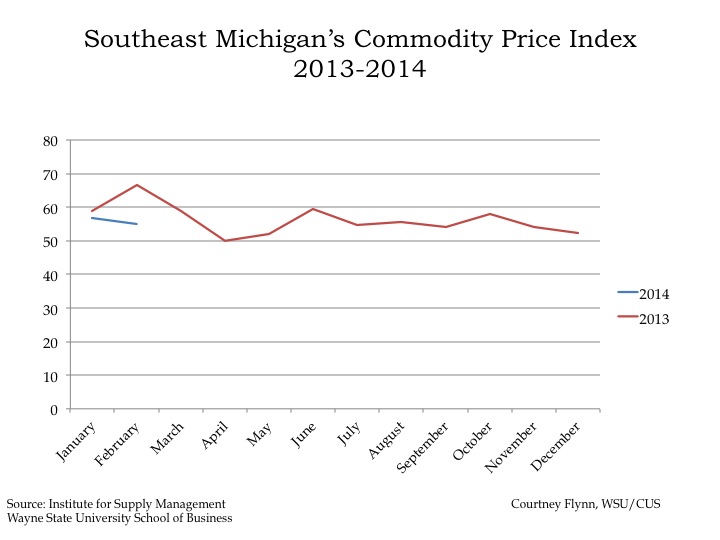
The Commodity Price Index, which is a weighted average of selected commodity prices, was recorded at 55 points in February 2014, which was 1.7 points lower than the previous month. Compared to the PMI, the Commodity Price Index has remained fairly stable since January 2013.

Slide12


Slide13


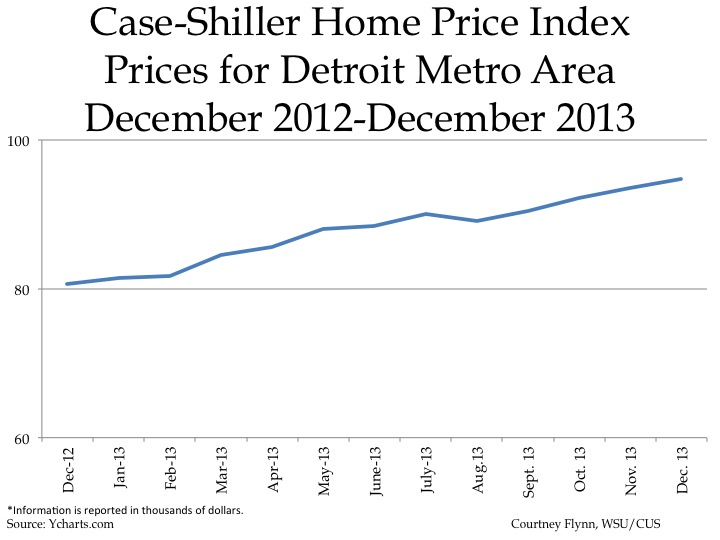
The above charts show the Standard and Poor’s Case-Shiller Home Price Index for the Detroit Metropolitan Statistical Area. The index includes the price for homes that have sold but does not include the price of new home construction, condos, or homes that have been remodeled.

According to the index, the average price of single-family dwellings sold in Metro Detroit was $94,700 in December 203. This was an increase of approximately $14,100 from the average price in  December 2012.

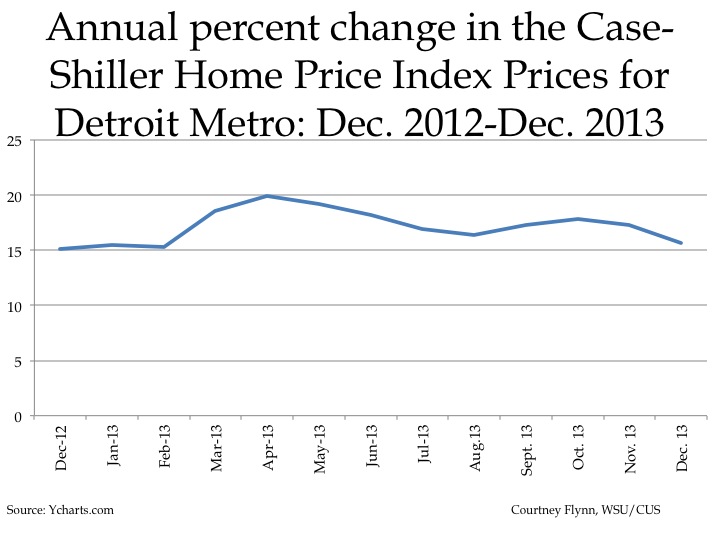
While home prices in the area continue to increase, the annual percent change graph above shows that the gap between current home prices and those a year ago is shrinking. Slide15

Slide16


Slide17


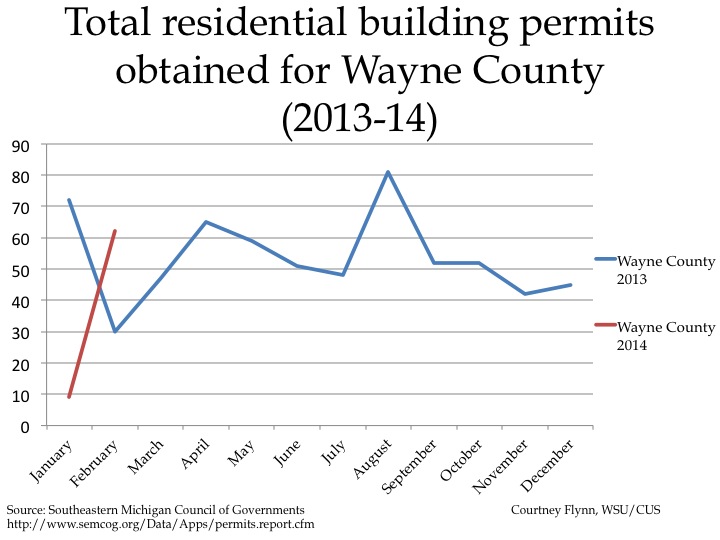
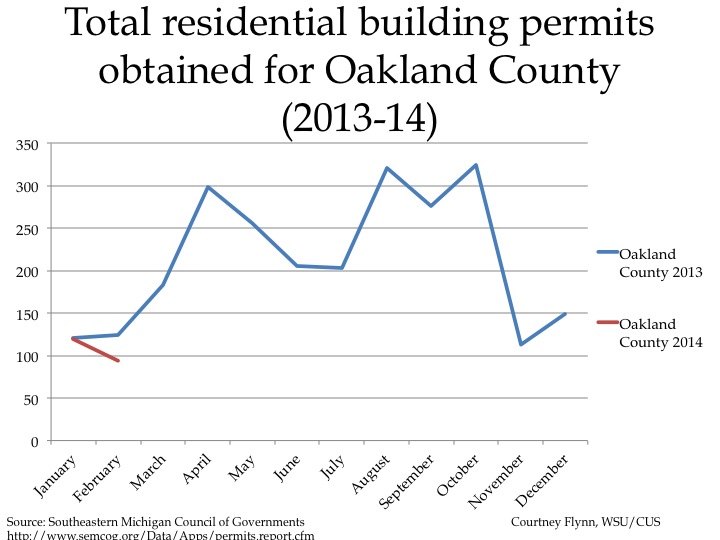
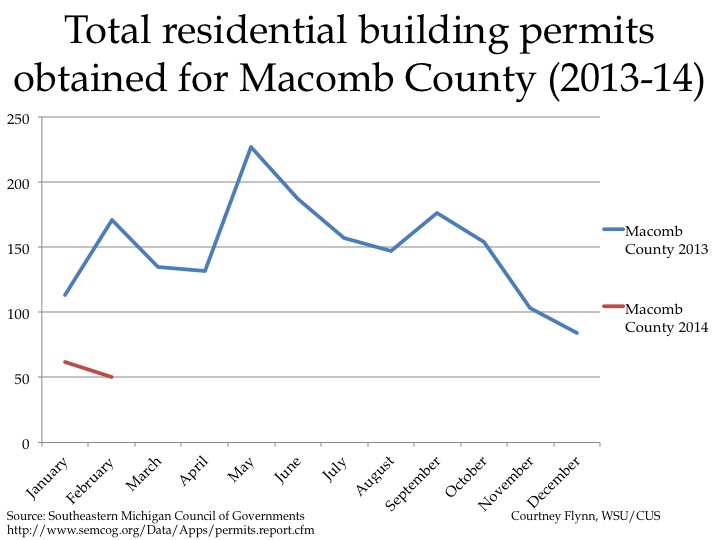
The above charts show the number of residential building permits obtained each month in Wayne, Oakland, and Macomb counties from January 2013 until February 2014. These numbers are reported by local municipalities to the Southeastern Michigan Council of Governments and include single family units, two family units, attached condos, and multi-family units.

Oakland and Macomb counties experienced a decrease in the number of building permits pulled in February 2014 compared to February 2013; Oakland County experienced a decrease of 30 building permits while Macomb County experienced a more dramatic decrease of 121 building permits. Wayne County, on the other hand, experienced an increase in permits pulled in February of this year (62) compared to February 2013 (30).

Michigan roads just as mediocre as other Great Lakes States’

One of the toughest winters on record in Michigan has challenged our roads tremendously, and we are dealing with a plague of potholes and craters. Given this and other neglect, the Michigan Department of Transportation said, the state needs an additional 35 cents per day from every vehicle registered in the state to maintain roads in good/ fair conditions. That’s $127.75 per car. Even so, that’s a lot less than the $357 per car cost that the bad condition of Michigan roads imposes on each motorist.

This post seeks to put the conditions of Michigan roads in context by highlighting road conditions in the eight Great Lakes States. Although Michigan invests the lowest amount of funds into roads, per capita, in the region, it does not have the highest percentage of poor roads or cost of vehicle repairs.

Slide03

The chart above shows the additional cost of motor vehicle repairs, per motorist, caused by driving on roads in need of repair. New York has the highest average cost, according to the 2013 Report Card for America’s Infrastructure, at $403. Ohio has the second highest average, in the Great Lakes state region, at $367 and Michigan comes in third at $357. Click here to learn about the vague methodology behind this report.

Slide05

The 2013 Report Card for America’s Infrastructure also showed that, of the Great Lakes States, Illinois had the highest percent of roads in mediocre or poor condition (73%) in the region while Indiana has the lowest (17%). The report indicated Michigan had 38 percent of its roads in mediocre or poor condition (lowest), following. Information is based off of 2009 data; the report card did not objectively define poor, mediocre, or good.

Slide07

According to the Michigan Department of Transportation, Minnesota invested $315 per capita into its total 2014 road budget while Michigan invested $174. This was the lowest in the Great Lakes region. Indiana invested the second lowest at $187.

Slide09

While weather can have an affect on roads, so can the amount of vehicle traffic. According to the 2013 Report Card for America’s Infrastructure, in 2009, Indiana had the highest highway vehicle miles traveled per capita at 11,672. Michigan came in fourth in the Great Lakes region at 9,878 highway vehicle miles per capita.

A little bit o’ Irish everywhere in Southeast Michigan

This past weekend, hundreds gathered in Detroit’s Corktown neighborhood to celebrate St. Patrick’s Day – a Catholic feast day for Ireland’s most well-known saint and an opportunity to celebrate all things Irish. Held annually on March 17, St. Patrick’s Day has become an opportunity for anyone to claim they are Irish (at least for the day). According to the American Community Survey data presented below, however, only 5.1 to 10 percent of the population in a majority of the communities in Southeast Michigan claimed Irish ancestry in 2011.

IrishSEMICH

Although Corktown once had a large Irish population base many people (exact numbers could not be found) from Ireland relocated to that part of Detroit during the Irish potato famine in the mid-1800s). Today though, the Irish population in Corktown has diminished and the entire City of Detroit itself does not have a particularly large Irish-ancestry population. According to the 2011 American Community Survey, those with Irish ancestry made up 5 percent or less of the city’s population in 2011.

As the map shows, in 2011, the percent of the population claiming Irish ancestry in a majority of the communities (insert number) in Southeast Michigan was between 5.1 and 10 percent. Fewer communities (12) had between 10.1 and 15 percent of the population make such claims, and even fewer (8) had over 15.1 percent.

Washtenaw, Macomb counties import most amount of trash

From Washington to Massachusetts to Canada, garbage trucks have been bringing trash into the state of Michigan to fill landfills across the state. The data in this post shows where much of this trash comes from and what counties in the seven-county region take in the largest amount of municipal waste.

The above chart shows the overall volume, in cubic yards, of waste disposed of in Michigan since fiscal year 2004. The overall disposal of municipal solid waste decreased from 2004 (63,183,512) to 2013 (44,914,993) and with that decrease there has also been a decrease in the amount of imported trash. In 2004, 18.1 percent of all waste disposed of in Michigan was from Canada and 10.3 percent was from other states. In 2013, 17.1 percent was from Canada and 6.2 percent was from other states.

The map above further demonstrates that Canada is Michigan’s highest importer of trash. According to the DEQ, in 2012 Canada brought in  6,764,907 cubic yards of trash. In addition, Ohio, the second-highest exporter of trash to Michigan, sent 1,428,651 cubic yards to regional landfills.

When further breaking down the data, it can be seen that Wayne County, in 2012, generated and disposed of the most waste. However, it was Washtenaw County, followed by Macomb County to import the most waste. Located in Washtenaw County, Veolia ES Arbor Hills, which is now an Advanced Disposal Services landfill, had the second highest amount of waste (4,578,334 cubic yards) deposited in it. The Veolia landfill imported 1,657,156 cubic yards of Oakland County’s waste, and 1,864,878 cubic yards of Wayne County’s waste. In comparison, it imported less than 3,000 cubic yards of Canadian waste; and it disposed of 337,506 cubic yards of its own waste. Located in Macomb County, Pine Tree Acres landfill  had the largest amount of waste by volume disposed of in it in 2012, with 4,818,600 cubic yards of municipal waste deposited, according to the Michigan Department of Environmental Quality. Of the waste disposed there,  Canada exported 3,466,060 cubic yards. This was more than the 917,962 cubic yards of waste Macomb County residents generated, and then disposed of, into their own landfill. According to the U.S. EPA, the average American generates about 4.43 pounds of waste a day, which totals about 1,617 pounds a year. That amount contributed to the 2.6 trillion pounds of garbage generated by the world in 2012. Of that amount of waste, 46 percent of it was made up of organic matter, according to the World Bank. To read more about where the world’s trash goes to and what its made of click here.

Grandparents caring for grandchildren high in Detroit

In the last post we explored the makeup of family households in the seven county region. For this post, we will break that information down even further and look at how many households in the area are led by grandparents who assume responsibility for their grandchildren that are younger than the age of 18.  In some communities more than 4 percent of the households with children are headed by grandparents.  In Detroit, there are neighborhoods where this number reaches more than 12 percent.

The overall percentage of grandparents responsible for children can be seen in the first three maps, the third focusing on Detroit.  Several communities in Wayne County, like Detroit, Inkster, Romulus and Taylor, have high percentages of grandparent led households. There is also a cluster in Northern Macomb and St. Clair counties. In that area there are eight communities where more than 4 percent of the grandparent population is responsible for their grandchildren; there are 24 total communities where more than 4 percent of the grandparent population is responsible for their grandchildren.

The third map though shows that on a Census tract level, there are about 25 neighborhoods in the city where more than 12 percent of the grandparent population is responsible for their grandchildren.

According to the data, about 7.1 percent of Detroit’s population is made up of grandparents, and of that population over 4 percent are responsible for their grandchildren. The fourth through sixth maps show the overall distribution of grandparents in Southeast Michigan, whether they are responsible for their grandchildren or not, are heavily concentrated in and around the City of Detroit.  Although Detroit has the highest concentration of the dark grey and red colors concentrated within its boundaries,  these colors also bleed out into the outer ring suburbs of Wayne, Oakland, and Macomb counties.