In this post we examine the type of family households with children, whether they are two parent or single parent. According to the data, there are also thousands of homes in the region where single fathers or mothers take care of the home and children. As the data shows, there are more homes with single mothers than single fathers; these homes are more concentrated in Wayne County. According to data provided by the 2011 American Community Survey, a majority of family households in Southeastern Michigan do not have any children under 18
According to the U.S. Census Bureau, a family is described as a group of two or more people related by birth, marriage, or adoption who all live together. A family household is described as a household that is maintained by the head of a family and includes people who live in that home who are not related. Non-family households are defined as households where a single person claims head of the household and if there are others living there, they are not related.
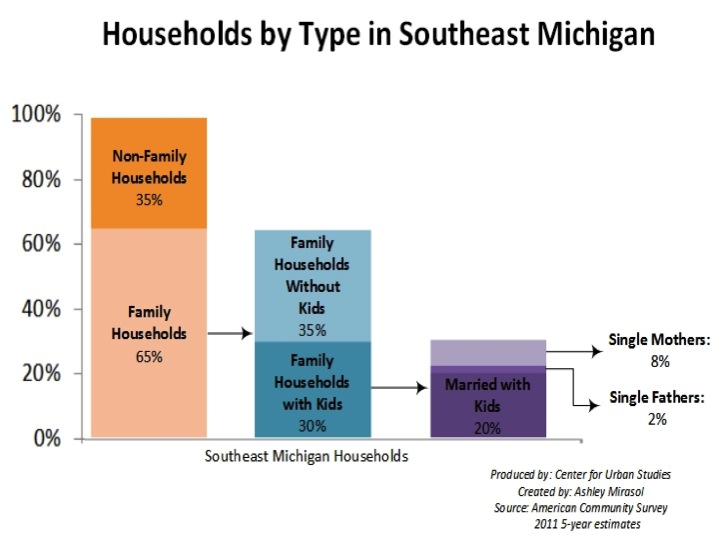
The graph above shows the total make up of family v non-family households in the seven county region. As can be seen, family households make up majority of the region, and in that sub-section it is family households without kids that make up that majority. For family households with kids, that subsection is made up mostly of married families with kids.

The above map shows the percent of two-parent households with children under the age of 18 in each municipality in the seven-county region. Livingston County has seven communities in which 30-40 percent of its households are composed of two parents and children under 18. Washtenaw County has six such communities, and Wayne County has one (Canton). The percentage of families with children under 18 in Wayne County was 29.8. Fewer than 10 percent (9.2) of the households in the City of Detroit were made up of two-parent households with children below the age of 18.
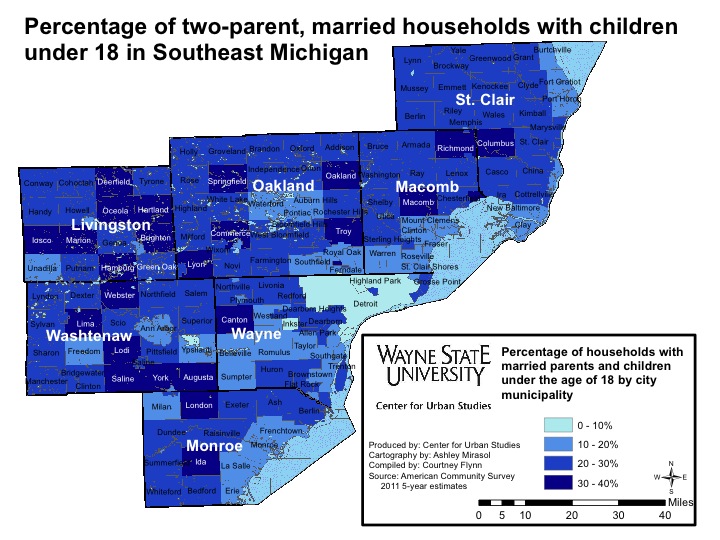
The above map shows the percent of two-parent households with children under the age of 18 in each municipality in the seven-county region. Livingston County has seven communities in which 30-40 percent of its households are composed of two parents and children under 18. Washtenaw County has six such communities, and Wayne County has one (Canton). The percentage of families with children under 18 in Wayne County was 29.8. Fewer than 10 percent (9.2) of the households in the City of Detroit were made up of two-parent households with children below the age of 18.
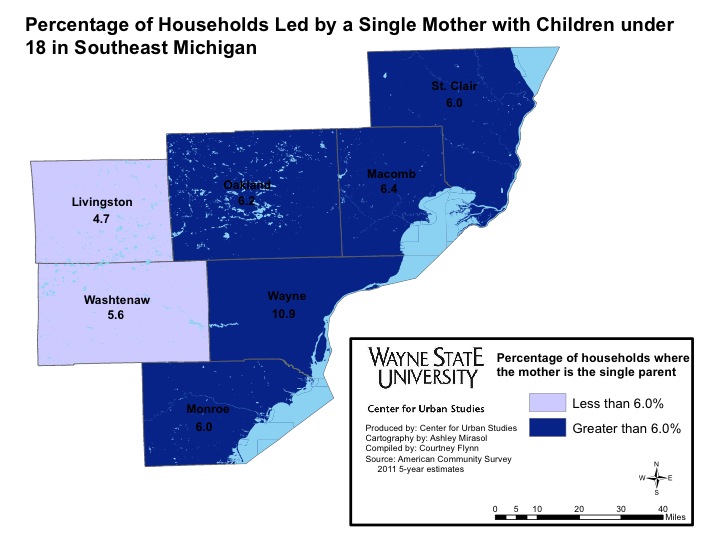
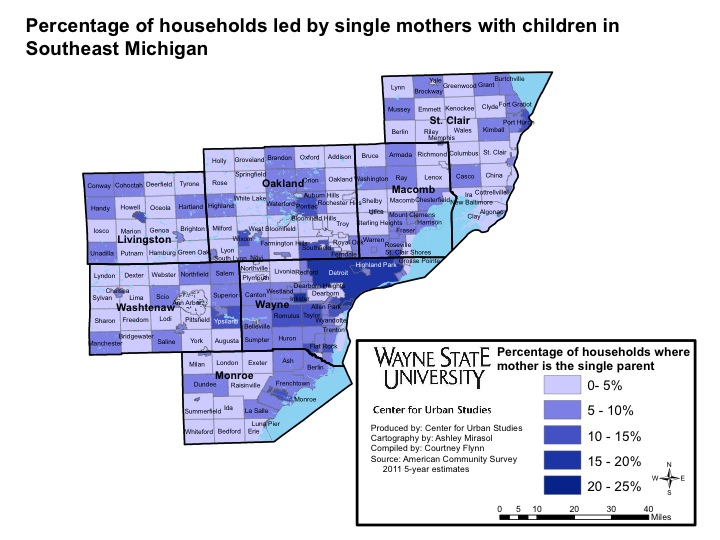
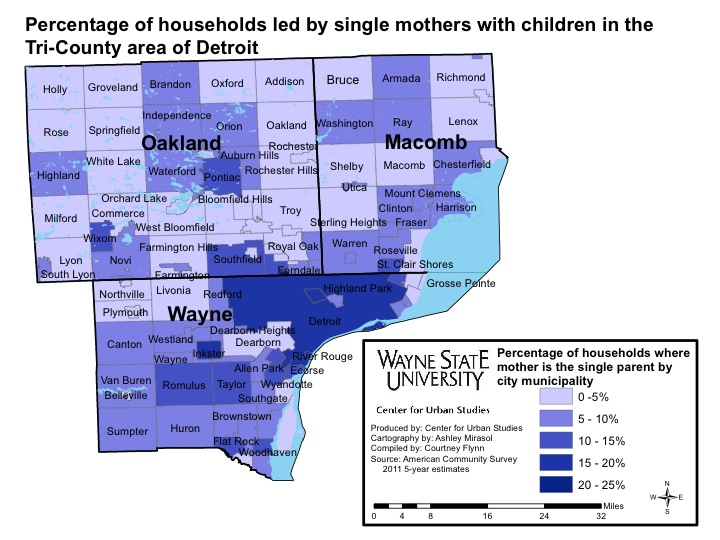
While Detroit had the smallest percentage of two-parent households with children, it also had one of the highest percentage(s) of family households with children under 18 led by single mothers. According to the data, 16.6 percent of the households in Detroit in 2011 were led by single mothers with children. The City of Inkster topped the list with 18.1 percent of family households being led by single mothers with children, while the City of River Rouge had 16.9 percent and the City of Highland Park had 16.4 percent.
All of these communities are located in Wayne County. Pontiac, in Oakland County, had 14.5 percent of its households led by single mothers with children in 2011.
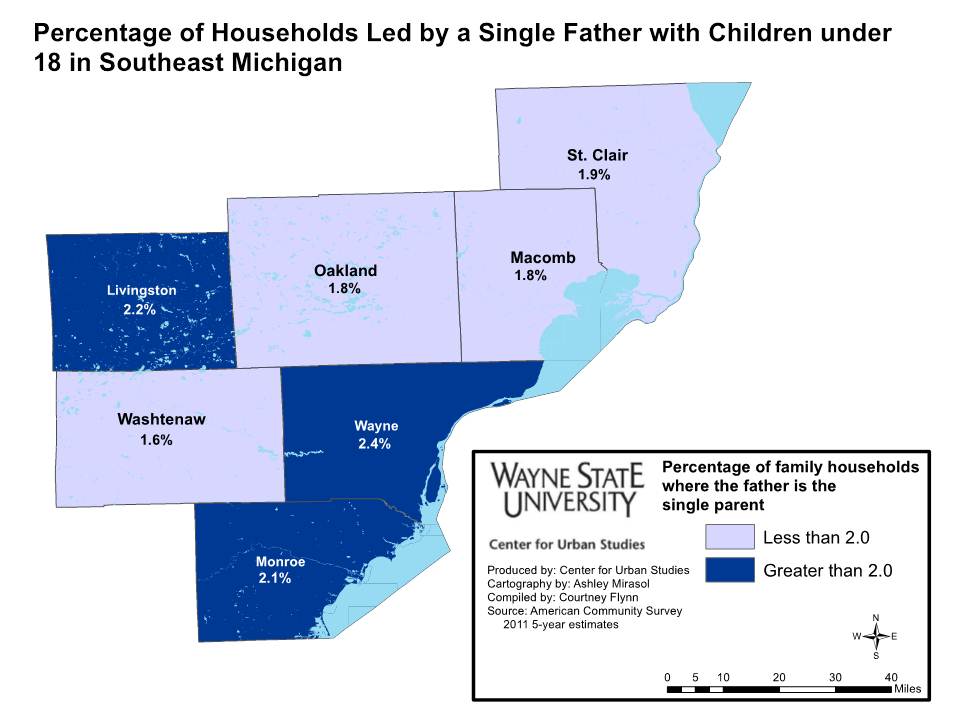
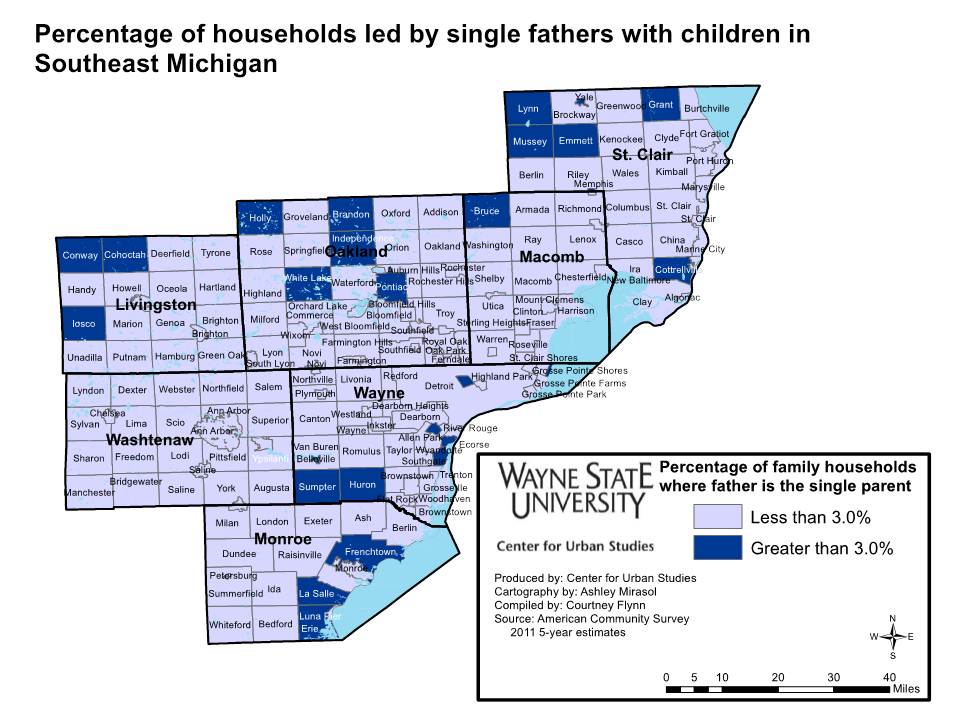
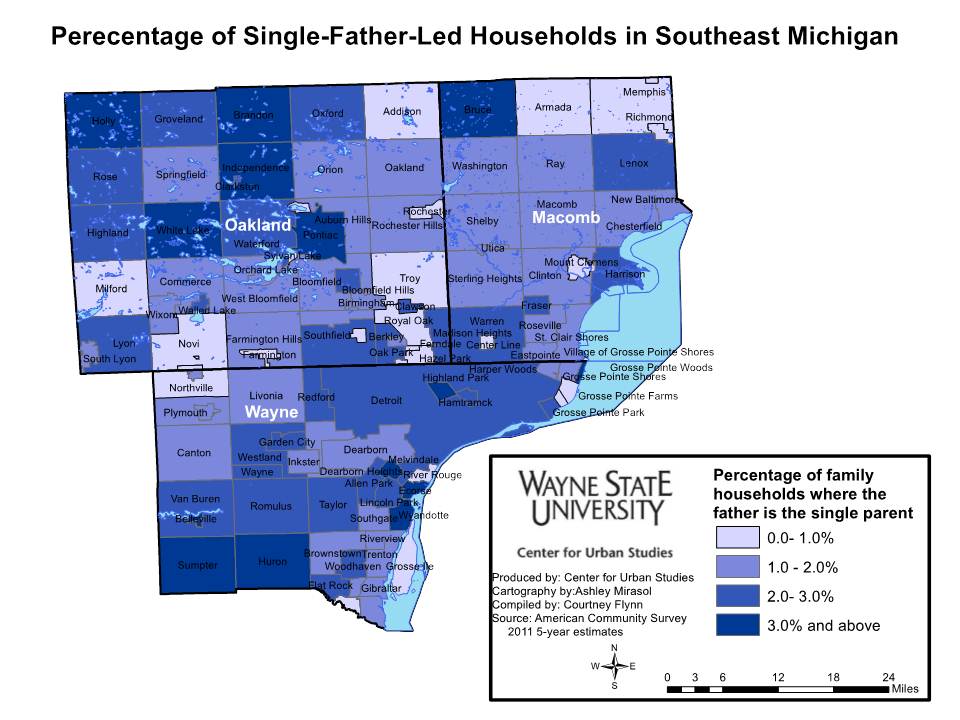
The data also shows that the percentage of single mother households with children in the region is much higher than the percentage of single father households with children. According to the data, Wayne County had the highest percentage, with 2.4, and Washtenaw County had the lowest, with 1.6 percent. In the tri-county area, Melvindale had the highest percentage of family households led by single fathers at 9.5 percent. In Macomb County, Ray Township was the community with the highest percent at 8.2; in Oakland County it was Pontiac with 7.2 percent.