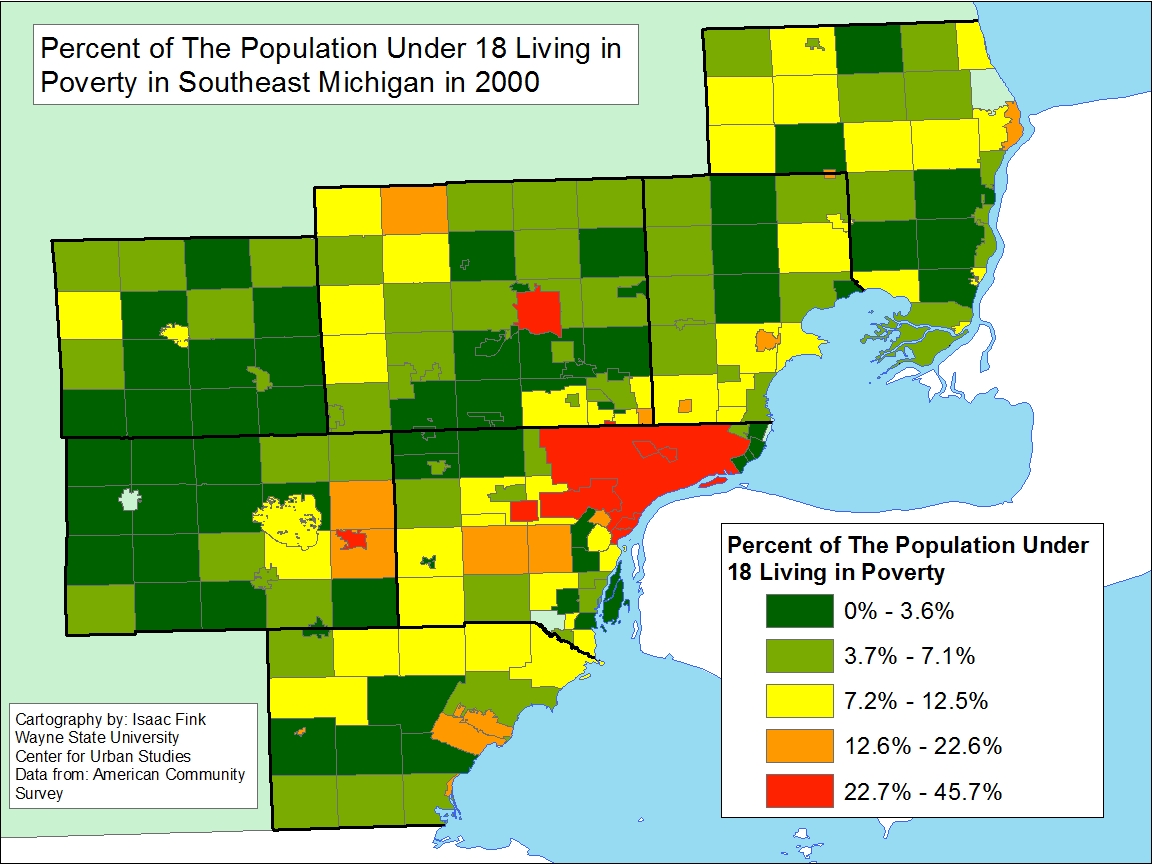
Since the year 2000 several municipalities in Southeastern Michigan have had consistently the highest percentages of residents over the age of 65 living at or below the poverty level–Highland Park, Hamtramck, Detroit. Remarkably, however, as this post demonstrates the biggest increases in poverty among older adults were in suburbs.
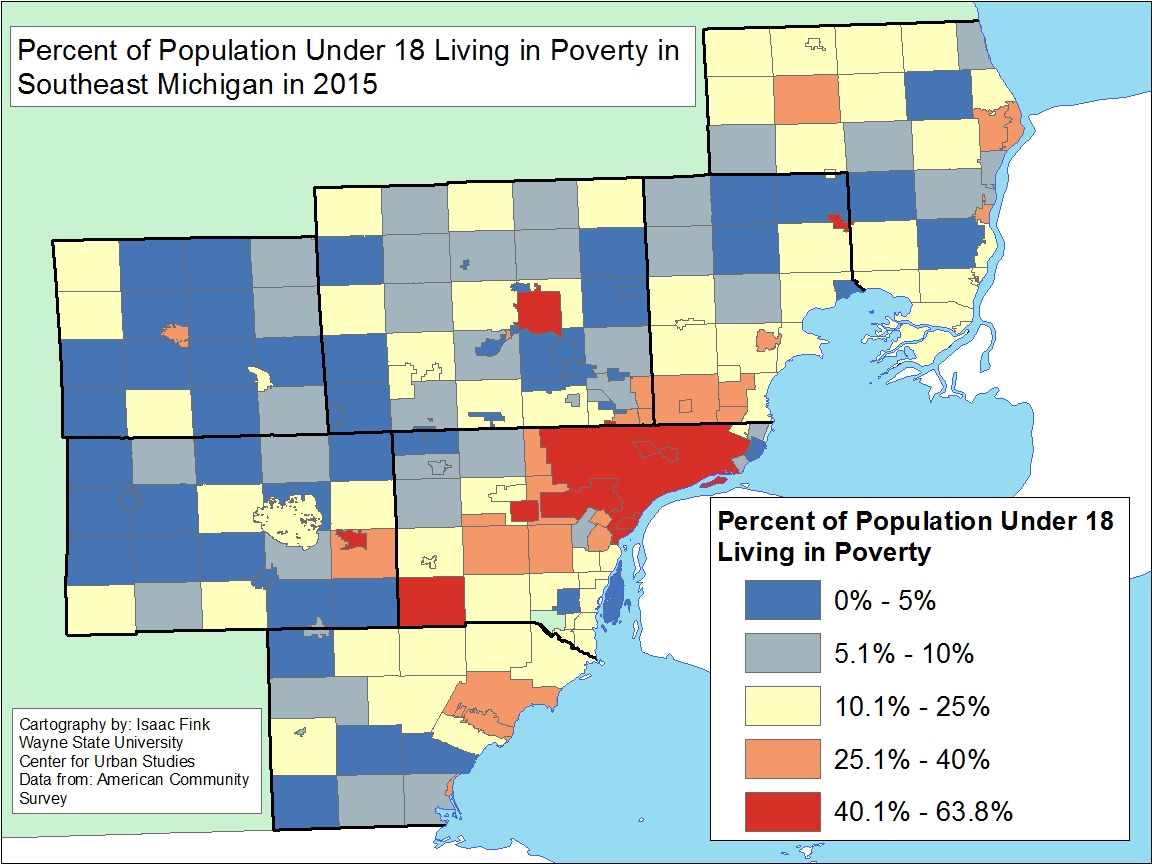
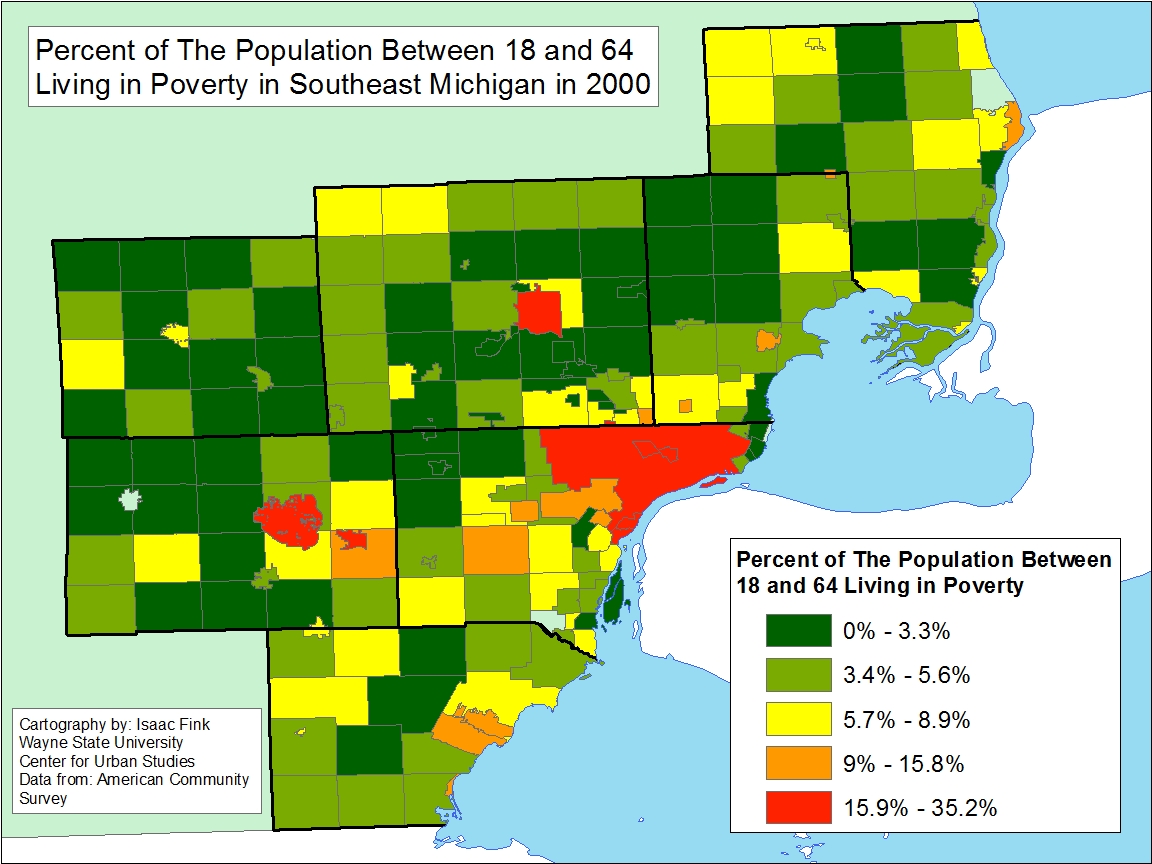
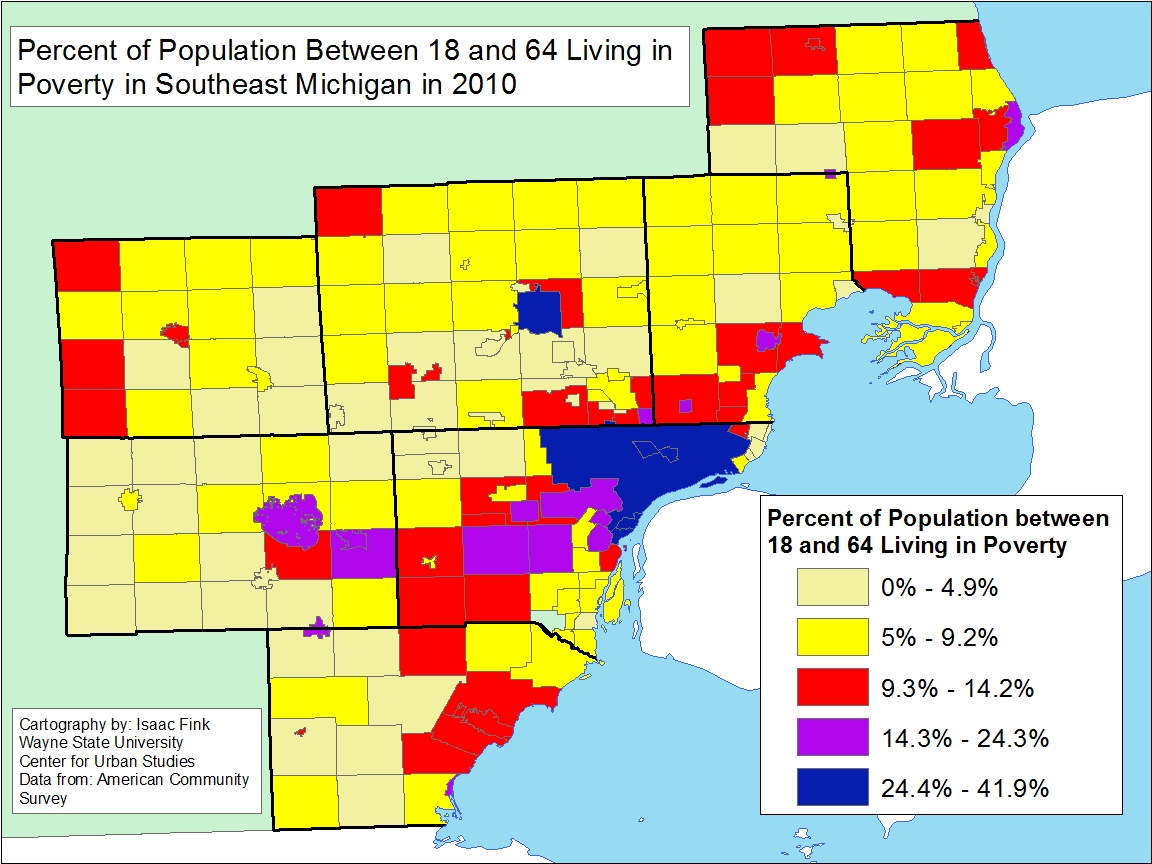
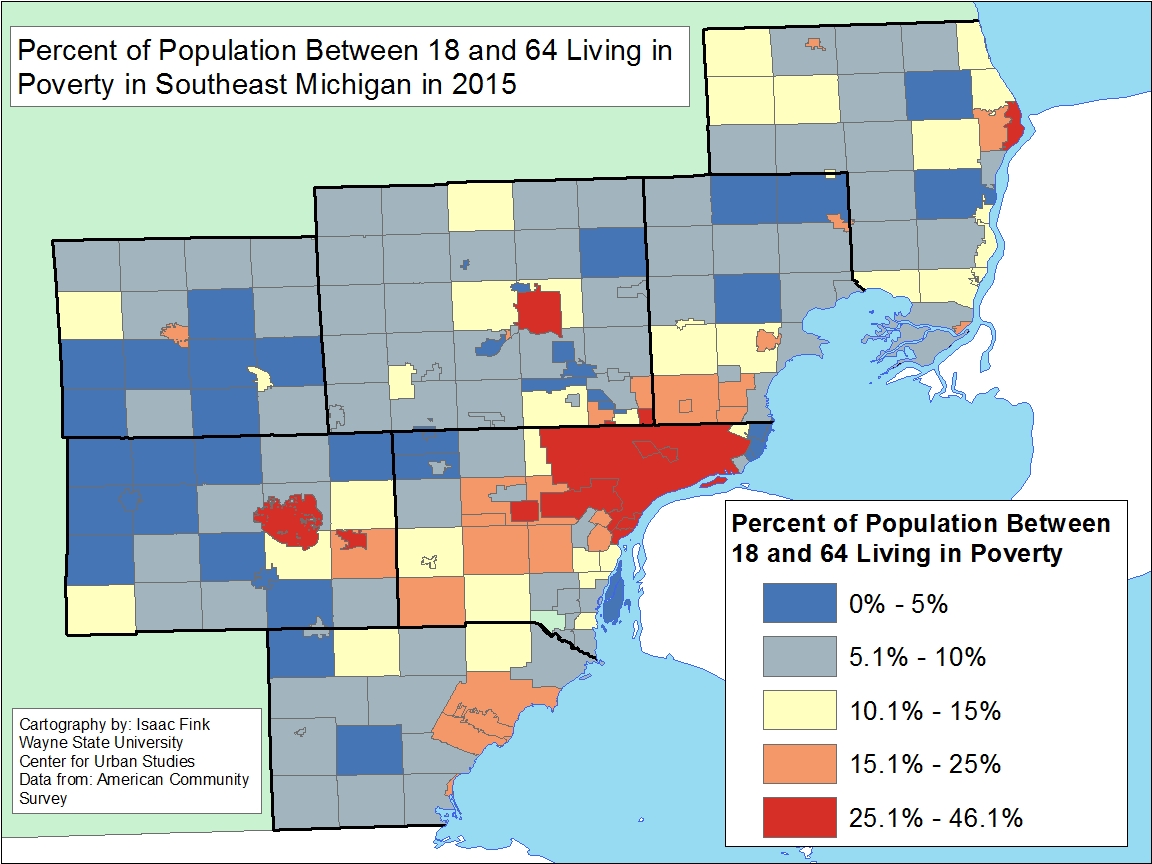
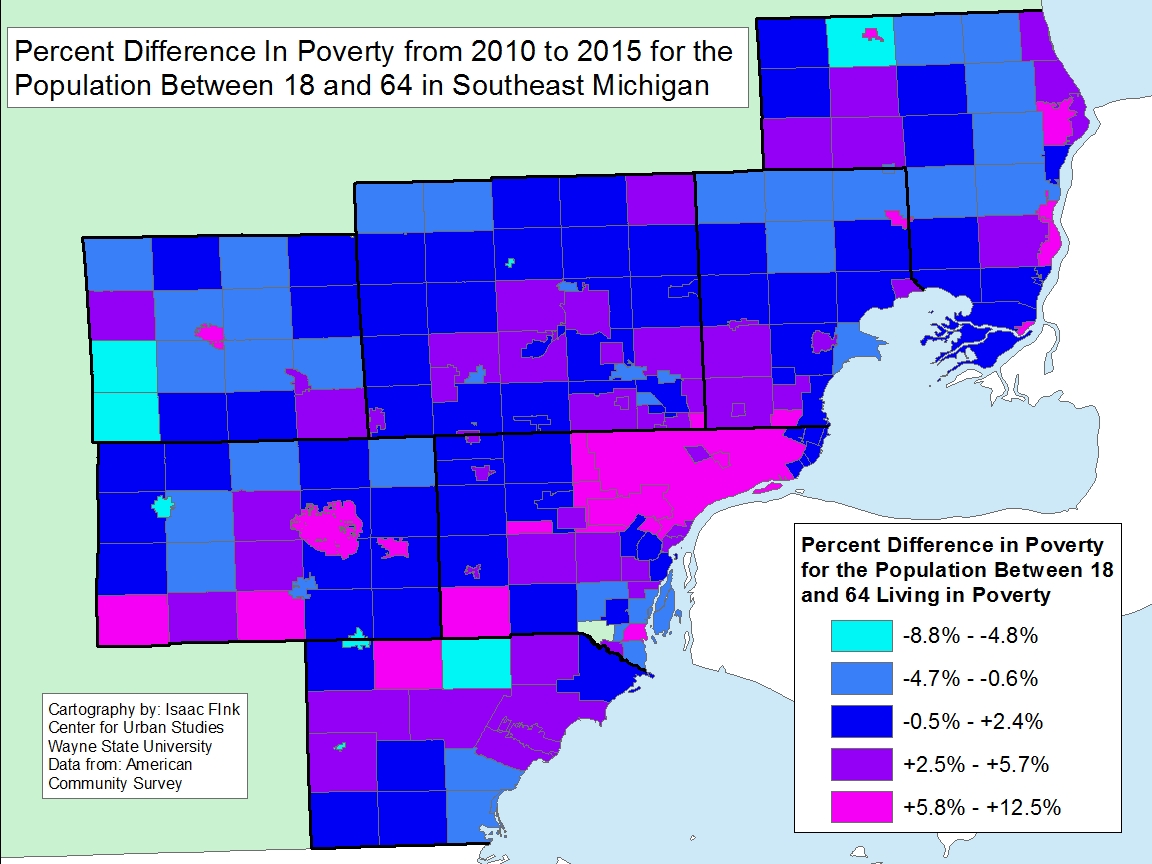
At the same time, the percentage of elderly residents living below the poverty line in Southeastern Michigan municipalities is below that of those between the ages of 18-64 living in poverty. Regionally, in 2015 about 10.3 percent of residents between the ages of 18-64 lived in poverty and about 6.5 percent of residents over the age of 65 and older lived in poverty.
All this poverty data is provided by the U.S. Census Bureau while the U.S. Department of Health and Human Services tell us the poverty threshold for an individual in 2015 was an annual earning of $11,770 and for a family of four it was $24,250. In 2010 the poverty threshold for an individual was $10,830 and for a family of four it was $22,050. In 2000 the poverty threshold for an individual was $8,350 for a family of four was $17,050.
In the year 2000 the following five municipalities had the highest percentage of residents over the age of 65 living in poverty:
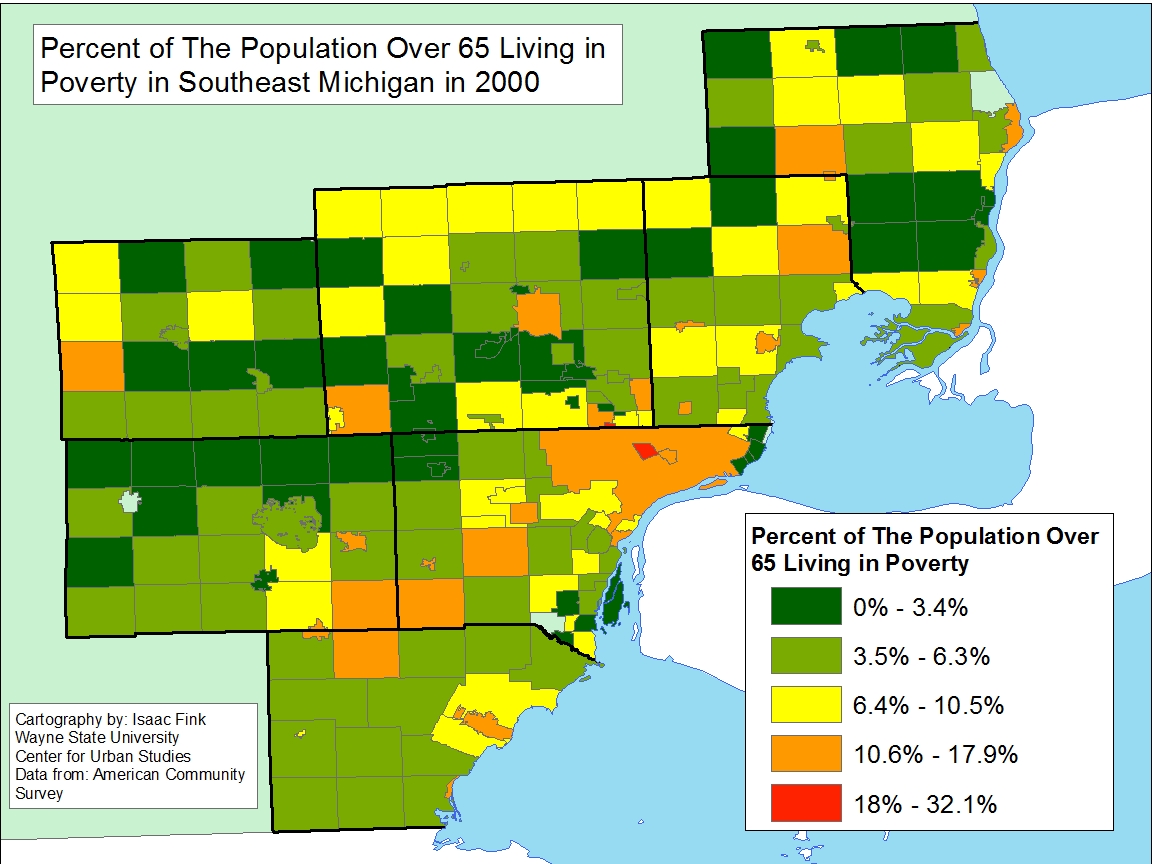
- Royal Oak Charter Township: 32.1%
- Highland Park: 28.8%
- Memphis: 19.4%
- Detroit: 17.9%
- Hamtramck: 17.4%
In 2010 the municipalities with the highest percentage of elderly living in poverty shifted to the following:
- Hamtramck: 28.6%
- Highland Park: 26.1%
- Oak Park: 23.1%
- Hazel Park; 22.6%
- Center Line: 21.9%
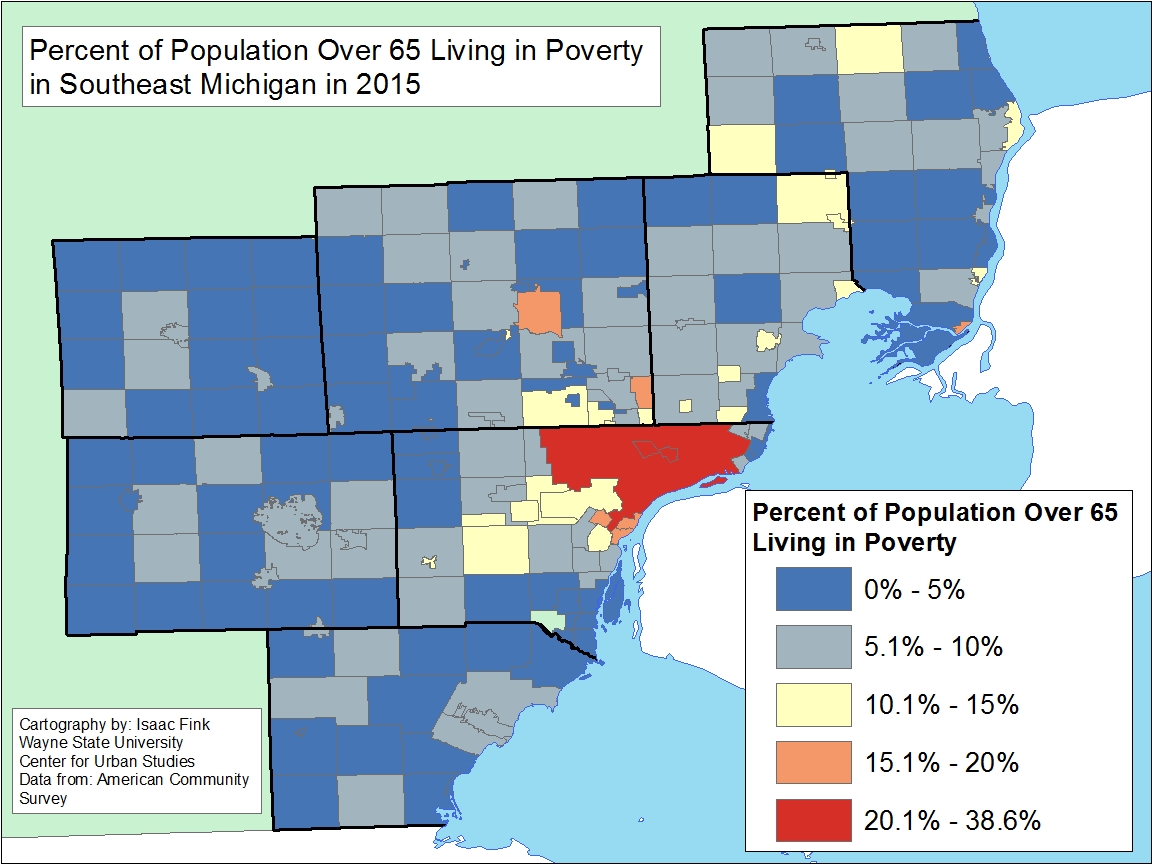
Most recently, in 2015, we again saw several of the same municipalities in Southeastern Michigan having the highest percentage of elderly living at or below the poverty line. By this time the percentage of elderly in poverty had continued to increase for several of the municipalities.
- Highland Park: 38.6%
- Hamtramck: 30.7%
- Detroit: 20.4%
- Melvindale: 19.5%
- Madison Heights: 17.2%
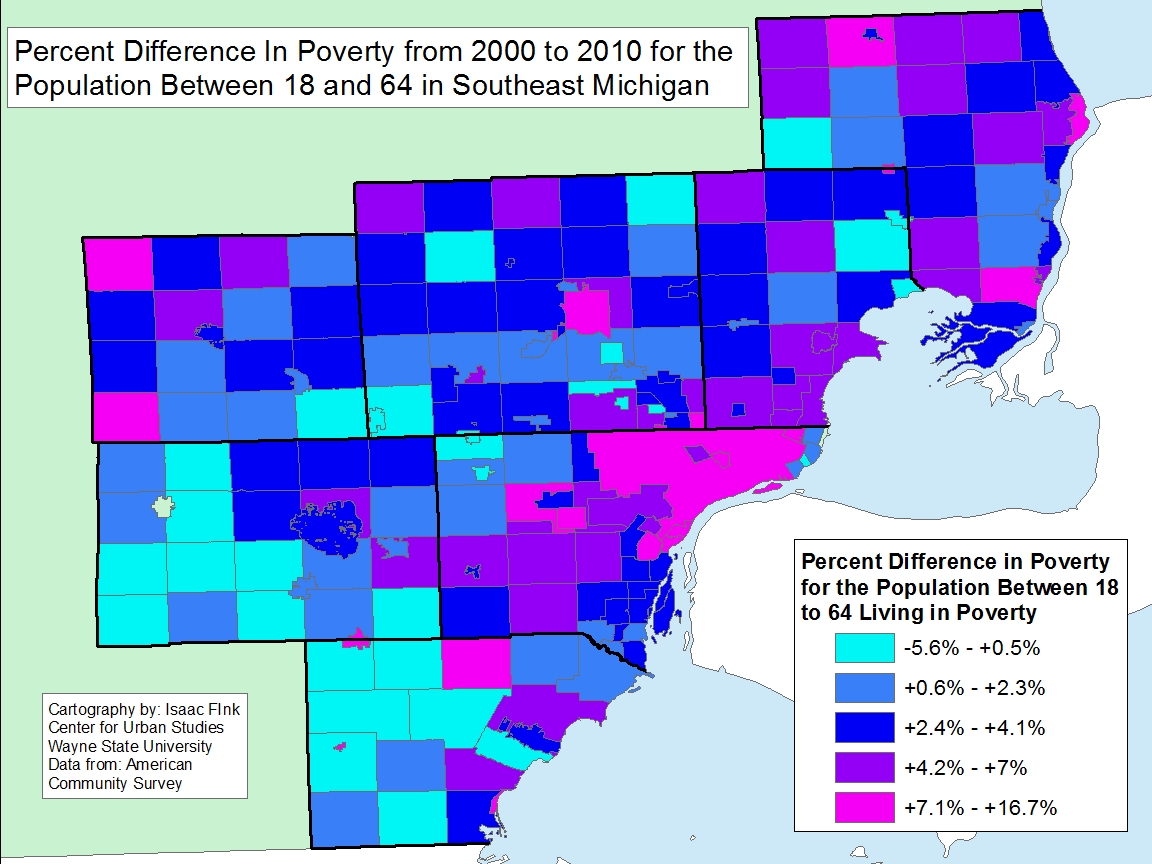
Percent in Poverty Level Changes 2000-2010
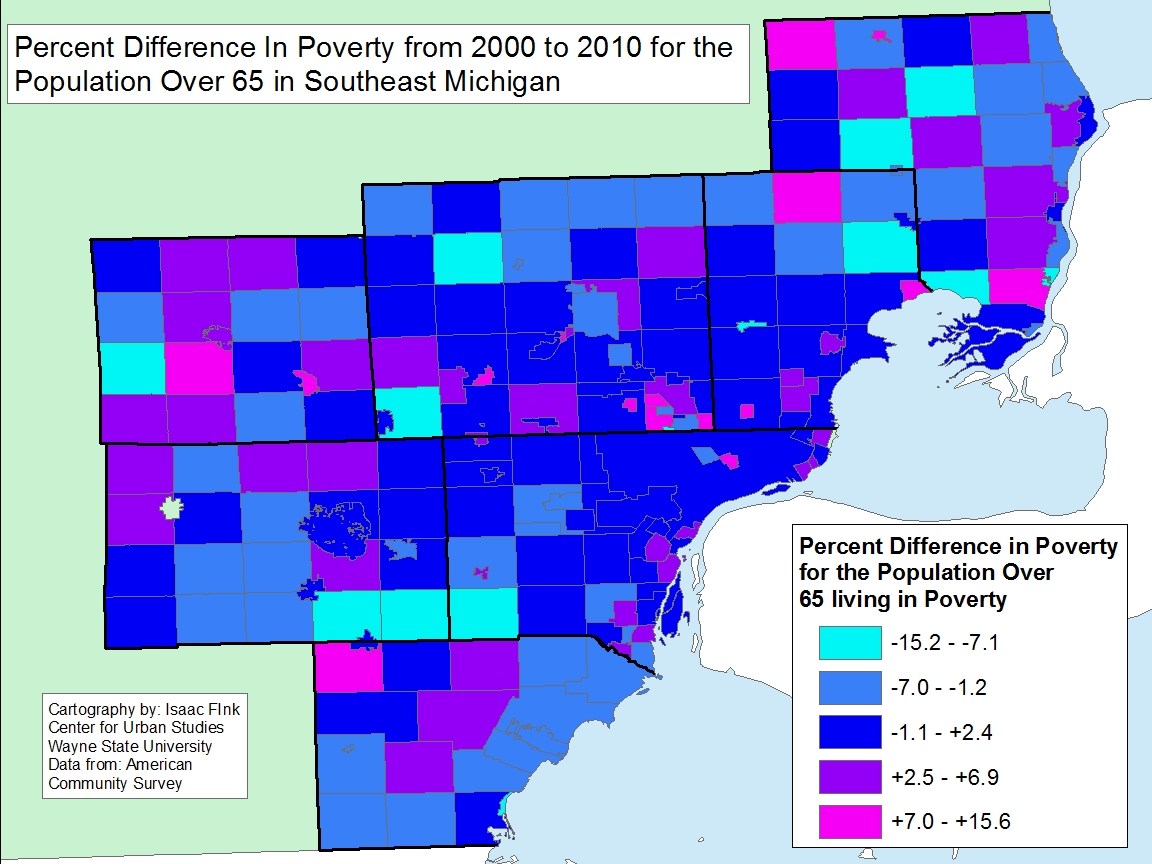
Between 2000 and 2010 the only inner-ring suburb that ranked in the top five for Southeastern Michigan municipalities with the highest increase in the percentage of elderly living at or below the poverty line was Hamtramck. The top five municipalities that experienced the highest change in those 10 years were:
- Yale (St. Clair County): 15.6%
- Hazel Park (Wayne County): 15.1%
- Brighton (Livingston County): 13.9%
- Marion (Livingston County): 13.1%
- Lynn Township (Livingston County) 12%
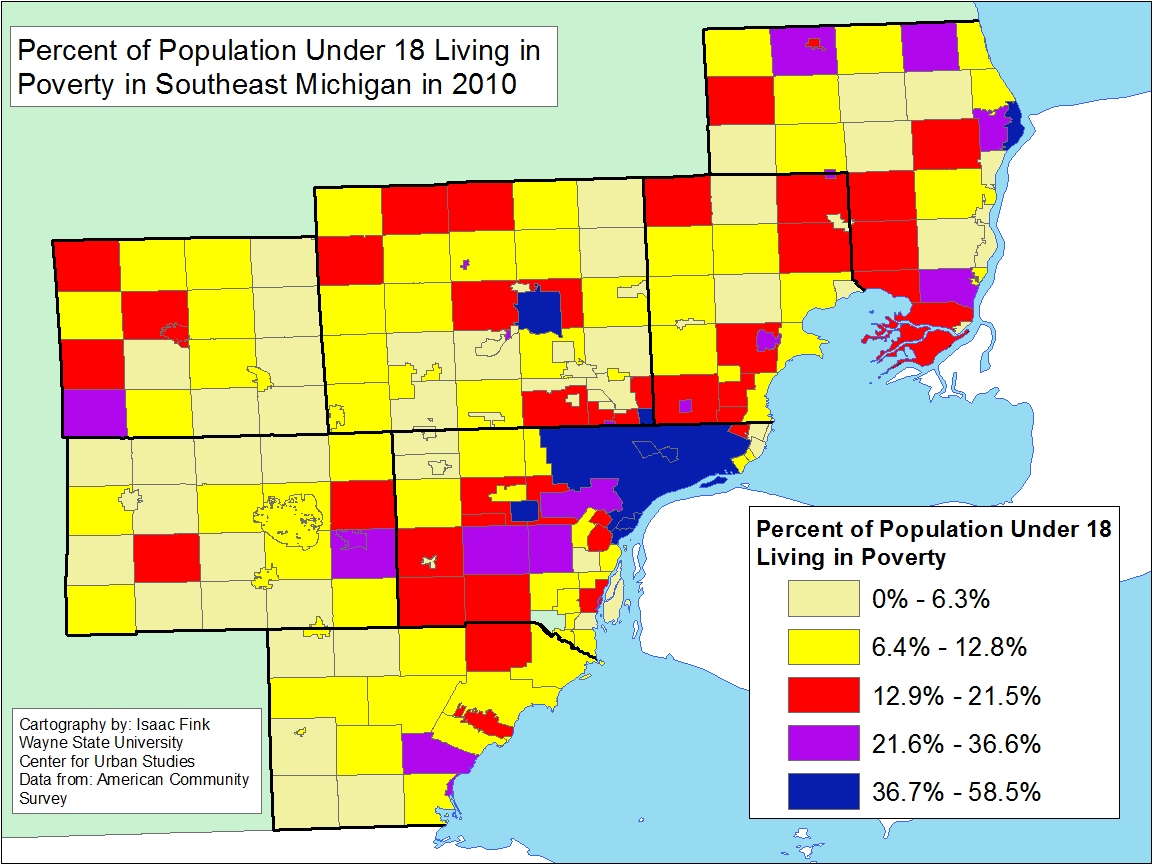
From 2000 through 2010 for the 213 municipalities for which comparable data was available through the American Community Survey, 84 experienced a decrease in the percentage of residents over the age of 65 living in poverty. On the opposite side of the spectrum, about 20 of the communities that experienced an increase in the percentage of elderly living in poverty were direct suburbs of Detroit. However, between 2000 and 2010, Detroit experienced only a 0.7 increase in the percentage of elderly living in poverty. Highland Park, which has typically ranked at the top for the percentage of residents living in poverty and for percentage increases, experienced a 2.7 percent decrease in the percentage of elderly residents living in poverty between 2000 and 2010.
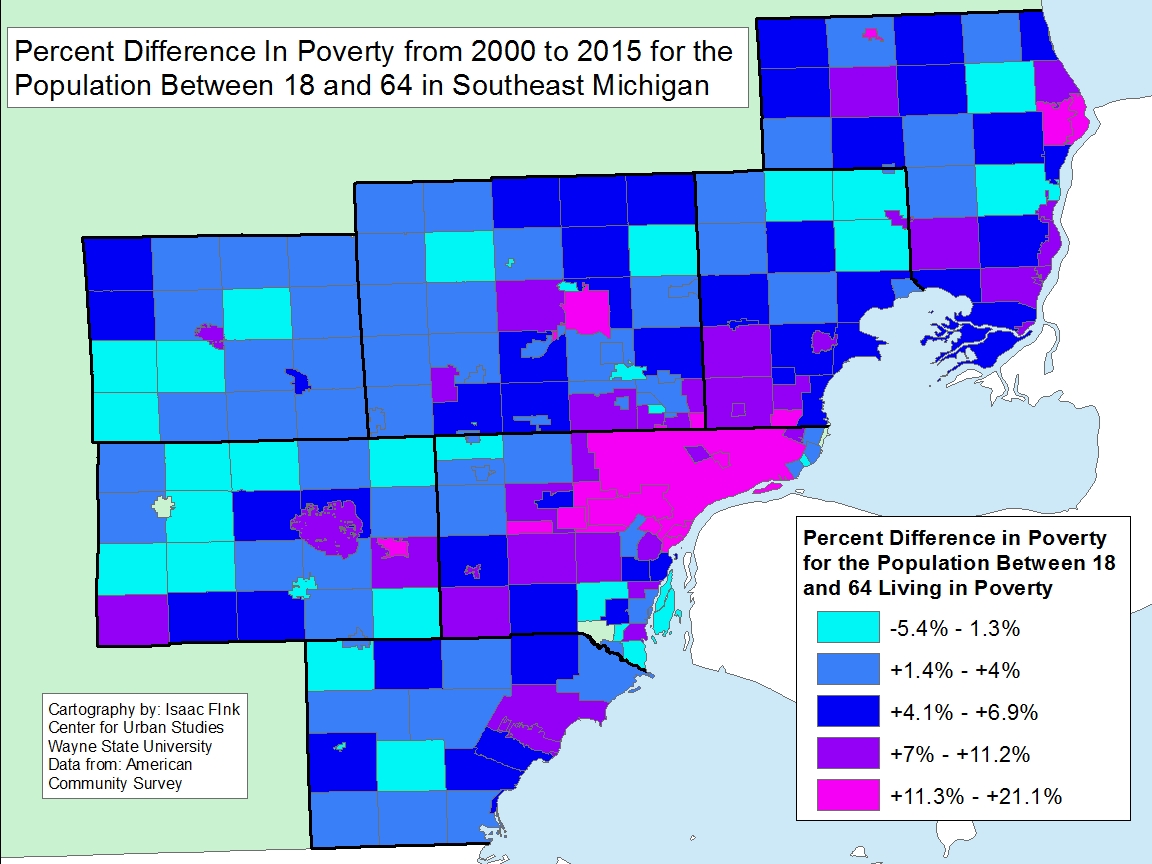
Percent in Poverty Level Changes 2000-2015
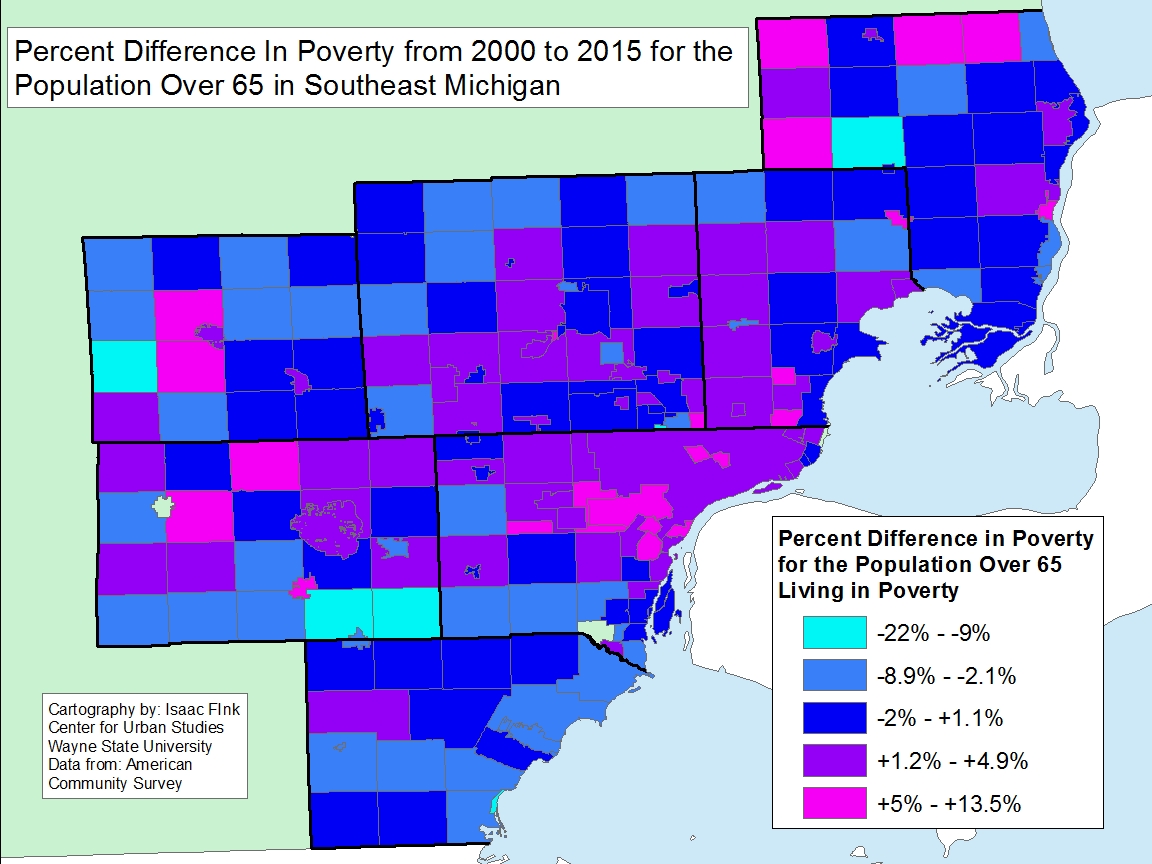
Between the years 2000 and 2015, the increase in poverty among older residents was on par with the increases experienced for several municipalities between the years 2000 and 2010. During this time period, the City of Hamtramck experienced the largest increase at 13.5 percent, followed by Berlin Township (St. Clair County) and Melvindale. These were the only three communities in Southeastern Michigan that experienced increases above 10 percent in the percentage of elderly residents living in poverty. Additionally, there was an overall increase in the number of communities between 2000 and 2015 that experienced a decrease in the percentage of residents over the age of 65 living in poverty. Of the 213 municipalities for which comparable data was available, 94 experienced a decrease. However, Highland Park experienced about 9 percent increase in the percentage of older residents residing in poverty between 2000 and 2015, and Detroit experienced about a 2.5 percent increase. Still the remarkable trend was the tendency for poverty among older adults to increase in the suburbs.
Percent in Poverty Level Changes 2010-2015
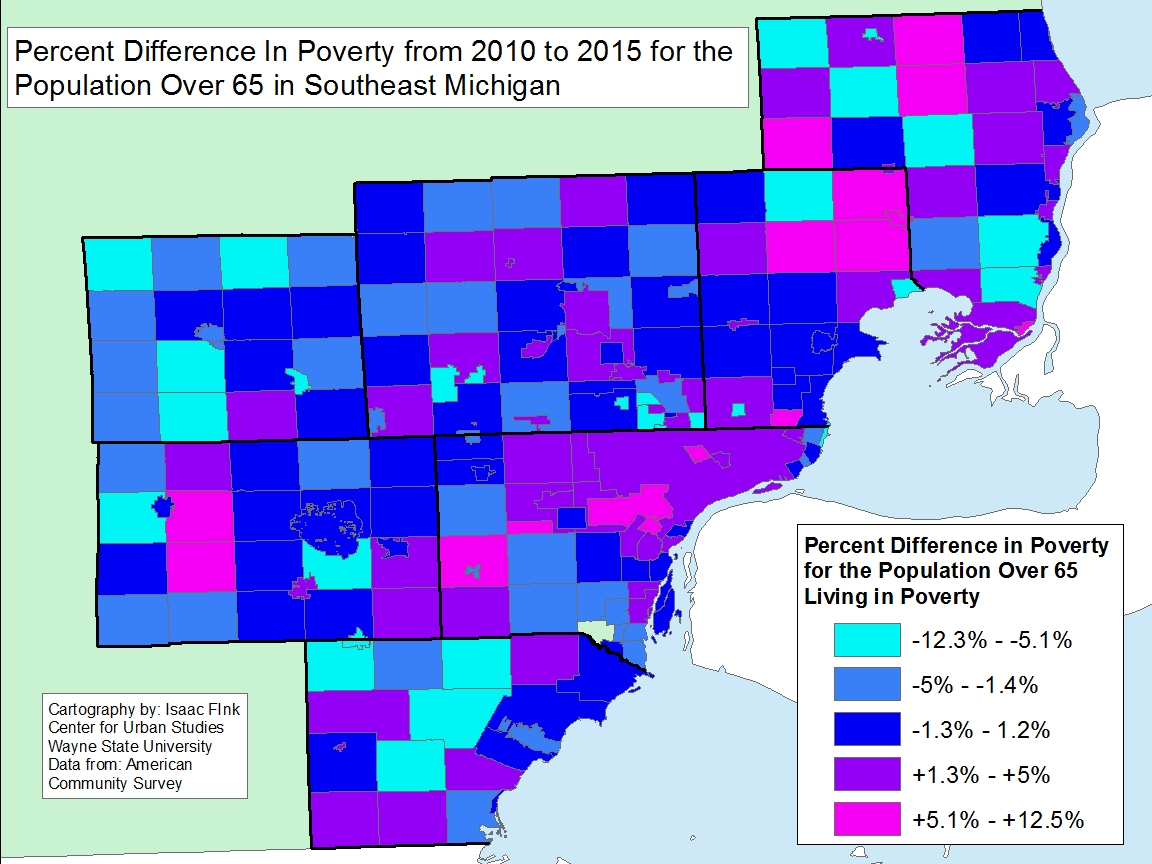
Between 2010 and 2015, Highland Park experienced the largest increase in the percentage of residents over the age of 65 living in poverty. During this time frame, Highland Park experienced an increase of about 12.5 percent; Berlin Township followed with an increase at about 10.8 percent. These two communities were the only ones in the region that experienced increases for the percentage of residents over the age of 65 living in poverty above 10 percent between 2010 and 2015.
Additionally, between 2010 and 2015, the number of communities that experienced a decrease in the percentage of elderly residents living in poverty decreased. In total, of the 213 communities for which data was available for, 102 experienced a decrease in the percentage of residents living in poverty.
Overall, this post shows that currently, and overtime, there is a smaller percentage of resident over the age of 65 living in poverty. Compared to last week’s post, which focused on those between the ages of 18-64 (typically those of working age) we see that there is a higher percentage of residents between the ages of 18-64 living in poverty and that those percentages across the region have increased for those in that age bracket. For the elderly population though, the percentage of residents residing in poverty has increased overtime for a number of municipalities, but majority of the region experienced a decrease.