Monroe County has Highest Medical Marijuana Licenses Per Capita in Southeastern Michigan

In 2016 in Southeastern Michigan there were 98,055 registered medical marijuana patients, a number that has grown by about 45 percent since 2012, according to data provided by the Michigan Bureau of Licensing and Regulatory Affairs (LARA). LARA is required to provide an annual report on the Michigan Medical Marihuana Program, which includes the annual number of patients by county.

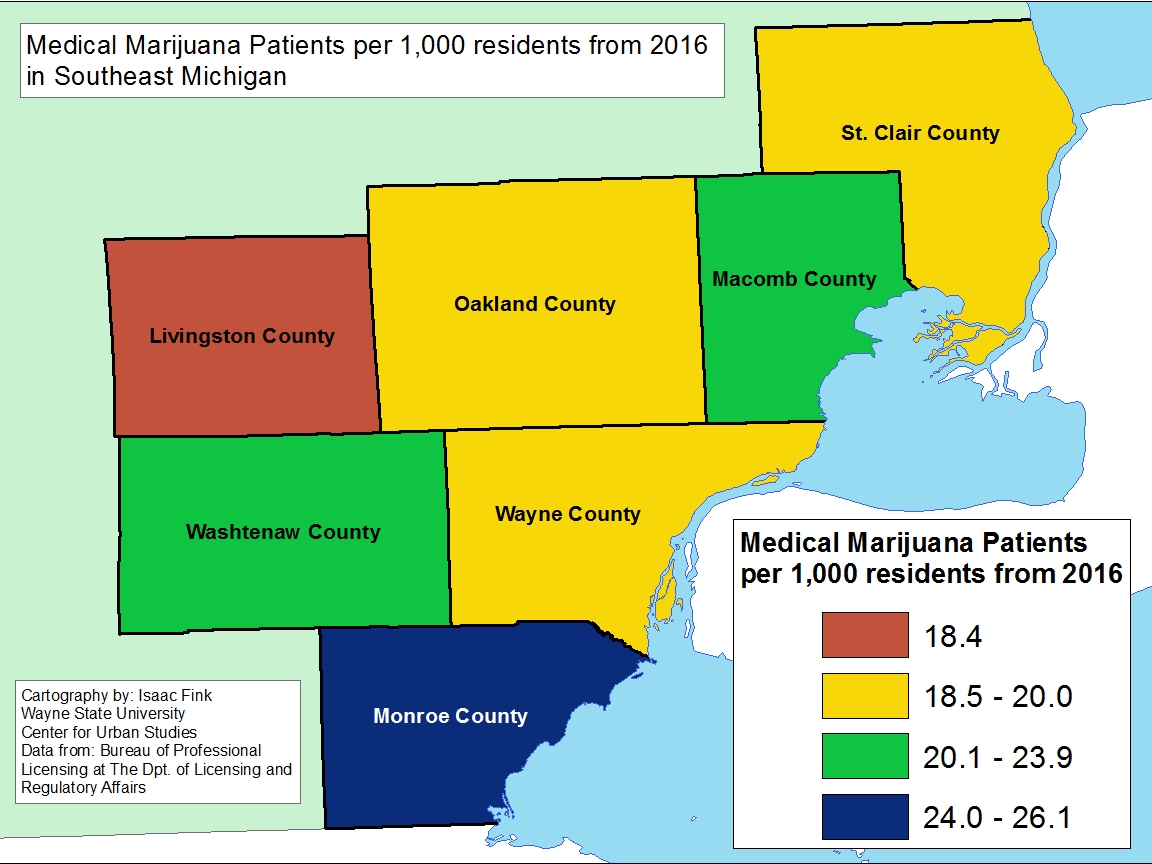
In terms of sheer volume, Wayne County had the highest number of medical marijuana patients in the region at 34,941 in 2016. However, when examining the data per capita per 1,000 residents, Monroe County had the highest number at 26. In Monroe County in 2016 there were 3,889 medical marijuana patients. In 2012 the total number of medical marijuana patients in Monroe County was 2,118; between 2012 and 2016 the total number of patients in Monroe County grew by 55 percent.

On the opposite end of the spectrum, Livingston County had the lowest number of medical marijuana patients per 1,000 residents at 18, which was the equivalent to 3,463 total patients. Between 2012 and 2016 the number of medical marijuana patients in Livingston County grew by 54 percent.

Wayne, St. Clair and Oakland counties all had a similar number of medical marijuana patients per 1,000 residents as Livingston County. All three counties had about 20 medical marijuana patients per 1,000 residents in 2016. St. Clair County has experienced the highest percentage of growth since 2012 at 72 percent.

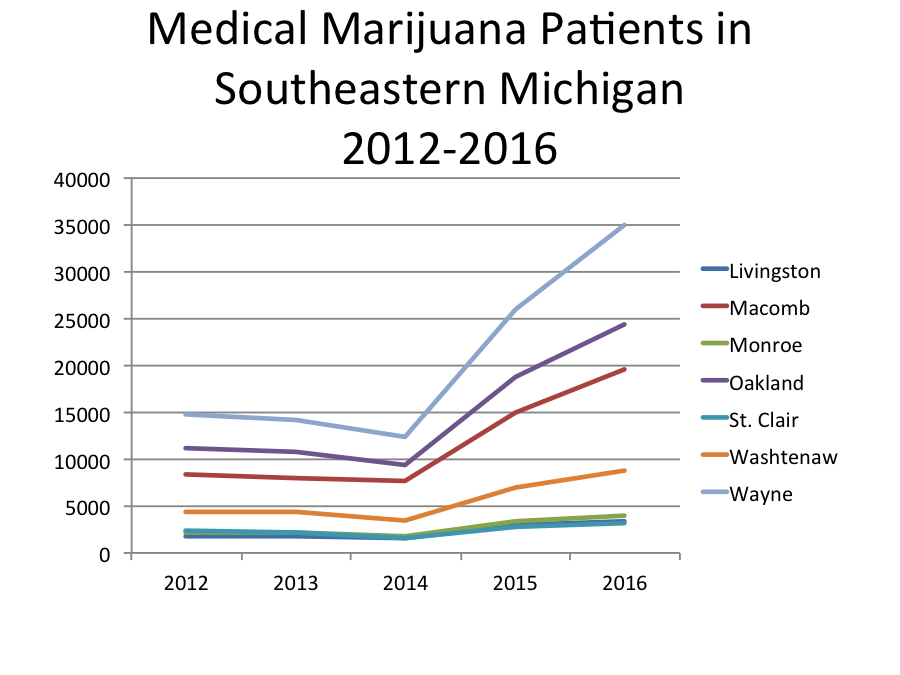
As the data shows, the number of medical marijuana patients in Southeastern Michigan has grown over the last five years, and this isn’t a trend unique to the region. Statewide data proves that throughout Michigan the number of medical marijuana patients has increased. In the graph above, a decline in the number of the medical marijuana patients is shown between 2013 and 2014, however this decline is not necessarily accurate. Rather, it reflects the two-year registry program, so the number reflects only the new patients who were required to apply that year.

While the number of medical marijuana patients in Michigan continues to grow there are efforts to fully legalize marijuana for adults 21 years of age and older. On May 5, the Michigan Coalition to Regulate Marijuana Like Alcohol, submitted language that would create a system allowing for the legal cultivation, sale and regulation of the substances. If enough signatures are gathered, the hope of the organization is for the ballot initiative to be on the November 2018 ballot.

Percentage of Occupied Rental Units Continues to Climb in Southeastern Michigan

There were nine municipalities in Southeastern Michigan that experienced more than a 100 percent increase in occupied rental units between 2010 and 2015, according to the American Community Survey. Sylvan Township in Washtenaw County had the largest increase at 301 percent. In 2010 the township had 2.32 percent of its housing stock serving as filled rental units and by 2015 that increased to 9.3 percent, or a total of 109 rental units. Overall in Sylvan Township in 2015 there were 1,169 occupied housing units. All the municipalities with such high rental rate increases were among the smaller communities in the region.

Detroit, the largest city in the region, had an 11 percent increase in rental units. In 2010, 46 percent of the city’s occupied housing stock was rental units and in 2015 that number increased to 51 percent, or about 124,000 units. There were only four Census tracts in Detroit (two in the north east corner and two on the west side) where the percentage of rental units increased by more than 150 percent. The northwest area of the city had about 25 Census tracts that experienced an increase between a 25 and 75 percent in occupied rental units. On the opposite side of the spectrum, there were 178 Census tracts in Detroit where the percentage of occupied rental units decreased by up to 60 percent. The data we are looking at in this post is related to occupied housing units, meaning increases and decreases can be directly correlated with the number of occupied rental units and overall occupied housing units. Overall, in 2010 in Detroit there were about 272,000 occupied housing units, of which about 124,000 were rentals. In 2015 the total number of occupied housing units decreased to about 256,000 while the number of rental units increased to about 129,000.


In a recent post we discussed how Highland Park had the highest percentage of occupied rental units in the region at 64 percent. Between 2010 and 2015 there was an overall 6 percent increase. In 2010 there were about 5,000 occupied housing units of which about 3,050 were occupied rental units. In 2015 there were about 4,500 occupied housing units, of which 2,880 were occupied rental units.

Other areas to note that have experienced increases in the percentage of rental units are the inner-ring suburbs that border Detroit. For example, Redford experienced an 87 percent increase in occupied rental units between 2010 and 2015, Eastpointe experienced a 61 percent increase, Ferndale experienced a 46 percent increase, Warren and Hazel Park each experienced a 26 percent increases.


There were 42 municipalities that experienced a decrease in the percentage of rental units occupied between 2010 and 2015 in the region. Similar to the municipalities with among the highest percentage of occupied rental unit increases, those with the decreases also had smaller populations and housing stocks. For example, the city of Huntington Woods in Oakland County experienced a 35 percent decrease in the occupied rental units. However, in 2015 there were about 2,500 total occupied housing units, 77 of which were occupied rental units.


While we do know that the total number of rental units has increased over the years as a reflection of the economy and the housing crisis, this post also brings to light how a community’s overall housing stock must also be considered.

Percentage of Rentals on the Rise in Southeastern Michigan

Between 2010 and 2015, 72 percent of the communities in Southeastern Michigan experienced an increase in the percentage of homes that served as rentals, meaning majority of the communities experienced a decrease in residents serving as homeowners. Of those communities, there were 11 communities in Southeastern Michigan that experienced rental rate increases above 10 percent between 2010 and 2015. The city with the largest increase was Milan, located in Monroe County, at 20.2 percent. According to data from the U.S. Census Bureau, in 2010 23.1 percent of the homes in Milan served as rentals and by 2015 that increased to 43.3 percent.

At the county level, Wayne County experienced the largest increase in communities that saw rental rates increase. According to the data, 93 percent of the Wayne County communities experienced an increase in rentals between 2010 and 2015. Of those Wayne County communities, Belleville experienced the highest increase at 15.1 percent. In 2010, 27.4 percent of the homes in Belleville were rentals and by 2015 that increased to 42.4 percent.

Overall, the areas of Southeastern Michigan that experienced the greatest increase in the percentage of homes serving as rentals between 2010 and 2015 were Detroit, and its inner-ring neighbors, along with the western side of Macomb County. Of the inner-ring suburbs, Harper Woods experienced the highest percentage increase in homes being rented at 13.2 percent. In 2010, 24.7 percent of the homes were rentals and by 2015 that increased to 37.9. Just below Harper Woods was the city of Ferndale, another inner-ring suburb, with an increase of 12.8 percent. In 2010, 27.5 percent of the homes in Ferndale were being rented and by 2015 that increased to 40.3 percent. Eastpointe, Utica and Roseville, all Macomb County cities, two of which neighbor Detroit, came in just below Ferndale with rental rate increases at 12.2, 11.6 and 11.3, respectively. Of these three communities, Utica, which is in the northwestern part of Macomb County, had the highest percentage of rentals in both 2010 and 2015. In 2010, 35 percent of the homes in Utica were rentals and by 2015 that increased to 46.7 percent.

Of all the communities in Southeastern Michigan, Detroit ranked 60th when examining how rental rates increased between 2010 and 2015. In 2010 the percentage of homes being rented was 45.5 and in 2015 that increased to 50.6. Within the City’s limits there were six Census Tracts that experienced rental rate increases between 25 to 52 percent. A pocket of the city’s northwest side, near Palmer Park and Rosedale Park, appears to be experiencing rental rate increases up to 25 percent. There is also a pocket on the city’s west side that is experiencing a decrease in rentals. In Southwest Detroit there are seven Census Tracts that each have experienced a decline in the percentage of rental homes by up to 22 percent; there is a similar pocket with nine Census Tracts just west of Highland Park.


As our previous posts show our region has experienced hundreds of thousands of home foreclosures from 2010 through 2014 as part of the Great Recession. In all probability most of those homeowners have become renters, assuming they have not left the region. This explains much of the shift to rental ownership, though some could come from the construction of new rental properties or the demolition of homeowner properties. The foreclosures and decline in home ownership represent a massive loss in wealth for homeowners and a massive increase in revenue for rental owners.

Detroit’s Population Density Below Other Major Cities

In Detroit, there is about 677,000 people living in a 139 square mile area; this translates to about 4,900 people per square mile. Comparatively, in New York City the population density is about 28,000 people per square mile, in Washington D.C. it is about 11,000 people per square mile, in L.A. it’s about 8,500/square mile, in Chicago it is about 12,000/square mile and in San Francisco it is about 18,000/square mile. When looking at cities overseas some of those numbers double, if not triple.

Sparefoot.com, a website used to help individuals’ move,  recently created several data visualization images to show how low Detroit’s population density is compared to other large cities. To see this and read the article, click here.

The image below was also provided by them: