Past Election Recaps: Southeastern Michigan

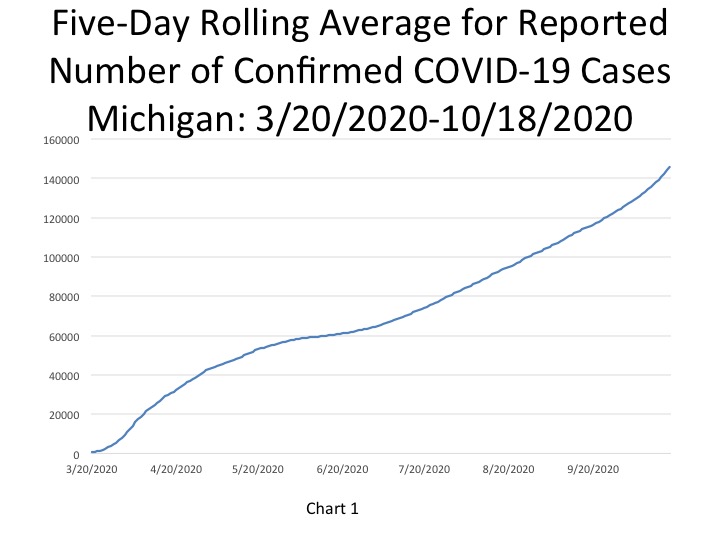
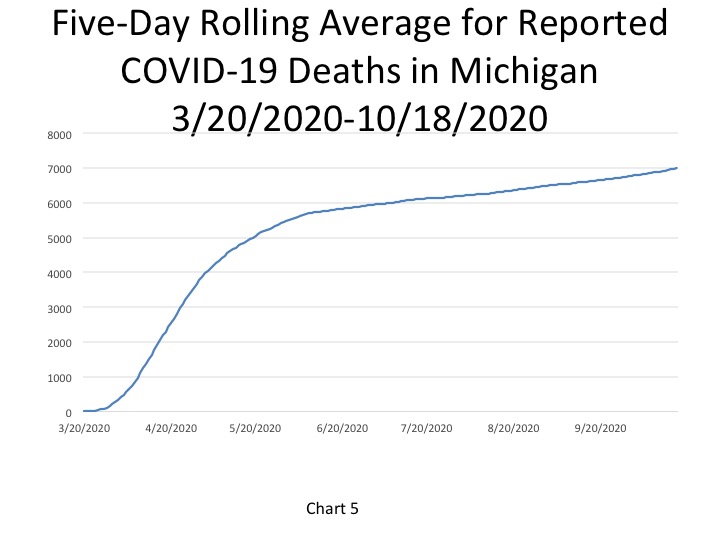
The Presidential Election is nearly two weeks away and according to FiveThirtyEight.com, a website focused on polling analysis, Presidential Democratic nominee Joe Biden is currently 7.6 points ahead in the polls over President Donald Trump, the Republic candidate running for re-election. Furthermore, the website predicts that Biden will win the state of Michigan. However, it was just a little over four years ago that Trump won the State of Michigan, turning a formerly blue state red. Trump won over then Democratic nominee Hillary Clinton by 0.23 percent of the popular vote. Overall, Trump took 47.5 percent of the total votes and Clinton took 47.3 percent of the vote. In 2012 though President Barack Obama, the then Democratic candidate up for re-election, won Michigan, helping assure his second term in the White House.

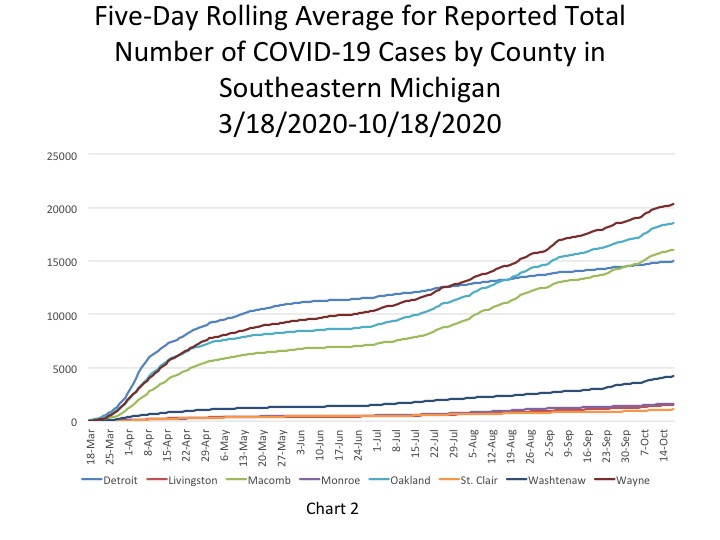
As the election nears we find it important to show you what areas in Southeastern Michigan voted for the Republican and Democratic nominees in both 2012 and 2016 and what areas flipped between those two elections. In the 2016 map we see that Detroit and its inner-ring suburbs (Ferndale, Royal Oak, parts of Warren, etc.), along with Ann Arbor and its surrounding cities to the east and west, had Clinton as the winning candidate. There was also a pocket in the City of Monroe that went to Clinton. However, a large share of the region went to Trump, including all of Livingston and St. Clair counties and majority of Macomb and nearly all of Monroe counties. Of course, Macomb County made national news as a strong reason why Michigan went to Trump in the 2016 election. Monroe County also made a significant switch between 2012 and 2016.

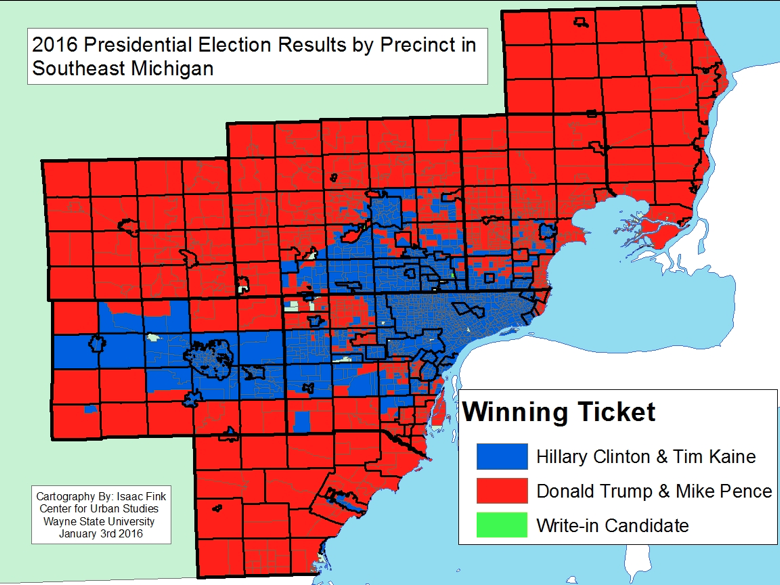
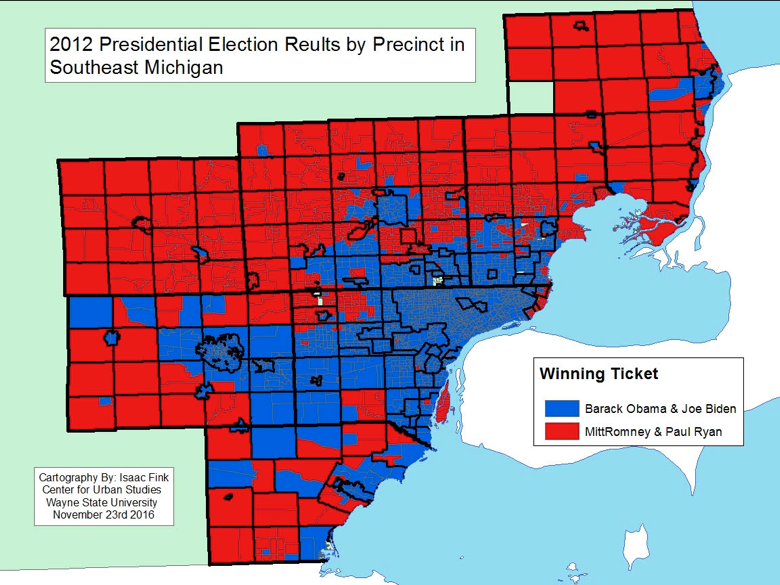
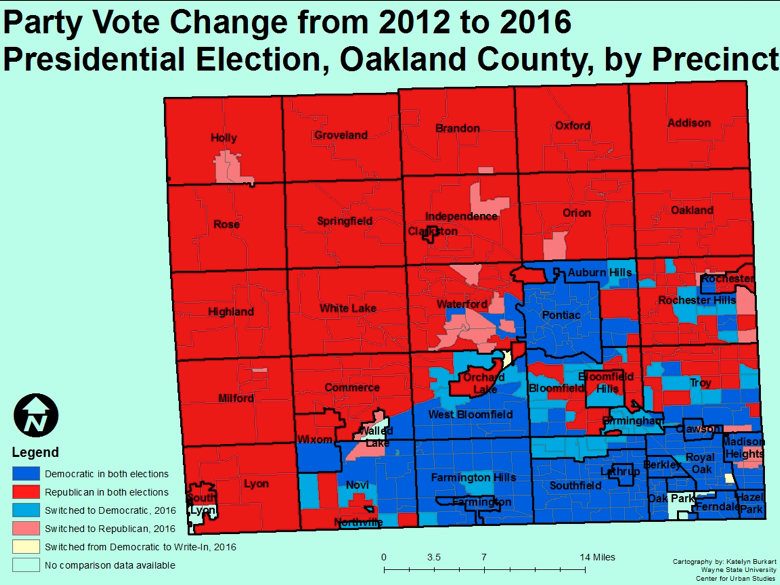
In 2012 we know that the State of Michigan went to Obama and that majority of the popular vote in Southeastern Michigan did the same.  For example, in Macomb County 47.5 percent of the vote went to then Republican nominee Mitt Romney and 51.5 percent went to Obama, according to the election results. In Wayne County 73 percent of the vote went to Obama while 26 percent went to Romney, according to election results. For Oakland County in 2012 then-Republican nominee (Romney) received 45 percent of the vote and the Democratic nominee (Obama) received 54 percent of the vote, according to county election results.

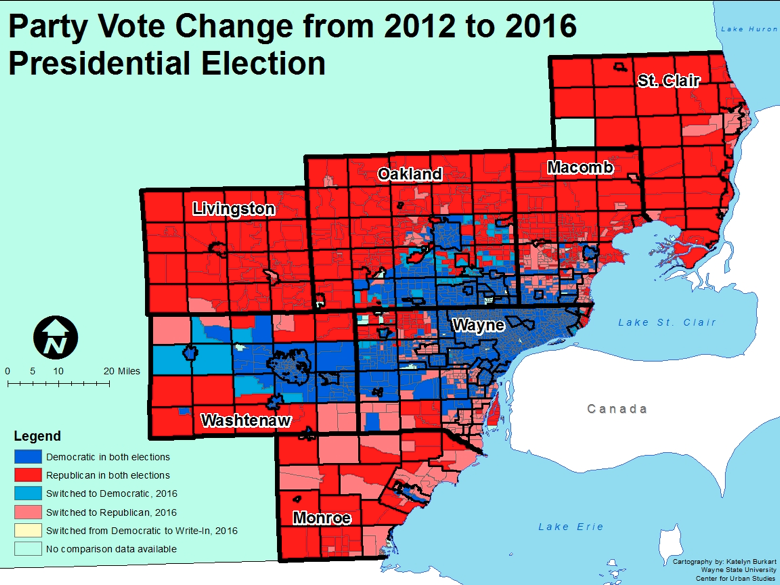
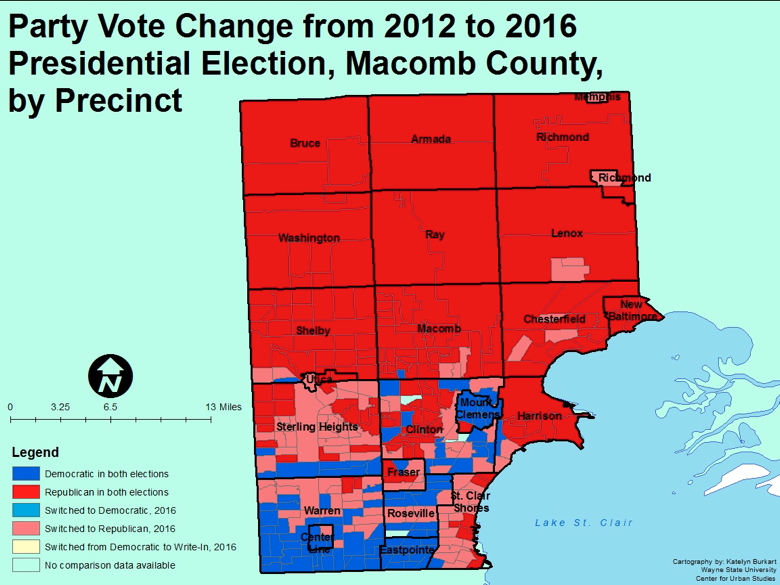
Now, when comparing the 2012 and 2016 results Macomb and Monroe counties are the two to focus on because of their flips between the last two elections. When drilling down into Macomb County we see that the central portion of Sterling Heights, the northern portion of Warren, majority of St. Clair Shores and pockets of precincts in Lenox, Chesterfield, Clinton, Harrison, Richmond and Shelby townships and in the cities of Fraser, Utica and Roseville flipped from Democratic to Republican precincts between the 2012 and 2016 elections. There was not one precinct in Macomb County that switched from Republican to Democrat between the 2012 and 2016 elections, according to county election results. Overall, in 2016 53.6 percent of the vote went to Trump in Macomb County while in 2012 47.5 percent of the vote went to then Republican nominee Romney, according to the election results. In Monroe County we see that the city of Monroe and Dundee, London, Erie, Exeter, Berlin and Rainsville townships switched from Democratic in 2012 to Republican in 2016. Similar to Macomb, there were no precincts in Monroe County that had the reverse switch, going from Republican in 2012 to Democratic in 2016. In Monroe County in 2016 58.4 percent of the votes went to Trump, according to the election results.

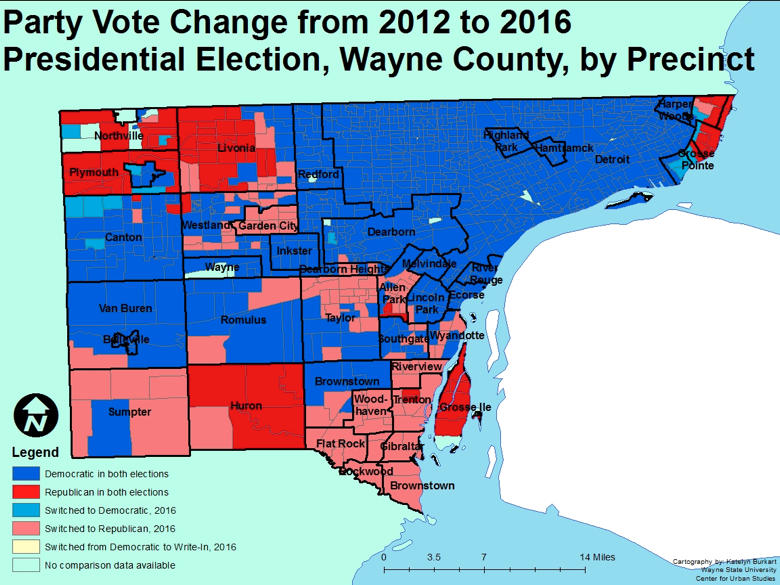
For Wayne County, while overall it went to Clinton in 2016 nearly all of the Downriver region (Trenton, Woodhaven, Flat Rock, Gibraltar, Rockwood, Brownstown, Riverview and portions of Wyandotte, Southgate, Taylor and Allen Park) switched from voting Democratic in the 2012 election to going for the Republican Presidential nominee (Trump) in 2016. Additionally, all of Garden City made that switch, as did portions of Huron, Sumpter and Van Buren townships, along with areas in Westland, Romulus and Livonia. Overall in Wayne County in 2016, 66 percent of the vote went to Democratic nominee Clinton and 29 percent went to Trump, according to the official Wayne County election results.

In Oakland County, overall, 44 percent of the voters voted for the Republican nominee (Trump) and 52 percent voted for the Democratic nominee (Clinton) in 2016, according to county elections results. In 2016, there were pockets of precincts-primarily in the Bloomfield-Birmingham area-that switched from Republican to Democratic and Birmingham made that switch nearly in its entirety.

Washtenaw County, unlike Macomb and Monroe counties, had several precincts in 2016 that switched from being Republican in 2012 to being Democratic in 2016. All precincts in Lima and Sylvan townships switched from Republican in 2012 to Democratic in 2016, and about half of the precincts in Dexter and Lodi townships did the same. Augusta and Lyndon townships did the opposite, switching from Democratic to Republican between the two elections.

Of course, while this data and the accompanying maps show the results of the 2012 and 2016 Presidential elections for Southeastern Michigan, for the upcoming election nothing will be decided until at least Nov. 3. It is our right and our duty to vote for the next president, and each and every vote matters.

Michigan’s New Daily COVID Numbers Continue to Rise Above 1,000

Michigan reported 1,586 new COVID cases on Oct. 20, 2020, bringing the total number of cases reported to 149,392. In Chart 1 we show that the State total for the number of COVID cases on Oct. 18 was 145,751–a five-day rolling average. The five-day rolling average for the total number of COVID cases (Chart 1) reflects a smoother curve and adjusts for fluctuations in testing and/or the quality of reporting or failure to report.

Chart 2 shows that, based on the five-day rolling averages, the growth of new COVID cases in Wayne, Oakland and Macomb counties continues to increase at higher rates than the other counties in the region and than Detroit. On Oct. 18, Wayne County reported the highest number of cases in the region at 20,322. Oakland County reported 18,589 cases and Macomb County reported 16,065. Detroit reported 14,969 COVID cases on Oct. 18; Macomb County surpassed the total number of confirmed cases in Detroit on Oct. 6. While the more densely populated areas in the region have the highest number of confirmed cases, Washtenaw County has pulled away from the other more rural counties in with higher numbers as well. Washtenaw County reported 4,190 confirmed cases on Oct. 18.

As shown in Chart 3, Oakland County reported the highest number of new daily confirmed cases on Oct. 18 at 94, followed by Wayne County with 78 new confirmed cases and Macomb County with 73. Washtenaw County reported 35 new daily confirmed COVID cases on Oct. 18 while Detroit reported 21. These numbers are also based on a five-day rolling average.

The daily data highlighted in these posts is from Michigan.gov/coronavirus, where data is updated daily at 3 p.m. Historical data were supplied from covidtracking.com, which republishes COVID data from the State. Additionally, the case totals do not reflect the number of people who have recovered, just those who have been infected. In early June the State changed how it reports its data on the website, making data more accurate in the long-term but more complicated to track as well. The State regularly updates older data and as we continue to publish regular updates on COVID the State’s changes to past data many not always be reflected in our posts. The data published in new posts is accurate for the day we received it on though.

The chart below (Chart 4) highlights how Wayne County not only has the highest number of confirmed total COVID cases in the region (this data does not include Detroit’s numbers) it also has the highest number of confirmed cases per capita. According to the data released on Oct. 20, Wayne County had 23,598 COVID cases per million people. Macomb County had the second highest number of confirmed cases per million people at 19,351. Detroit had 10,019 confirmed COVID cases per million people; the only two counties in the region with few number of cases per capita were Livingston and St. Clair counties.

In Chart 5, the five-day rolling average for the number of deaths, shows the number of deaths in the State of Michigan reached 6,996 on Oct. 18. The actual cumulative COVID-19 deaths on Oct. 20 was 7,053, an increase of 22 deaths from the prior day, with one of those deaths being added to the total through death record reviews. Chart 6 (a five-day rolling average) shows that on Oct. 18, the City of Detroit reported 1,546 deaths. Wayne County had the second highest total at 1,309 deaths on Oct. 18. Although the curved has flattened for the number of COVID deaths in Southeastern Michigan, the numbers are still growing, just at a much slower pace.

COVID-19 numbers in Michigan continue to increase at a quicker rate than what has occurred in months. Classrooms and gatherings some of the main areas where outbreaks are occurring. According to the State of Michigan, as of Oct. 15, there were outbreaks in 84 Michigan school buildings in 31 counties. Overall, between Oct. 8 and Oct. 15 there was a 25 percent increase in K-12 classroom outbreaks. Furthermore, universities are also seeing increases in the student population contracting COVID. To slow the spread within this community some universities and local health departments are taking their own precautions. For example, the Washtenaw County Health Department just issued a 2-week stay at home order for University of Michigan undergraduate students to curb the spread. In Washtenaw County last week the number of new confirmed and probable COVID cases increased by more than 600. 

As the daily number of confirmed COVID cases continue to increase by more than 1,000 daily we must continue practice the mandates set forth by the Michigan Department of Health and Human Services, which includes wearing masks, remaining socially distant and limiting social gatherings.

A Look At Michigan’s Local Income Taxes

In the State of Michigan local governments have the ability to levy a local income tax on those who live and/or work in the municipality. There are 24 municipalities in Michigan that levy a local income tax for residents, non-residents and corporations. According to the Citizens Research Council of Michigan, the cities of Detroit and Hamtramck were the first two municipalities in the state to levy local income taxes in 1962. As of 2018 Detroit levied at 2.4 percent income tax on residents and a 1.2 percent income tax on non-residents. In Hamtramck, a 1 percent income tax was levied on residents and a 0.5 percent income tax was levied on non-residents. According to Michigan tax law, and as is shown, non-residents cannot be taxed more than 50 percent of the local income taxed on residents. 

According to Michigan tax law, in general, a 1 percent income tax can be charged on residents and corporations and a 0.5 percent income tax can be changed to non-residents earned in the imposing city. The city council in cities over 600,000 (Detroit) may impose rates of up to 2.4 percent on residents, 2 percent on corporations and 1.2 on non-residents. Furthermore, a city that levied an income tax and where more than 22 mills had been levied for city purposes and at least 65 mills for all purposes during the prior calendar year is allowed to impose local income tax rates of up to 2 percent on residents and corporations and 1 percent on non-residents if approved by voters before Nov. 15, 1988. Additionally, cities that levied an income tax before March 30, 1989, and with (a) populations between 140,000 and 600,000 (Grand Rapids); or (b) populations between 65,000 and 100,000 in a county with a population below 300,000 (Saginaw) may increase the tax rate to not more than 1.5 percent on residents and corporations and 0.75 percent on nonresidents if approved by voters. 

According to the State of Michigan, Detroit has the highest income tax at 2.4 percent, followed by the City of Highland Park at 2 percent (both of which are imposed on residents). A 2 percent local income tax was imposed on corporations in Detroit and Highland Park as recent as 2018, according to the Citizens Research Council. 

 In 2017 (most recent data available) Detroit levied about $292.7 million through its local income tax on residents, non-residents and corporations; Hamtramck levied $2.3 million Grand Rapids and Sagniaw each levied 1.5 percent income taxes on residents and corporations. Grand Rapids levied the second highest amount in local income taxes at about $94 million. Of course, the amount each city levies is not only dependent on the amount levied by the three groups but also by the population of who lives there, who works there and what businesses are there. 

In addition to the cities above the, the following cities issue income taxes of 1 percent on residents and corporations:

  • Albion
  • Battle Creek
  • Benton Harbor
  • Big Rapids
  • East Lansing
  • Flint
  • Grayling
  • Hamtramck
  • Hudson
  • Ionia
  • Jackson
  • Lansing
  • Lapeer
  • Muskegon
  • Muskegon Heights
  • Pontiac
  • Port Huron
  • Portland
  • Springfield
  • Walker

The city that earned the lowest amount in a local income tax is Hudson at about $484,000.

In addition to the cities discussed above, the City of Mount Clemens has also discussed levying a local income tax to earn more local revenue. Mount Clemens is the county seat in Macomb County, which employs about 2,000 county employees. Local income taxes are a means for a local government to generate additional revenue. And, while it helps the local governments–especially ones who lack additional means to levy revenue–it also impacts those who live in the municipality and those who work and/or own a business there. 

How Much of Your County Budget Goes to the Sheriff’s Department?

A government entity’s budget is the document that spells out its priorities, both for the coming year and the future. The general fund is the primary fund used by a government entity and includes all general purpose in-and-out flows of revenues and expenditures that do not include special purpose, or enterprise, funds. At the county level in Southeastern Michigan the general fund budgets may be hundreds of million dollars, being larger for counties with larger population sizes. For example, in Wayne County the projected general fund budget for fiscal year 2021 is about $580 million while Macomb County’s proposed general fund budget for 2021 is $274.5 million, and Monroe County’s is about $46.8 million. Those general fund budgets, and the budgets of the other counties in the region, include personnel and operational costs for the counties. Typically, sheriff’s departments have among the highest departmental budgets in a county, with personnel and related costs making up majority of their expenditures. From road patrol to jail personnel to marine patrol to office support, the amount allocated out of a sheriff’s department budget covers various aspects. According to Statisa, major municipalities spend 20-45 percent of their general fund budgets on police related matters. The data in this post shows the general fund share of Sheriff’s Departments and is in line with that statistic.  It further shows that policing and jail operations at the County level are high-level priorities, according to  the percentage each sheriff’s department in Southeastern Michigan makes up of the corresponding general fund.

As shown in the map above 24-46 percent of each county’s general fund is allocated to the sheriff’s department (only Washtenaw and Oakland counties currently have adopted budgets for 2021, the others are proposed and/or projected). It should also be noted that much of those allocated funds do not include forfeiture or other special enterprise funds a sheriff’s department may have access to. Each department’s budget isn’t identical to its neighboring counties’, so while comparing each local sheriff’s department’s spending out of the General Fund is not apples-to-apple, it does provide a solid glimpse into each county’s priorities in spending. According to our research, the percentage of funds allocated to the sheriff’s department from the general fund in Washtenaw County is the highest at 46 percent; this is equivalent to about $57.1 million and includes the sheriff’s department, the corrections department and the emergency services department. Washtenaw County does not present its budget in a roll-down line item manner, which provides the greatest amount of detail, so exact reasons as to why it has the highest percentage of its general fund allocated to the sheriff’s department is not explicitly known. In the Washtenaw County budget though it did address how the department contracts with various municipalities for policing services; this brings in revenue but also in response causes expenditures as well. Contracted policing services are likely one of several reasons why the budget allocation percentage is 46 percent. Revenue from a public safety and mental health millage to support sheriff’s operations could also be related to the corresponding expenditures. Finally, the county also runs a central dispatch center. The Livingston County Sheriff’s Department is the only other one locally where more than 40 percent of the county’s general fund is allocated to the sheriff’s department. In Livingston County 42 percent of the general fund, or $51.4 million, is allocated.

Wayne County has the lowest percentage of general funds allocated to the sheriff’s department at 24 percent, or $141.3 million. For Wayne County, these allocated funds include those for the operation of the county jail (the building of the new jail is funded separately), non-jail services, sheriff court services and those related to the sheriff’s executive team. Macomb County has the second lowest percentage allocated at 33 percent, or $89.3 million. The funds allocated to the sheriff’s department in Macomb County include the patrol, jail and marine personnel, jail operations and other related items. In Oakland County 34 percent of the general fund ($165.9 million) is allocated to the sheriff’s department, and this includes corrective services, emergency communication services and emergency response and preparedness. Monroe County allocates 38 percent of its general fund budget to the sheriff’s department. Monroe County’s allocation includes road patrol, contracting with local municipalities and school units, marine safety and the jail; this totals $18 million.

The budget information available for St. Clair County was from previous years; current data was requested but not received.

While this post highlights budget spending priorities on policing and jail services in Southeastern Michigan, it also shows how budgeting from one local unit of government to another differs and can distort how much one department is actually receiving or expending. Reasons such as these are among many that explain why the public should pay close attention to how their local governments’ budgets and what the funds are allocated to. A budget document sets the priorities, and if the public speaks up, the priorities in your community can be shifted, as can the funds to support them. 

Michigan New Daily COVID Case Numbers Reach Above 1,000

Michigan reported 1,016 new COVID cases on Oct. 7, 2020, bringing the total number of cases Michigan reported to 130,842. In Chart 1 we show that the State total for the number of COVID cases on Oct. 5 was 129,077–a five-day rolling average. The five-day rolling average for the total number of COVID cases (Chart 1) reflects a smoother curve and adjusts for fluctuations in testing and/or the quality of reporting or failure to report.

Chart 2 shows that, based on the five-day rolling averages, the growth of new COVID cases in Wayne, Oakland and Macomb counties continues to increase at higher rates than the other counties in the region and than Detroit, which once had the highest number cases until late July. Wayne County’s case numbers surpassed Detroit then, Oakland County’s case numbers surpassed Detroit in mid-August and Macomb County’s case numbers surpassed Detroit’s this month.  On Oct. 5, Wayne County reported the highest number of cases in the region at 19,031. Oakland County reported 17,192 cases and Macomb County reported 14,754. Detroit reported 14,597 COVID cases on Oct. 5

In addition to having the highest number of total COVID cases Wayne County in the region, Charts 3 and shows that it also had the highest number of daily cases on Sept. 21. Wayne County reported 25 new cases on Oct. 5, as did Macomb County. For at least the last week Wayne and Macomb counties have reported the highest number of new daily confirmed cases regionally. On Oct. 5 Oakland County reported 16 new cases and Detroit reported 10 new cases; these numbers may not have been fully updated by the State at the time of reporting. For example, on Oct. 4 the five-day rolling average for the number of new confirmed cases for Wayne County was 85, for Macomb County it was 78, for Oakland County it was 77 and for Detroit it was 25.

The daily data highlighted in these posts is from Michigan.gov/coronavirus, where data is updated daily at 3 p.m. Historical data were supplied from covidtracking.com, which republishes COVID data from the State. Additionally, the case totals do not reflect the number of people who have recovered, just those who have been infected. In early June the State changed how it reports its data on the website, making data more accurate in the long-term but more complicated to track as well. The State regularly updates older data and as we continue to publish regular updates on COVID the State’s changes to past data many not always be reflected in our posts. The data published in new posts is accurate for the day we received it on though.

In Chart 4, the five-day rolling average for the number of deaths, shows the number of deaths in the State of Michigan reached 6,821 on Oct. 5. The actual cumulative COVID-19 deaths on Oct. 7 was 6,847, an increase of 8 deaths from the prior day. Chart 5 (a 5-day rolling average) further hones in on how majority the number of COVID related deaths has continued to remain flat for some time in Southeastern Michigan. On Oct. 5, the City of Detroit reported 1,537 deaths. Wayne County had the second highest total at 1,296 deaths on Oct. 5.

Michigan continues to battle the pandemic and while the recent Michigan Supreme Court ruling has left several answers about the Governor’s executive orders answered, one thing remains certain. We all must continue to wear masks, keep a responsible distance from others and respect scientific facts. Although the Governor’s orders are set to expire at the end of this month, the Michigan Department of Health and Human Services has since issued an order mandating masks, and certain local government units have followed suit.

Lead Testing Must Remain a Priority in Michigan

Throughout all of Wayne County,  Detroit had the highest number of children under the age of 6 with elevated blood levels at or above 5 ug/dL, according to the most recent data released by the Michigan Department of Health and Human Services. This document details blood lead levels for children under the age of 6 across the State of Michigan was published in 2020; the data is from 2018. According to the Centers for Disease Control, 5 ug/dL is used as a reference level by experts “to identify children with blood lead levels that are much higher than most children’s levels.” The CDC has recommended that public health actions be initiated in children under age 6 with blood lead levels above 5 micrograms per deciliter (µg/dL). Babies and young children can be more highly exposed to lead because they often put their hands and other objects that can have lead from dust or soil on them into their mouths.

When examining the first map below, which of Wayne County and Detroit by zip codes, we see that the 48210 zip code (which is in Detroit) had 118 children under the age of 6 with elevated blood levels at or above 5 ug/dL. There were 9 zip codes in the City of Detroit where 70 or more children under the age of 6 had elevated blood levels at or above 5 ug/dL. In total, there were more than 1,200 cases of children under the age of 6 who had elevated blood levels at or above 5 ug/dL, according to the data. When looking at the percentage of children under the age 6 with elevated blood lead levels, Detroit again had the highest statistic locally. As shown in map 2, the 48206 zip code had the highest percentage of children under the age of 6 with elevated blood levels at or above 5 ug/dL at about 18 percent. This same zip code (48206) had 99 children under the age of 6 with elevated blood lead levels. For the zip codes that make up Detroit, between 1 and 18 percent of children under the age of 6 had elevated blood lead levels. There were eight zip codes in the City where 10 percent of more of the children under the age of 6 had elevated blood lead levels. 

Outside of the City of Detroit and Highland Park, Taylor had among the highest number of children under the age of 6 with elevated blood levels at 10 in Wayne County, which was equivalent to 1 percent of the children tested having the elevated blood levels. Additionally, none of the other zip codes in Wayne County where children were tested for elevated blood lead levels had more than 2.2 percent of children under the age of 6 with elevated blood levels. 

While the data shows that in the Metro-Detroit area cities like Detroit and Highland Park, which have median household incomes below that of the State of average and several cities in the area, have among the highest number and percentage of children with elevated blood lead levels there are pockets elsewhere in the State. For example, in Muskegon, 8 percent of the children below the age of 5 had elevated blood lead levels, which was equivalent to 64 children, according to the Michigan Department of Health and Human Services. 

Overall, blood lead level testing has declined by 61 percent in the State of Michiganin March, April and May compared to last year, according to a recent Lansing State Journal article that reported Michigan Department of Health and Human Services data. Furthermore, in the article Thomas Largo, Michigan Department of Health and Human Services environmental health surveillance section manager said some of the most concerning declines in testing were in high-risk cities such as Lansing, Flint and Detroit.

While we continue to fight the COVID-19 pandemic we cannot divert our attention from public health matters such as lead poisoning. The risk of lead poisoning doesn’t stop just because we stop paying attention to it. Funding for and the action of testing must continue, as should actions to mitigate the causes of lead poisoning.