Catholics represent largest religious population in Southeastern Michigan

In the seven-county region there are several different religious denominations represented. We examine the rate of religious membership to some of the most prevalent denominations in the region. In the following maps,  the percentage of residents who claim active membership with these groups will be shown using data from the Association of Religious Data (ARD) and the 2010 American Religious Census; the  definitions for these groups are provided below by the ARD.

Catholicism: A form of Christianity where there is a hierarchy of bishops, priests and the pope. In the Catholic Church priests must also be celibate.

Mainline Protestantism :Typically moderate and liberal theological denominations that include the United Church of Christ, Methodist Church and the Episcopal Church.

Evangelical Protestantism: A more conservative movement in the Protestant Church that emphasizes the importance of sharing ones’ faith with non-believers, which is focused on a strong personal relationship with Christ. Examples include Baptists, Anabaptists, Church of God and Pentecostals among others

Black Protestantism: A branch of Protestantism that is similar to Evangelical Protestant denominations. African American protestants focus on the importance of justice and freedom. Such denominations include  the National Convention Baptist of America and the African Methodist Episcopal Zion; there are seven major denominations.

Islam: Muslims follow the text of the Koran and focus on the “oneness of God”. There are five pillars practiced in Islam: praying, fasting, almsgiving, pilgrimage and testimony of faith. The two divisions of Islam are Sunni and Shi’a.

Judaism: This is based on texts in the Hebrew Bible

Orthodox Christianity: This includes both Eastern Orthodox Christians and Oriental Christians. In these forms of Christianity there is no central form of leadership.

Latter Day Saints: Also known as Mormonism, this religion is guided by the Book of Mormon and aspects of the Bible. They seek to restore the New Testament.

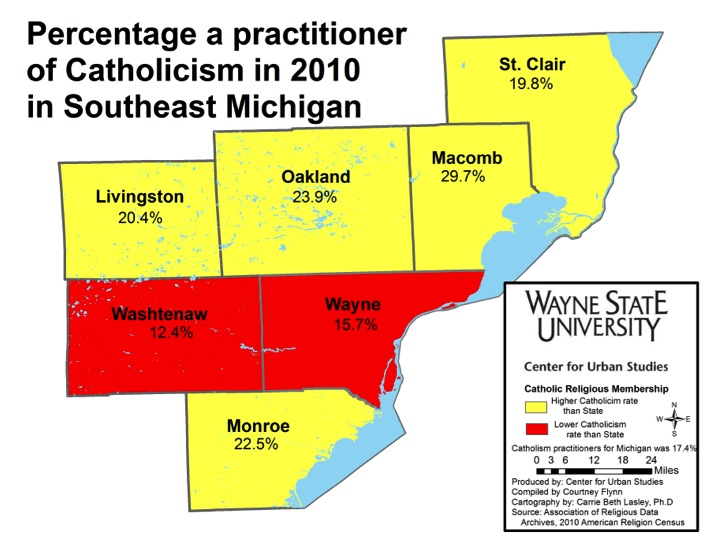
Those who identify themselves as Catholics in the region represent the largest religious based population. The state percentage of Catholics was 17.4 percent. Two counties in the region (Wayne and Washtenaw) where the Catholic population was below that percent. Macomb County had the largest population of Catholics in the region at  29.7 percent.

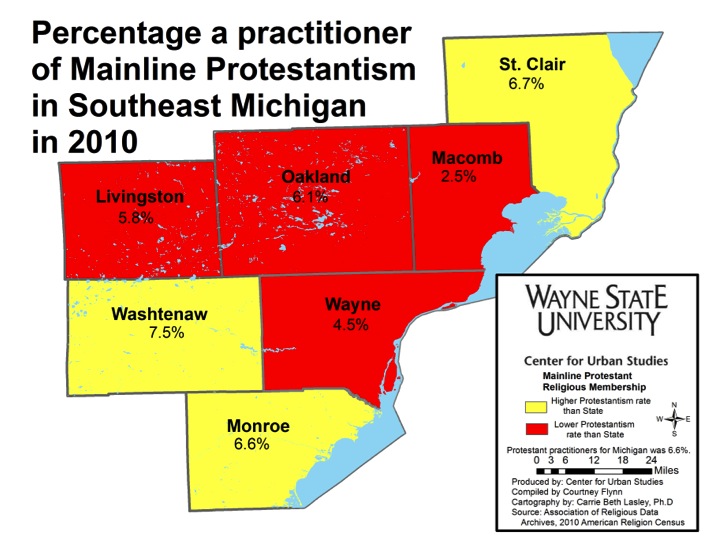
Macomb County had the lowest percent of residents (2.5%) who identified themselves as Mainline Protestants. With the state average being 6.6 percent, Washtenaw (7.5%), Monroe (6.6%) and St. Clair (6.7%)counties were the only ones in the region that were above the state average.

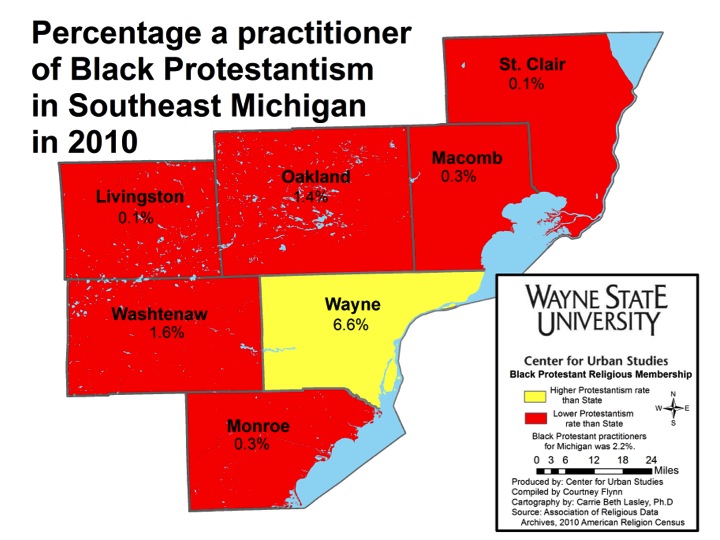
Wayne County had the largest percent of Black Protestant practitioners in the region at 6.6 percent. The county with the second highest population of Black Protestant practitioners was Washtenaw County and that percentage (1.6) was 5 percentage points below Wayne County and .6 percentage points below the state average (2.2%). The City of Detroit is in Wayne County, where the largest African American population resides.

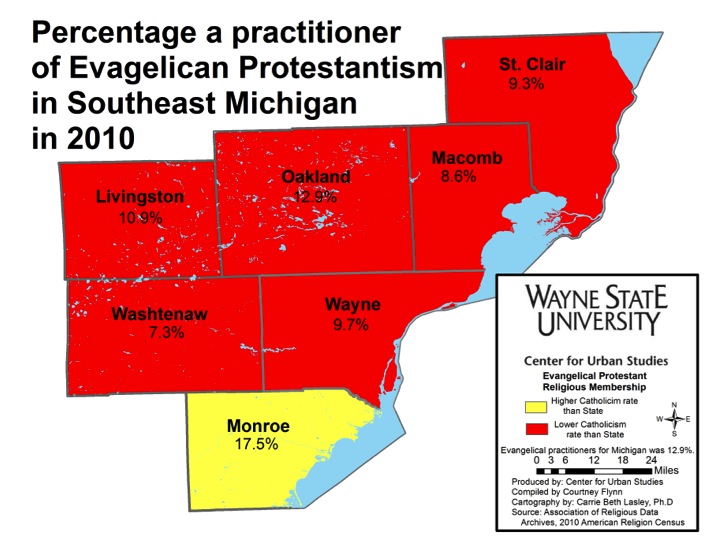
Overall, Evangelical Protestants represent more of the state’s and region’s population than do Mainline or Black Protestants. According to the data, state average for Evangelical Protestants is 12.9 percent. In Monroe County, 17.5 percent of the population is comprised of residents who identify themselves as Evangelical Protestant practitioners; this is the only county in the region above the state average. Washtenaw County had the lowest representation at 7.3 percent.

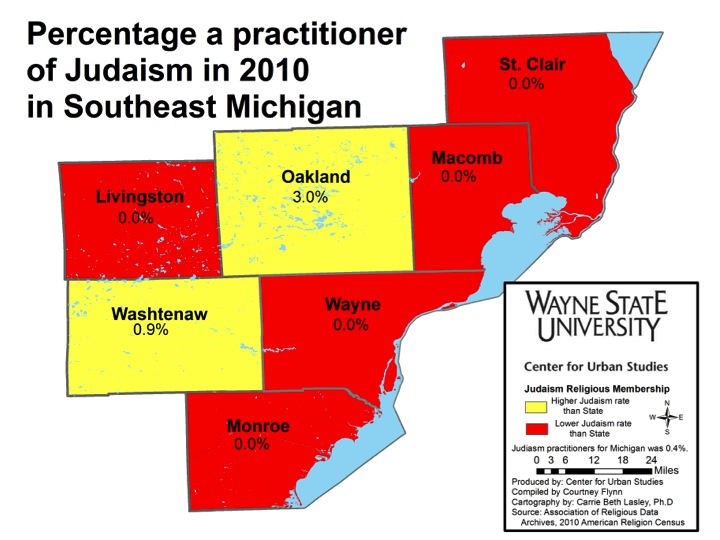
The state average for Judaism practitioners was 0.4 percent and five the seven counties in the region were below this average with 0.0 percent of their population being affiliated with this religious group. Oakland County had the highest population at 3.0 percent. The Holocaust Memorial Museum of Michigan is located in Oakland County, as is the Jewish Federation of Metropolitan Detroit.

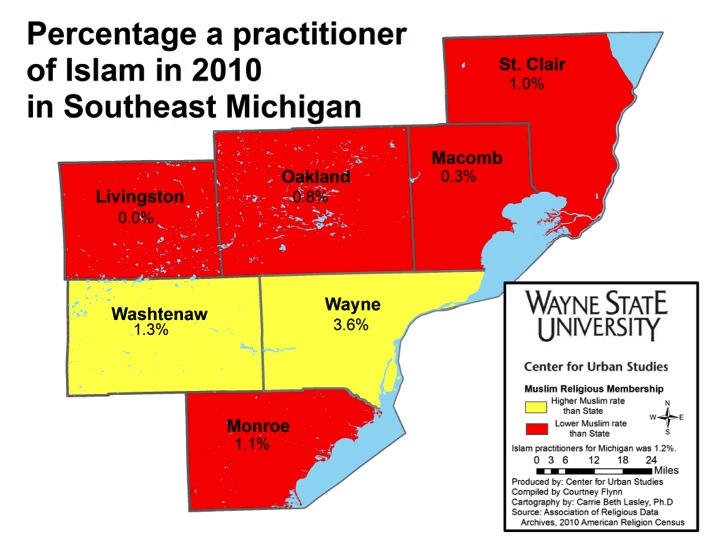
Those who are members of the Muslim religious group in Southeast Michigan were most heavily represented in Wayne County at 3.6 percent, above the state average of 1.2 percent; the City of Dearborn is located in Wayne County. The only other county above the state average was Washtenaw County where 1.3 percent of the population identified as being a practitioner of Islam.

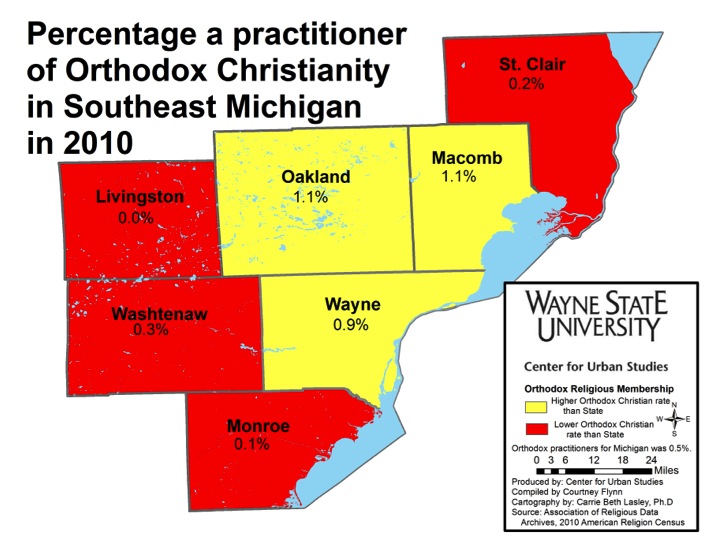
The state average for those who practice Orthodox Christianity was 0.5 percent; Wayne (0.9%), Oakland (1.1%) and Macomb (1.1%) were the only counties in the region above the average. Livingston County was the only one in the region where 0.0 percent of the population stated that they did not affiliate with this religious group.

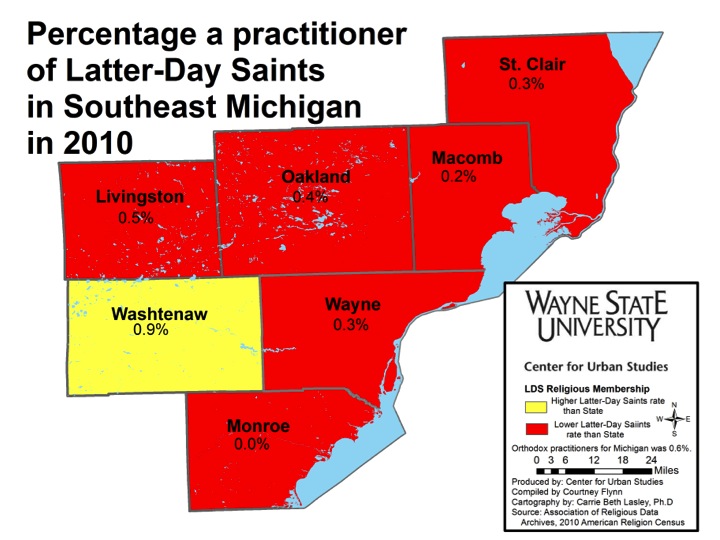
The Church of Latter Day Saints is one of the religious groups in the region that has a lower representation. Washtenaw County was the only county in the region above the state average of 0.6 percent; with practitioners representing 0.9 percent of the population.

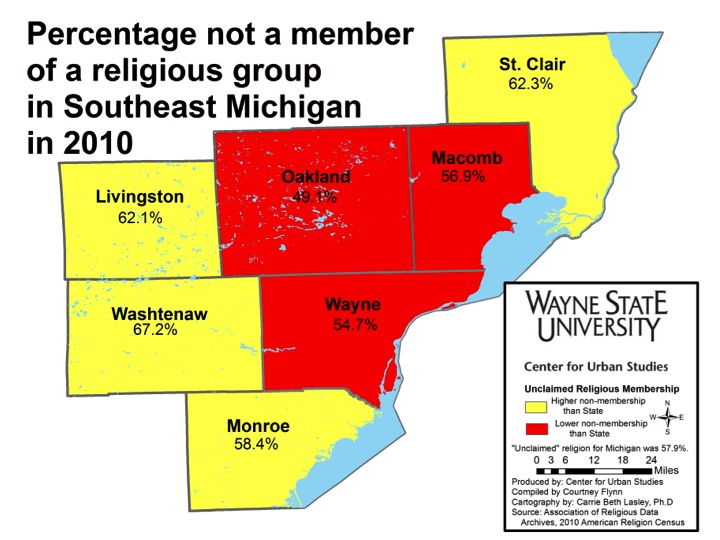
This map shows the percentage of people in the region who either don’t affiliate with a religion or who aren’t associated with the most common religions discussed in this post. The percentages represented in the map above are not directly correlated with irreligion or atheism. According to the data, in the state of Michigan, 57.9 percent of the population did not identify with one of the common religious groups or with one at all. St. Clair, Washtenaw, Livingston and Monroe Counties were above  the state average with Washtenaw County having the largest population at 67.2 percent.

A closer look at the National Assessment of Education Progress (NAEP)

We noted in a previous post that students in Michigan and Detroit post weaker performances on the National Assessment of Educational Progress (NAEP) than states across the country, particularly Minnesota. For many years, researchers have attempted to identify factors associated with NAEP scores, which would be of considerable interest to stakeholders who want to address Michigan and Detroit’s NAEP performance. Here, we will briefly summarize some of these factors and selected research addressing them.

For several reasons, NAEP scores in mathematics and reading have been of primary interest to researchers. Much of the research on NAEP score predictors, therefore, focuses on performance in these two subject areas.

Given the primacy of demographic factors such as race, ethnicity, and gender in education research, researchers have also asked whether these variables might predict students’ NAEP performance. For example, Vanneman et al. (2009) and Hemphil & Venneman (2011) noted achievement gaps in NAEP mathematics scores between African-American and White students and between White and Hispanic students. A number of peer-reviewed studies also identify race as a factor in NAEP results (Tate, 1997; Fuchs & Reklis, 1994; Thomas & Stockton, 2003). Some studies explore this factor at a greater depth; for example, Card & Rothstein (2007) attribute the race/ethnicity gap (though using SAT, not NAEP scores) to racial segregation of particular geographic areas, while Lubienski (2006) finds that varying test modes for NAEP mathematics appears to have little or no impact on performance.

There is less evidence for the influence of gender on NAEP scores (Abedi & Lord, 2001; Tate, 1997; Hyde & Linn, 2006; Guthrie et al., 2001), though Thomas and Stockton (2003) identify a small positive relationship between female students and NEAP reading scores and McGraw and colleagues (2006) find a negative relationship between female students and NAEP mathematics scores.

The results are also fairly consistent for socioeconomic status (SES). Biddle (1997) and McQuillan (1998) find a negative relationship between poverty and NAEP scores while Abedi & Lord (2001) and Nelson et al. (2003) find a negative relationship between Free lunch/Aid to Families with Dependent Children (AFDC) status and NAEP scores. Byrnes (2003) and Fuchs & Reklis (1994) find a positive association between parental education levels and students’ 12th and 8th grade NAEP math scores, respectively. Using 1996 NAEP data, Lubienski (2002) finds that SES factors such as parent education and number of literary resources in the home do not explain the African-American/White achievement gap discussed above. Inherent in these studies is, of course, the selection and validity of individual-level or school-level (e.g., Title I designated school) definitions of SES (Thomas & Stockton, 2003).

Some researchers have also considered other literacy-related factors and their possible effect on NAEP scores. For instance, Abedi et al. (2001) and Abedi and Lord (2001) find that English Language Learner (ELL) and Limited English Proficiency (LEP) statuses are negatively related to NAEP mathematics performance. Length of stay in the United States appears to be positively associated with NAEP mathematics performance (Abedi et al., 2001). Access to printed reading material (McQuillan, 1998) and access to school and public libraries (Krashen et al., 2012) also appear to be positively associated with NAEP reading scores.

In general, coursework and related preparation seem to be consistent predictors of NAEP scores. Tate (1997), Abedi & Lord (2001), and Abedi et al. (2001) find that advanced mathematics preparation and coursework are positive predictors of NAEP math scores. Guthrie et al. (2001) and Pinnell et al. (1995) find that reading opportunities and reading prosody, respectively, are positively associated with NAEP reading performance. Abedi et al. (2001) find evidence of a positive association between students’ overall grades since 6th grade and NAEP mathematics performance.

Some authors have considered more systemic or institutional factors in their NAEP research, though this research is less consistent and (less?) extensive. Lubienski (2006) finds a positive association between NAEP math scores and (1) collaborative problem-solving instruction, (2) teacher knowledge of National Council of Teachers of Mathematics (NCTM) standards, and (3) certain ‘reform-oriented’ teaching practices such as non-number math strands. Guthrie (2001) finds that balanced reading instruction is positively associated with Grade 4 NAEP Reading Comprehension in Maryland. Grissmer et al. (2000) and Fitzpatrick (2008) find that greater levels of Kindergarten and pre-Kindergarten participation are positively associated with NAEP scores. Carnoy & Loeb (2002) find a positive association between gains in NAEP mathematics results and strength of state accountability (based on high-stakes testing to sanction and reward schools), but no effect on 9th grade retention rates. In a study supported by the American Federation of Teachers (AFT), Nelson et al. (2003) find that charter school attendance, especially in autonomous charter schools in urban areas, are negatively associated with NAEP math and reading test scores. Nevertheless, institutional factors such as these are not definitive in the literature, and their results should be viewed with caution.

Those who are interested in understanding why Michigan and Detroit students lag behind the rest of the nation in NAEP scores might explore some of the variables discussed above. There is not, however, any one variable or combination of variables that appears to serve as a sole and consistent predictor of NAEP performance, and this will pose a challenge for both understanding and devising solutions to the matter.

Bibliography

Abedi, J. & Lord, C. (2001). The language factor in mathematics tests. Applied Measurement in Education 14(3), 219-234.

Abedi, J., Lord, C., & Hofstetter, C. (2001). Impact of selected background variables on students’ NAEP math performance. Center for the Study of Evaluation, University of California, Los Angeles.

Biddle, B.J. (1997). Foolishness, dangerous nonsense, and real correlates of state differences in achievement. Phi Delta Kappan 79(1), 8-13.

Byrnes, J.P. (2003). Factors predictive of mathematics achievement in white, black, and Hispanic 12th graders. Journal of Educational Psychology 95(2), 316-326.

Card, D. & Rothstein, J. (2007). Racial segregation and the black-white test score gap. Journal of Public Economics 91(11) 2158-2184.

Carney, M. & Loeb, S. (2002). Does external accountability affect student outcomes? A cross-state analysis. Educational Evaluation and Policy Analysis 24(4), 205-331.

Fitzpatrick, M.D. (2008). Starting school at four: The effect of universal pre-kindergarten on children’s academic achievement. The B.E. Journal of Economic Analysis & Policy 8(1) 1-38.

Fuchs, V.R. & Reklis, D.M. (1994). Mathematical achievement in eighth grade: Interstate and racial differences. National Bureau of Economic Research. Working Paper No. 4784.

Grissmer, D., Flanagan, A., Kawata, J., & Williamson, S. (2000). Improving Student Achievement: What state NAEP test scores tell us. RAND Corporation.

Guthrie, J.T., Schafer, W.D., & Huang, C.W. (2001). Benefits of opportunity to read and balanced instruction on the NAEP. Journal of Educational Research 94(3), 145-162.

Hemphil, F.C. & Vanneman, A. (2011.) Achievement gaps: How Hispanic and white students in public schools perform in mathematics and reading on the national assessment of educational progress. Statistical Analysis Report. NCES 2011-459. National Center for Education Statistics.

Hyde, J.S. & Linn, M.C. (2006) Gender similarities in mathematics and science. Science-New York Then Washington 314(5799), 599.

Krashen, S., Lee, S., & McQuillan, J. (2012). Is the library important? Multivariate studies at the national and international level. Journal of Language & Literacy Education 8(1), 27-36.

Lubienski, S.P. (2002). A closer look at the black-white mathematics gaps: Interactions of race and SES in NAEP achievement and instructional practices data. Journal of Negro Education 71(4), 269-287.

Lubienski, S.P. (2006). Examining instruction, achievement, and equity with NAEP mathematics data. Education Policy Analysis Archives 14(14), 1-33.

Mcgraw, R., Lubienski, S.P., & Strutchens, M.E. (2006). A closer look at gender in NAEP mathematics achievement and affect data: Intersections with achievement, race/ethnicity, and socioeconomic status. Journal for Research in Mathematics Education 37(2), 129-150.

McQuillan, J. (1998). The literacy crisis: False claims and real solutions. Portsmouth, NH: Heinemann.

Nelson, F.H., Rosenberg, B., & Van Meter, N. (2003). Charter school achievement on the 2003 National Assessment of Educational Progress. American Federation of Teachers, AFL-CIO.

PInnell, G.S., Pilulski, J.J., Wixson, K.K., Campbell, J.R., Gough, P.B., & Beatty, A.S. (1995). Listening to children read aloud: Data from NAEP’s integrated reading performance record (IRPR) at grade 4. National Center for Education Statistics.

Thomas, J. & Stockton, C. (2003). Socioeconomic status, race, gender, & retention: Impact on student achievement. Essays in Education 7.

Tate, W.F. (1997). Race-ethnicity, SES, gender, and language proficiency trends in mathematics achievement: An update. Journal for Research in Mathematics Education 28(6), 652-679.

Vanneman, A., Hamilton, L., Anderson, J.B., & Rahman, T. (2009). Achievement gaps: How black and white students in public schools perform in mathematics and reading on the National Assessment of Education Progress. Statistical Analysis Report. NCES 2009-455. National Center for Education Statistics.

NYT: Minnesota easily reins in carbon emissions

According to the New York Times,  Minnesota continues to mandate strict energy regulations, a fete that residents easily comply with. The article showcases how the state uses more wind energy than all but four states in the country and has reduced its carbon emissions by about 33 percent since 2003. To read more click here.


Detroit vacancies increase from September 2013 to March 2014

According to data provided by the US Postal Service, residential vacancies have increased by 1,502 from January 2014 to March 2014. From September 2013 to March 2014 vacancies increased by over 2,000. According to USPS, they determine that a residency is vacant if an occupant has not collected their mail for 90 days are more.

The Center for Urban Studies creates a data base with this information and it provides a more in-depth look at the vacancies. The USPS publicly releases the vacancy data on a quarterly basis; this is possible through an agreement with the U.S. Department of Housing and Urban Development.

Region’s percentage of Asian residents higher than state average

As we continue to explore what makes up Southeast Michigan’s population we find that those of Asian descent make up a growing proportion of certain communities’ populations. This post examines both the percentage of residents of Asian descent in each community in the region along with their background.

In this post we see that although some counties have an overall higher percentage of Asian residents than others, there are pockets throughout the region with much higher proportions of Asians than what exists in their county or in the region.

Overall, the average percent of Michigan residents with Asian ancestry was 2.4 percent, according to the 2012 5-year estimates of the American Community Survey. In the seven-county region, three of the seven counties are below this average (Monroe, Livingston and St. Clair counties). The county with the highest population of residents of Asian descent in the region was Washtenaw County; 7.9 percent of its indicated an Asian background.

The map above not only shows what percent of residents are of Asian descent in each county, but also what Asian subgroup is most dominant. For example, in Washtenaw and Livingston counties, those of Chinese descent make up the majority of the Asian population. However, in St. Clair County, those of Filipino descent are the most common subgroup; Asian Indian descent is the most common subgroup for the remaining counties and the City of Detroit (Note that this identity may also be selected by those with Bangladeshi or Pakistani backgrounds who often choose this designation).

While the first map showed the most dominant Asian subcultures represented in each county, this map shows what cultures are most represented in each community.

As may have been expected by the first map, those of Asian Indian descent were most heavily represented in Wayne, Oakland and Macomb counties.  However, in the City of Taylor and on Grosse Ile, located in Wayne County, those of Pakistani descent were the most represented. In Pontiac in Oakland County, those of Hmong descent were the most represented Asian subgroup.

The previous maps showcased what Asian subgroups were represented throughout the region and this one shows the percentage of residents of Asian descent in each community. At 19.6 percent, the City of Troy in Oakland County had the highest percent of residents with Asian descent of all the communities in the region. The majority (48.4 percent of Asians) are of an Asian Indian background, followed by Chinese (25.2%) and Koreans (9.3%). Also in Oakland County, the City of Novi has a high percentage of residents of Asian descent; this percentage is 16.5.

The highest proportion of Asian residents in Wayne County was in Hamtramck at 18.9% (second in the region, behind Troy).  Residents identified Asian Indian (1,882) as the predominant subculture, ahead of Bangladeshi (1,664), however, the country of birth for Hamtramck residents during the same period was listed as India for 43 residents, and Bangladesh for 2,928, suggesting that many Bangladeshis may have identified as Asian Indian.

In Washtenaw County, Ann Arbor Township has the highest percent of residents of Asian descent. This percentage is 16.1, majority of whom are Japanese. The city of Ann Arbor’s population is at 14.6 percent, majority of whom are Chinese.

The map above is a dot-density map of Asian subgroups, showing where residents live, instead of the percentage of the population. From this map you can see that while there may be a smaller percentage of the population that is Asian in some areas, the actual number of residents of Asian descent in highly populated areas may be large. There is a large number of Asian residents forming a semi-circle around the north and west of the City of Detroit, and some sub-group patterns arise. Hmong Asians live primarily in Pontiac and along the Macomb and Wayne county borders. Pakistanis form a cohesive presence between the airport and the river. Laotians dominate the New Haven area.

Within Wayne County, in addition to the Pakistanis, Cambodians are prevalent in Garden City and Hmong in Northeast Detroit. The large numbers of Asians in Northwest Wayne demonstrates an eclectic mix of cultures, and is more apparent when viewed with dot-density rather than percentage.

In the Detroit area, the expanse of the Hmong is apparent up the Gratiot Avenue corridor into Macomb beyond Detroit. Various ethnicities have chosen small areas of Detroit to call home, including Filipinos near and in Hazel park, Chinese in west Detroit neighborhoods, Thais near Redford, Pakistanis and Japanese on the East side.

Wayne County has highest pregnancy, abortion rates

In this post we examine rates in the region related to fertility and pregnancy including abortion and birth rates. In all four of the maps shown below, Wayne County’s rates are above the state average are also the highest in the region. All rates were obtained from the Michigan Department of Community Health and are based on birth rates per 1,000 residents for population ages 15-44.

The fertility rate is defined as the number of live births per 1,000 women between the ages of 15 and 44, according to the Michigan Department of Community Health.

For the State of Michigan, the average fertility rate in 2013 was 59.3. Wayne County was the only county in the seven-county region whose fertility rate was higher than the state average at 64.8. Washtenaw County had the lowest fertility rate at 44.0.

The pregnancy rate is defined as the sum of live births, abortions and estimated miscarriages per 1,000 women between the ages of 15 and 44, according to the Michigan Department of Community Health. In 2013, Macomb and Wayne Counties both reported pregnancy rates above the state average of 85.9, although Macomb County was only slightly above average, with a rate of 86.6. Wayne County’s rate was more than 20 points above the state average at 109.9.

The birth rate is defined as the number of live births per 1,000 residents, according to the Michigan Department of Community Health.  The state average for the birth rate in 2013, was 11.4. Wayne County’s birth rate was the only county in the region above the state average at 13.1. Monroe and Livingston counties had the lowest birth rates in the region, with both reporting at 9.2.

Earlier this year, several local media outlets reported on Detroit’s high abortion rate. To read more, click here.